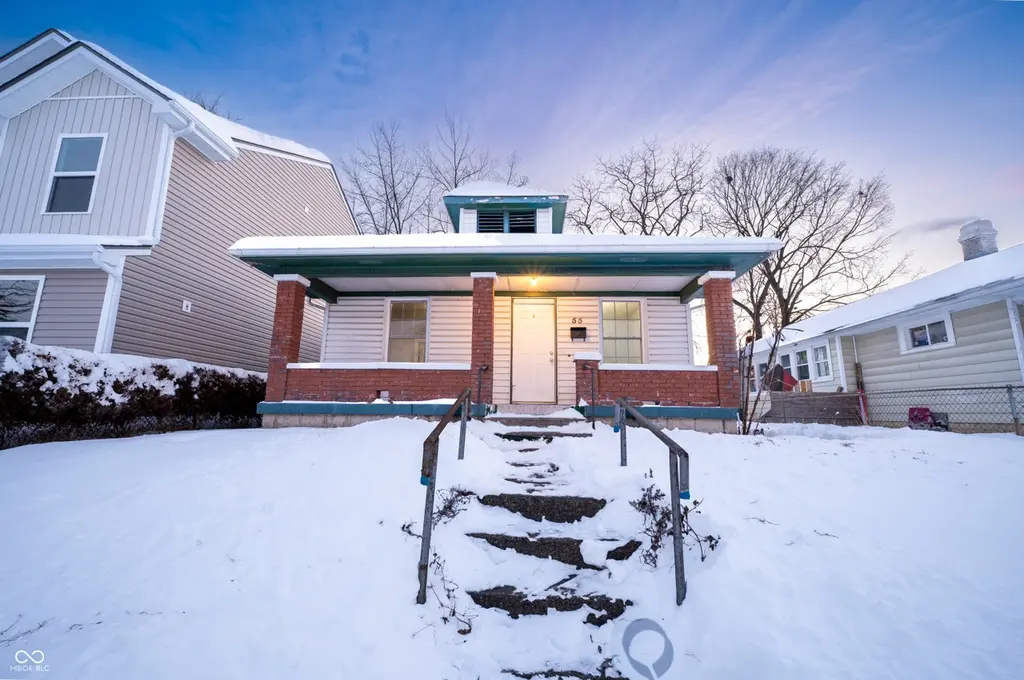
55 S Chester Ave · Indianapolis city (balance), IN
Flood risk 1/10 · Minimal
- FEMA flood zone
- X (unshaded)
- Chance of flooding over 30 yrs
- 0.0%
- Est. flood insurance / yr
- $473 – $860
Fire risk 1/10 · Minimal
- Est. fire insurance / yr
- $717 – $1,331
Heat risk 4/10 · Minor
- Hot days now (above 102°F)
- 7 days/yr
- Hot days in 30 yrs
- 19 days/yr
Wind risk 2/10 · Minimal
- Chance of severe wind over 30 yrs
- 1.0%
Air-quality risk 4/10 · Minor
- Unhealthy air days now
- 5 days/yr
- Unhealthy air days in 30 yrs
- 7 days/yr
Risk factors via First Street. Map © Google.
Why this score? — see what drove the C grade
The composite is a weighted blend of 9 inputs, each scored 0–100. Each bar is that input's sub-score; the figure is the points it added to the 100-point composite (weight × sub-score).
- Cash flow +18.5/30.0
- ARV discount +15.0/15.0
- 1% rule +5.8/10.0
- DSCR +5.8/10.0
- Rent growth +4.3/5.0
- Livability +2.5/5.0
- Condition / age +2.5/5.0
- Schools +1.4/10.0
- Appreciation +0.0/10.0
$101,900
🖨 Deal sheet 📄 Offer letter ✓ Due diligence
Listing remarks MLS
This 2-bedroom, 1-bath property offers character throughout while still leaving room for you to make it your own. Recent updates include new plumbing, a new garage door, and a new garage roof. Step outside to a spacious, fenced backyard.
Key facts
- New plumbing
- New garage roof
- Porch
Tags
Neighborhood map
What this means for you Summary
Snapshot
- This is a 2-bed/1.0-bath single-family listed at $102k.
Deal economics
- At list price, monthly cash flow is $96 ($1k/yr) — positive.
- The deal already cash-flows at list — no discount required.
- Meets the 1% rule at list price ($1k rent vs $102k).
- Recommended offer: $90k (12.0% below list) — sets the bar for market timing.
- Cap rate 7.4% vs local median 4.4% in Indianapolis city (balance) — top-decile yield for the area; either an underpriced asset or a hidden risk that comps aren't pricing in. Stress-test before assuming the spread holds.
Location & tenants
- Location reads: area grade C — affects rentability + tenant quality, not the cash-flow math above.
- Indianapolis Public Schools (urban): math 14% / reading 20% proficiency, ranked #286 of 301 in IN (top 95%) — low school quality limits family demand, transient renter base, plan for 1-2y turnover; 77% free/reduced lunch — lower-income household profile, screen leases tightly.
- Market conditions: Rents rising fast (+7.3%/yr); 480 active listings in the ZIP; 40 comparable units currently listed for rent nearby; rentals at typical pace (median 24d on market — plan ~3-4 weeks tenant-placement turnaround); 42% of comp listings sitting > 30 days — soft ceiling on asking rent; 1,906 units permitted in Marion County in 2024 (621 in 5+ unit buildings).
Forward outlook
- Local home prices are declining (-3.0%/yr); year-one equity from $705 of loan paydown is wiped out by about $3k of value loss. Plan a longer hold.
- Marion County population projected at +18% by 2050 — long-run rental-demand tailwind backs the buy-and-hold thesis.
- At projected returns (-3.0% appreciation + 7.3% rent growth), your $29k cash investment doubles in ~10 years — after that, you're playing with house money.
Negotiation context
- It's been on market 141 days — a 12% lower offer ($90k) is reasonable based on typical stale-listing flexibility.
- 5 sale attempts since 25y ago; this cycle's ask has dropped $18k (15%) from the opening price — seller is motivated, your offer sets the floor, not the list.
Risks & watch-outs
- Watch-outs: built in 1919 — expect roof / HVAC / electrical / plumbing capex.
Questions for the listing agent
- It's been on market 141 days. Have you received any prior offers? Is the seller open to a 12% concession, seller financing, or rate buy-down credit?
- Built in 1919 — when were the roof, HVAC, electrical panel, plumbing, and water heater last replaced?
- Why hasn't it sold? Are there any deal-killer items the seller is aware of (foundation, flood, title, zoning, code violations)?
- Is there a deadline driving the sale (1031 exchange, divorce, estate, relocation)? That informs how much negotiation room exists.
- What's the average days-on-market for RENTAL listings here right now (not sales)? A rising rental-DOM trend means longer vacancies and softer asking-rent achievability than the comps imply.
- What's the recent tenant-quality profile in this submarket — average credit score on applications, eviction rate, late-payment / NSF rate, and stable-employment percentage? A property-management company in the area should have these aggregated.
- How much new for-sale + rental construction is in the pipeline within 1–3 miles? Heavy new supply typically softens prices + rents 12–24 months out; constrained supply supports both.
Investment metrics
- 1% rule
- 1.08% ✓
- Cap rate
- 7.43%
- Cash-on-cash
- 4.05%
- DSCR
- 1.18
- GRM
- 7.7
CMA / ARV
- ARV (median comp)
- $158,002
- List price
- $101,900
- Delta
- -35.51%
- Verdict
- UNDERPRICED
- Comps
- 20 within 1.0 mi
Show comp detail 12 sales within ~0.75 mi
| Address | Dist | Beds/Ba | Sqft | Sold | Price | $/sf | Match |
|---|---|---|---|---|---|---|---|
| 3919 Spann Ave | 0.61mi | 2/1.0 | 864 (-1%) | 10mo | $74,000 | $86 | 62 |
| 3909 Hoyt Ave | 0.74mi | 2/1.0 | 864 (-1%) | 7mo | $120,000 | $139 | 58 |
| 334 N Chester Ave | 0.37mi | 3/2.0 (+1) | 912 (+5%) | 13mo | $175,000 | $192 | 56 |
| 330 N Lasalle St | 0.70mi | 2/1.0 | 840 (-4%) | 8mo | $35,000 | $42 | 54 |
| 4648 Brookville Rd | 0.51mi | 3/2.0 (+1) | 936 (+7%) | 3mo | $189,900 | $203 | 53 |
| 3847 Hoyt Ave | 0.74mi | 2/1.0 | 912 (+5%) | 6mo | $75,000 | $82 | 53 |
| 545 Dayton Ave | 0.75mi | 3/1.0 (+1) | 896 (+3%) | 6mo | $101,000 | $113 | 50 |
| 3106 Newton Ave | 0.73mi | 3/2.0 (+1) | 912 (+5%) | 1mo | $95,500 | $105 | 49 |
| 111 N Gale St | 0.49mi | 2/1.0 | 754 (-14%) | 7mo | $127,000 | $168 | 48 |
| 3730 E Pleasant Run Parkway North Dr | 0.64mi | 3/1.0 (+1) | 912 (+5%) | 15mo | $147,900 | $162 | 45 |
| 4113 Fletcher Ave | 0.68mi | 3/1.0 (+1) | 912 (+5%) | 15mo | $155,000 | $170 | 44 |
| 3954 Fletcher Ave | 0.64mi | 2/1.0 | 979 (+12%) | 14mo | $25,000 | $26 | 38 |
Match score weights: distance 35% · size 25% · config 20% · recency 20%. Top-matched comps best support the ARV.
Projected returns pro-forma
-3.0% appreciation · 7.31% rent growth · sell at horizon
- IRR
- -4.8%
- Equity multiple
- 0.81×
- Total profit
- $-5,356
- Equity at exit
- $15,194
- IRR
- 9.7%
- Equity multiple
- 1.90×
- Total profit
- $25,761
- Equity at exit
- $8,810
Cash invested: $28,532 (down + closing). Projections, not guarantees.
Landlord ↔ Tenant lean methodology
- Overall (STATE)
- 90 Strongly Landlord-Friendly
- State Indiana
- 90 Strongly Landlord-Friendly · R+11
- County
- — inherits STATE
- City
- — inherits STATE
ZIP-level market 46201
- Home prices YoY
- -33.9%
- Rents YoY
- 7.3%
- Active inventory
- 480
- Price-to-rent
- 7.7×
Monthly cashflow live
- Estimated rent
- $1,099 high interval (Pro) →
- Mortgage (P&I)
- −$534
- Tax from tax record
- −$195 /mo · $2,339/yr
- Insurance
- −$42
- HOA
- −$0
- Vacancy / Maint / Mgmt
- −$231
- Net cashflow
- $96
Break-even live
UW: 25.0% down · 7.5% · 30yr · 1.5% tax · 5.0% vac · 8.0% maint · 8.0% mgmt
Financing live
Cash to close
- Down payment
- $25,475
- Closing costs
- $3,057
- Reserves months
- —
- Total cash needed
- —
Loan-product check · same deal, 3 products live
Conventional
25% down · 7.5% · 30yr
- Down + closing
- —
- Monthly P&I
- —
- Monthly cashflow
- —
- DSCR
- —
- Eligible?
- —
Personal DTI + credit; lowest rate.
DSCR
20% down · 8.5% · 30yr
- Down + closing
- —
- Monthly P&I
- —
- Monthly cashflow
- —
- DSCR
- —
- Eligible?
- —
No personal income docs; deal must DSCR.
Hard money
10% down · 12.0% · 12mo
- Down + closing
- —
- Monthly P&I
- —
- Monthly cashflow
- —
- DSCR
- —
- Eligible?
- —
Short-term bridge; refi at stabilization.
Rent comps 40 comps
| Address | Beds | Baths | Sqft | Rent | $/sqft | DOM | Units | Dist |
|---|---|---|---|---|---|---|---|---|
| 4114 E Washington St Indianapolis, IN | 2.0 | 1.0 | 909 | $1,100 | $1.21 | 44d | 1 | 0.14mi |
| 4214 E Washington St Indianapolis, IN | 3.0 | 2.0 | 961 | $1,195 | $1.24 | 7d | 1 | 0.17mi |
| 37 S Sherman Dr Indianapolis, IN | 1.0 | 1.0 | 700 | $800 | $1.14 | 23d | 1 | 0.21mi |
| 412 N Bradley Ave Unit 3 Indianapolis, IN | 2.0 | 1.0 | 700 | $950 | $1.36 | 23d | 1 | 0.43mi |
| 83 N Ewing St Unit 83 Indianapolis, IN | 3.0 | 1.0 | 1016 | $1,199 | $1.18 | 43d | 1 | 0.44mi |
| 3622 E New York St Indianapolis, IN | 2.0 | 1.0 | 805 | $995 | $1.24 | 43d | 1 | 0.44mi |
| 4741 E Washington St Indianapolis, IN | 1.0 | 1.0 | 700 | $950 | $1.36 | 21d | 1 | 0.47mi |
| 521 N Gladstone Ave Indianapolis, IN | 1.0 | 1.0 | 816 | $1,100 | $1.35 | 20d | 1 | 0.52mi |
| 521 N Gladstone Ave Unit B Indianapolis, IN | 1.0 | 1.0 | 816 | $900 | $1.10 | 7d | 1 | 0.52mi |
| 37 S Tuxedo St Indianapolis, IN | 3.0 | 1.0 | 950 | $1,150 | $1.21 | 43d | 1 | 0.54mi |
| 4815 E Washington St Unit 4815-10 Indianapolis, IN | 1.0 | 1.0 | 600 | $950 | $1.58 | 21d | 1 | 0.54mi |
| 4815 E Washington St Unit 4815-04 Indianapolis, IN | 1.0 | 1.0 | 600 | $895 | $1.49 | 43d | 1 | 0.54mi |
| 4815 E Washington St Unit 4815-12 Indianapolis, IN | 1.0 | 1.0 | 700 | $950 | $1.36 | 43d | 1 | 0.54mi |
| 4831 E Washington St Unit 4 Indianapolis, IN | 2.0 | 2.0 | 1000 | $995 | $0.99 | 23d | 1 | 0.56mi |
| 622 N Linwood Ave Indianapolis, IN | 3.0 | 2.0 | 985 | $1,299 | $1.32 | 43d | 1 | 0.62mi |
| 4926 E Washington St Apt 5 Indianapolis, IN | 1.0 | 1.0 | 700 | $895 | $1.28 | 43d | 1 | 0.65mi |
| 28 S Dearborn St Unit A Indianapolis, IN | 3.0 | 1.0 | 1100 | $1,400 | $1.27 | 10d | 1 | 0.68mi |
| 270 S Lasalle St Indianapolis, IN | 3.0 | 2.0 | 562 | $1,329 | $2.36 | 7d | 1 | 0.69mi |
| 810 N Euclid Ave Indianapolis, IN | 3.0 | 1.0 | 574 | $1,550 | $2.70 | 19d | 1 | 0.70mi |
| 706 N Bosart Ave Indianapolis, IN | 2.0 | 1.0 | 1000 | $1,070 | $1.07 | 23d | 1 | 0.70mi |
| 821 N Bradley Ave Indianapolis, IN | 1.0 | 1.0 | 663 | $850 | $1.28 | 4d | 1 | 0.73mi |
| 3906 Hoyt Ave Indianapolis, IN | 2.0 | 1.0 | 912 | $1,250 | $1.37 | 7d | 1 | 0.73mi |
| 4919 Orion Ave Indianapolis, IN | 2.0 | 1.0 | 766 | $875 | $1.14 | 43d | 1 | 0.73mi |
| 822 N Bradley Ave Unit 822 Indianapolis, IN | 3.0 | 1.0 | 1100 | $1,200 | $1.09 | 43d | 1 | 0.73mi |
| 833 N Gladstone Ave Indianapolis, IN | 1.0 | 1.0 | 687 | $825 | $1.20 | 23d | 1 | 0.73mi |
| 729 N Bosart Ave Indianapolis, IN | 2.0 | 1.0 | 888 | $1,195 | $1.35 | 23d | 1 | 0.75mi |
| 4417 Linwood Ct Indianapolis, IN | 2.0 | 1.0 | 780 | $929 | $1.19 | 3d | 15 | 0.75mi |
| 528 S Bosart Ave Indianapolis, IN | 3.0 | 1.0 | 720 | $1,305 | $1.81 | 43d | 1 | 0.75mi |
| 3706 Hoyt Ave Indianapolis, IN | 3.0 | 1.0 | 960 | $1,500 | $1.56 | 13d | 1 | 0.78mi |
| 3702 Hoyt Ave Indianapolis, IN | 3.0 | 2.0 | 960 | $1,500 | $1.56 | 13d | 1 | 0.78mi |
| 301 S Gray St Indianapolis, IN | 2.0 | 1.0 | 841 | $1,025 | $1.22 | 23d | 1 | 0.78mi |
| 340 S Dearborn St Indianapolis, IN | 2.0 | 1.0 | 873 | $1,180 | $1.35 | 23d | 1 | 0.79mi |
| 25 S Emerson Ave Indianapolis, IN | 1.0 | 1.0 | 710 | $649 | $0.91 | 43d | 1 | 0.81mi |
| 235 N Oakland Ave Indianapolis, IN | 2.0 | 1.0 | 800 | $1,000 | $1.25 | 43d | 1 | 0.82mi |
| 927 N Chester Ave Indianapolis, IN | 1.0 | 1.0 | 596 | $750 | $1.26 | 43d | 1 | 0.83mi |
| 896 N Gladstone Ave Indianapolis, IN | 1.0 | 1.0 | 580 | $775 | $1.34 | 43d | 1 | 0.83mi |
| 510 N Dearborn St Indianapolis, IN | 3.0 | 1.0 | 1008 | $1,350 | $1.34 | 43d | 1 | 0.84mi |
| 861 N Drexel Ave Unit 863 Indianapolis, IN | 3.0 | 1.0 | 1000 | $1,200 | $1.20 | 43d | 1 | 0.84mi |
| 861 N Drexel Ave Indianapolis, IN | 3.0 | 1.0 | 1000 | $1,200 | $1.20 | 7d | 1 | 0.84mi |
| 628 N Riley Ave Indianapolis, IN | 2.0 | 1.5 | 948 | $1,295 | $1.37 | 23d | 1 | 0.85mi |
Listing history 26 events
-
2026-06-18days on market $101,900 Active 141 DOM
-
2026-06-17days on market $101,900 Active 140 DOM
-
2026-06-16days on market $101,900 Active 139 DOM
-
2026-06-15days on market $101,900 Active 138 DOM
-
2026-06-13days on market $101,900 Active 136 DOM
-
2026-06-13days on market $101,900 Active 135 DOM
-
2026-06-09days on market $101,900 Active 132 DOM
-
2026-06-08days on market $101,900 Active 131 DOM
-
2026-06-07days on market $101,900 Active 130 DOM
-
2026-06-03days on market $101,900 Active 126 DOM
-
2026-06-02days on market $101,900 Active 125 DOM
-
2026-06-01days on market $101,900 Active 124 DOM
-
2026-05-31days on market $101,900 Active 123 DOM
-
2026-04-14price $101,900 239-char remark
Show marketing remark (239 chars)
This 2-bedroom, 1-bath property offers character throughout while still leaving room for you to make it your own. Recent updates include new plumbing, a new garage door, and a new garage roof. Step outside to a spacious, fenced backyard.
-
2026-03-16price $110,900 239-char remark
Show marketing remark (239 chars)
This 2-bedroom, 1-bath property offers character throughout while still leaving room for you to make it your own. Recent updates include new plumbing, a new garage door, and a new garage roof. Step outside to a spacious, fenced backyard.
-
2026-02-17price $114,900 239-char remark
Show marketing remark (239 chars)
This 2-bedroom, 1-bath property offers character throughout while still leaving room for you to make it your own. Recent updates include new plumbing, a new garage door, and a new garage roof. Step outside to a spacious, fenced backyard.
-
2026-01-28$119,900 Active 239-char remark
Show marketing remark (239 chars)
This 2-bedroom, 1-bath property offers character throughout while still leaving room for you to make it your own. Recent updates include new plumbing, a new garage door, and a new garage roof. Step outside to a spacious, fenced backyard.
-
2026-01-20historical
-
2025-12-03$138,900 Active
-
2022-12-19soldstatus $94,900 Closed
-
2022-12-07status Pending
-
2022-11-29$94,900 Active
-
2005-02-10soldstatus $25,000
-
2004-12-03$26,900
-
2002-07-30historical
-
2001-09-27
ⓘ Source: listings_history table (triggers on properties + properties_extension) + one-shot
backfill from property_details.listing_events for pre-trigger history.
Tax reassessment forecast IN · Partial reset (capped growth)
- Current annual tax
- $2,339 · $195/mo
- Projected year-2 tax
- $2,339 · $195/mo
- Expected delta
- $0/yr ($0/mo · 0.0%)
ⓘ Screening estimate from a state-policy table — verify with the county assessor before closing.
Climate risk First Street
- Flood 1/10 Low FEMA zone X (unshaded) · 0% chance over 30 yrs
- Wildfire 1/10 Low
- Heat 4/10 Moderate 7 d/yr ≥102°F today · 19 d/yr by 30 yrs out
- Wind 2/10 Low 100% chance of damaging wind over 30 yrs
- Air quality 4/10 Moderate 5 unhealthy d/yr today · 7 by 30 yrs out
Nearby sold comps map
Loading sold comps map…
Walkable amenities ~0.75 mi
Loading nearby amenities…
Taxation est. · year 1
- Rental income
- $13,184
- − Mortgage interest
- −$5,708
- − Property taxes
- −$2,339
- − Insurance
- −$510
- − Repairs & maintenance
- −$1,055
- − Management
- −$1,055
- − Depreciation
- −$2,964
- Taxable loss
- −$446
- Est. tax savings @ 24.0%
- +$107
- After-tax cash flow
- $1,262/yr
For passive investors: Depreciation is non-cash, so a rental often shows a tax loss while cash-flowing — sheltering income. Rental losses are passive: they offset passive income freely, and up to $25,000/yr can offset ordinary (W-2) income if you actively participate and your MAGI is under $100k (phasing out to $0 by $150k); unused losses carry forward. On sale, claimed depreciation is recaptured at up to 25%, and gains may owe capital-gains tax (a 1031 exchange can defer both). Figures are a year-1 estimate at your 24.0% rate — not tax advice; consult a CPA.
Schools (NCES district)
- District
- Indianapolis Public Schools
- NCES district ID
- 1804770
- Math proficiency
- 14% ▼ -7.00%
- Reading proficiency
- 20% ▼ -3.00%
- Median HH income
- $32,034
- Composite
- 13.69/100
- National rank
- #9499
- State rank
- #286 of 301 in IN
Livability — Indianapolis city (balance)
No livability data for this city. (Only ~50 U.S. cities are tracked.)
Census & demographics
- Census place
- Indianapolis city (balance), IN
- County
- Marion County · 998,460 people
- City population
- 881,119
- Metro
- Indianapolis-Carmel-Anderson, IN
- Population (ZIP)
- 30,335
- Household income
- $49,195
- Rent vs Own
- Severe rent burden
- 1906.0
Population outlook (Marion County) Hauer SSP2
- Today (2025)
- 1,025,572 people
- By 2030
- 1,065,727 · +3.9%
- By 2040
- 1,141,577 · +11.3%
- By 2050
- 1,208,920 · +17.9%
- By 2075
- 1,367,288 · +33.3%
- By 2100
- 1,438,201 · +40.2%
Race, ethnicity, and origin ACS 2023
- Neighborhood character
- Diverse neighborhood (Simpson 0.63)
- Race & ethnicity
- White 53% Hispanic / Latino 23% Black 18% Two or more races 9%
- Hispanic origin (detail)
- Mexican 14% Puerto Rican 2%
- Common ancestry
- Slovak 2% Lithuanian 2% Italian 1%
- Foreign-born
- 9% · Canada
- Languages at home
- 81% English-only · Spanish 17%
Political lean MEDSL · Marion
- 2024 margin
- Strong D (+27.7) · D 63.0% · R 35.3% · Other 1.7%
- 2008→2024 swing
- -0.7pp no change · 2008: 28.4pp · 2024: 27.7pp
- All cycles
- 2024: D+27.7 2020: D+29.1 2016: D+22.8 2012: D+22.2 2008: D+28.4
Not yet ingested
- Civics
- —
Market trends
- HPI YoY
- ▼ -192.51%
- Current HPI
- 375.0969
- Rent YoY
- ▲ 7.31%
- Metro
- Indianapolis-Carmel-Anderson, IN
- State GDP YoY
- ▲ 2.90%
- F500 in state
- 18
Industry mix (Fortune 500 HQ in IN)
| Industry | F500 HQs | Revenue |
|---|---|---|
| Industrial Machinery | 2 | $37B |
|
||
| Healthcare | 1 | $177B |
|
||
| Pharmaceuticals | 1 | $45B |
|
||
| Metals / Steel | 1 | $18B |
|
||
| Agriculture | 1 | $17B |
|
||
| Packaging | 1 | $12B |
|
||
Price history
+278.8% since first listed13 events — show timeline
- 2026-04-14 Price Changed $101,900 MIBOR as Distributed by MLS Grid
- 2026-03-16 Price Changed $110,900 MIBOR as Distributed by MLS Grid
- 2026-02-17 Price Changed $114,900 MIBOR as Distributed by MLS Grid
- 2026-01-28 Listed $119,900 MIBOR as Distributed by MLS Grid
- 2026-01-20 Listing Removed — MIBOR as Distributed by MLS Grid
- 2025-12-03 Listed $138,900 MIBOR as Distributed by MLS Grid
- 2022-12-19 Sold (MLS) $94,900 MIBOR as Distributed by MLS Grid
- 2022-12-07 Pending — MIBOR as Distributed by MLS Grid
- 2022-11-29 Listed $94,900 MIBOR as Distributed by MLS Grid
- 2005-02-10 Sold (MLS) $25,000 MIBOR as Distributed by MLS Grid
- 2004-12-03 Listed $26,900 MIBOR as Distributed by MLS Grid
- 2002-07-30 Listing Removed — MIBOR as Distributed by MLS Grid
- 2001-09-27 Listed — MIBOR as Distributed by MLS Grid
Property tax history
+8.2%/yrLatest (2025): $2,339 · +15.3% YoY. Source: county tax records.
Cash-flow waterfall
monthlySold comps — $/sqft
last 12 mo · ≤1 miLoading sold comps…