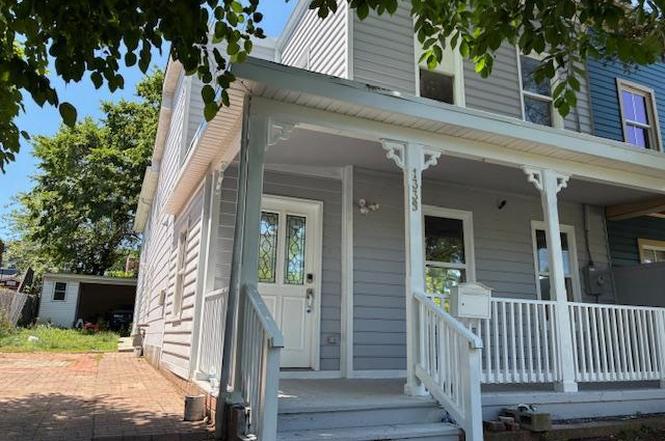
1339 U St SE · Washington, DC
Flood risk 1/10 · Minimal
- FEMA flood zone
- X (unshaded)
- Chance of flooding over 30 yrs
- 0.0%
- Est. flood insurance / yr
- $507 – $1,088
Fire risk 1/10 · Minimal
- Est. fire insurance / yr
- $631 – $1,173
Heat risk 8/10 · Major
- Hot days now (above 104°F)
- 7 days/yr
- Hot days in 30 yrs
- 15 days/yr
Wind risk 4/10 · Minor
- Chance of severe wind over 30 yrs
- 17.0%
Air-quality risk 4/10 · Minor
- Unhealthy air days now
- 4 days/yr
- Unhealthy air days in 30 yrs
- 5 days/yr
Risk factors via First Street. Map © Google.
Why this score? — see what drove the C- grade
The composite is a weighted blend of 9 inputs, each scored 0–100. Each bar is that input's sub-score; the figure is the points it added to the 100-point composite (weight × sub-score).
- Cash flow +15.4/30.0
- ARV discount +14.6/15.0
- DSCR +4.7/10.0
- Livability +3.7/5.0
- Schools +3.6/10.0
- Rent growth +3.5/5.0
- 1% rule +3.4/10.0
- Condition / age +2.5/5.0
- Appreciation +0.0/10.0
$580,000
🖨 Deal sheet (PDF) 📄 Offer letter ✓ Due diligence
Listing remarks
Motivated sellers. Priced improved. This charming Colonial twin home offers a perfect blend of comfort and community, featuring six spacious bedrooms and three full bathrooms. The inviting layout is enhanced by a cozy fireplace, perfect for gathering with loved ones during chilly evenings. The main floor laundry adds convenience to your daily routine, while the enclosed patio provides a serene space to unwind or entertain. The kitchen is equipped with modern stainless steel appliances, including a gas oven/range, refrigerator, and disposal, making meal preparation a delight. Nestled in a vibrant neighborhood, this home is just a stone's throw from local parks, where you can enjoy leisurely
Key facts
- Main floor laundry
- Metro subway station
- Cozy fireplace
Tags
Property features AI
Exterior
- Parking: Dirt driveway; Driveway parking with 4 spaces (4 total garage/parking spaces reported)
- Utilities: Public water; Public septic; Electric available; Natural gas available; Sewer available; Hot water: natural gas
- Home design: Semi-detached; Two stories; Historic property; Fee simple ownership
- Construction: Combination construction materials; Crawl space foundation; Double-pane windows; Effective year of major remodel: 2005
- Exterior features: Large lot; Wood fencing; Enclosed patio/porch; Shed and shed shop (other structures above grade)
Interior
- Kitchen: Stainless steel appliances; Gas oven/range; Refrigerator; Exhaust fan
- Bedrooms: Four bedrooms on the upper level; Two bedrooms on the main level
- Flooring: Hardwood; Ceramic tile; Carpet
- Bathrooms: Two full bathrooms on the upper level; One full bathroom on the main level; Three full bathrooms total
- Heating & cooling: Central heating (natural gas); Central air conditioning (electric)
- Interior features: Wood floors; Dry wall walls and ceilings; Has fireplace (1)
- Laundry & utility: Washer; Dryer (gas); Laundry located on the main floor
Neighborhood map
What this means for you Summary
Snapshot
- This is a 4-bed/2.5-bath single-family listed at $580k.
Deal economics
- At list price, monthly cash flow is $220 ($3k/yr) — positive.
- The deal already cash-flows at list — no discount required.
- To meet the 1% rule (rent ≥ 1% of price), the offer needs to be $485k (16.4% below list).
- Recommended offer: $485k (16.4% below list) — sets the bar for 1% rule.
- Cap rate 6.7% vs local median 2.5% in Washington — top-decile yield for the area; either an underpriced asset or a hidden risk that comps aren't pricing in. Stress-test before assuming the spread holds.
Location & tenants
- Location reads 73/100 on livability (#1 in DC) — a middle-class / working-renter tenant base. Strengths: amenities A+, commute A+, employment A+; Watch: crime F, cost of living F.
- District Of Columbia Public Schools (urban): math 33% / reading 40% proficiency, ranked #8 of 32 in DC (top 25%) — families likely to look elsewhere, expect single-tenant / working-renter base with shorter leases; 65% free/reduced lunch — lower-income household profile, screen leases tightly.
- Zoned schools: Ketcham Es (284 students, 0% FRL); Kramer Ms (203 students, 0% FRL); Anacostia Hs (287 students, 0% FRL) — zoned schools average 0% FRL vs 65% district-wide (65 pts lower); this property's tenant base skews higher-income than the district average.
- Market conditions: Rents rising (+3.9%/yr); 298 active listings in the ZIP; 20 comparable units currently listed for rent nearby; rentals at typical pace (median 26d on market — plan ~3-4 weeks tenant-placement turnaround); 1,737 units permitted in District of Columbia in 2024 (1,506 in 5+ unit buildings).
- At $4,851/mo this rent would consume 108% of the median local household income ($54k/yr) (locally 5148% of renters already pay >50% of income on rent) — very limited rent-growth headroom before tenants either downsize or default.
Forward outlook
- Local home prices are declining (-3.0%/yr); year-one equity from $4k of loan paydown is wiped out by about $17k of value loss. Plan a longer hold.
- District of Columbia County population projected at +50% by 2050 — long-run rental-demand tailwind backs the buy-and-hold thesis.
Negotiation context
- It's been on market 146 days — a 12% lower offer ($510k) is reasonable based on typical stale-listing flexibility.
- 4 sale attempts since 24y ago with the ask held roughly flat each time — persistent listings suggest the price (not the market) is what's stuck; bring a comps-based counter.
- Current owner paid $95k; list at $580k implies a 511% gain — meaningful room to come down on a strong offer.
Risks & watch-outs
- Watch-outs: built in 1905 — expect roof / HVAC / electrical / plumbing capex.
- Climate carrying-cost: extreme-heat days projected 7→15/yr by 2055 (HVAC capex compounding) — expect insurance premiums to compound above CPI over the hold.
Questions for the listing agent
- It's been on market 146 days. Have you received any prior offers? Is the seller open to a 16% concession, seller financing, or rate buy-down credit?
- Built in 1905 — when were the roof, HVAC, electrical panel, plumbing, and water heater last replaced?
- Why hasn't it sold? Are there any deal-killer items the seller is aware of (foundation, flood, title, zoning, code violations)?
- Is there a deadline driving the sale (1031 exchange, divorce, estate, relocation)? That informs how much negotiation room exists.
- Crime grade is F in this area — have there been break-ins, vandalism, or insurance claims at this property in the last 3 years? What carrier currently insures it and at what premium?
- What's the average days-on-market for RENTAL listings here right now (not sales)? A rising rental-DOM trend means longer vacancies and softer asking-rent achievability than the comps imply.
- What's the recent tenant-quality profile in this submarket — average credit score on applications, eviction rate, late-payment / NSF rate, and stable-employment percentage? A property-management company in the area should have these aggregated.
- How much new for-sale + rental construction is in the pipeline within 1–3 miles? Heavy new supply typically softens prices + rents 12–24 months out; constrained supply supports both.
Investment metrics
- 1% rule
- 0.84% ✗
- Cap rate
- 6.75%
- Cash-on-cash
- 1.63%
- DSCR
- 1.07
- GRM
- 10.0
CMA / ARV
- ARV (on-the-fly)
- $688,176
- Comps found
- 8
Show comp detail 8 sales within ~0.75 mi
| Address | Dist | Beds/Ba | Sqft | Sold | Price | $/sf | Match |
|---|---|---|---|---|---|---|---|
| 2247 Mount View Pl SE | 0.24mi | 4/3.5 | 2,663 (-6%) | 2mo | $730,000 | $274 | 73 |
| 1334 T St SE | 0.14mi | 4/4.0 | 2,802 (-1%) | 21mo | $750,000 | $268 | 68 |
| 1227 Talbert St SE | 0.40mi | 3/2.0 (-1) | 3,003 (+6%) | 3mo | $758,000 | $252 | 62 |
| 1361 Valley Pl SE | 0.25mi | 4/2.5 | 2,686 (-5%) | 22mo | $395,000 | $147 | 62 |
| 2316 Chester St SE | 0.25mi | 4/2.5 | 2,428 (-14%) | 8mo | $480,000 | $198 | 58 |
| 1516 S St SE | 0.25mi | 3/2.0 (-1) | 2,558 (-10%) | 15mo | $560,000 | $219 | 53 |
| 2211 R St SE | 0.68mi | 5/4.0 (+1) | 2,515 (-11%) | 0mo | $610,000 | $243 | 38 |
| 1501 Erie St SE | 0.60mi | 4/4.5 | 2,493 (-12%) | 9mo | $582,700 | $234 | 37 |
Match score weights: distance 35% · size 25% · config 20% · recency 20%. Top-matched comps best support the ARV.
Projected returns pro-forma
-3.0% appreciation · 3.86% rent growth · sell at horizon
- IRR
- -12.9%
- Equity multiple
- 0.53×
- Total profit
- $-75,913
- Equity at exit
- $86,480
- IRR
- -2.8%
- Equity multiple
- 0.81×
- Total profit
- $-31,077
- Equity at exit
- $50,148
Cash invested: $162,400 (down + closing). Projections, not guarantees.
Landlord ↔ Tenant lean methodology
- Overall (CITY)
- 0 Strongly Tenant-Friendly
- State District of Columbia
- 12 Strongly Tenant-Friendly · D+43
- County
- — inherits STATE
- City Washington
- 0 Strongly Tenant-Friendly · D+43
ZIP-level market 20020
- Rents YoY
- 3.9%
- Active inventory
- 298
- Price-to-rent
- 10.0×
Monthly cashflow live
- Estimated rent
- $4,851 high interval (Pro) →
- Mortgage (P&I)
- −$3,042
- Tax from tax record
- −$329 /mo · $3,950/yr
- Insurance
- −$242
- HOA
- −$0
- Vacancy / Maint / Mgmt
- −$1,019
- Net cashflow
- $220
Break-even live
Sensitivity live
| Price | -10% $548 | -5% $384 | +0% $220 | +5% $56 | +10% $-108 |
|---|---|---|---|---|---|
| Rent | -10% $-163 | -5% $28 | +0% $220 | +5% $412 | +10% $603 |
| Rate | -1.0pp $512 | -0.5pp $367 | base $220 | +0.5pp $70 | +1.0pp $-83 |
UW: 25.0% down · 7.5% · 30yr · 1.5% tax · 5.0% vac · 8.0% maint · 8.0% mgmt
Financing live
Cash to close
- Down payment
- $145,000
- Closing costs
- $17,400
- Reserves months
- —
- Total cash needed
- —
Loan-product check · same deal, 3 products live
Conventional
25% down · 7.5% · 30yr
- Down + closing
- —
- Monthly P&I
- —
- Monthly cashflow
- —
- DSCR
- —
- Eligible?
- —
Personal DTI + credit; lowest rate.
DSCR
20% down · 8.5% · 30yr
- Down + closing
- —
- Monthly P&I
- —
- Monthly cashflow
- —
- DSCR
- —
- Eligible?
- —
No personal income docs; deal must DSCR.
Hard money
10% down · 12.0% · 12mo
- Down + closing
- —
- Monthly P&I
- —
- Monthly cashflow
- —
- DSCR
- —
- Eligible?
- —
Short-term bridge; refi at stabilization.
Rent comps 20 comps
| Address | Beds | Baths | Sqft | Rent | $/sqft | DOM | Units | Dist |
|---|---|---|---|---|---|---|---|---|
| 1325 Valley Pl SE Washington, DC | 4.0 | 2.0 | 2138 | $6,500 | $3.04 | 26d | 1 | 0.23mi |
| 1433 Howard Rd SE Washington, DC | 5.0 | 3.5 | 2000 | $7,500 | $3.75 | 20d | 1 | 0.51mi |
| 1516 18th St SE Washington, DC | 3.0 | 2.0 | 1941 | $3,200 | $1.65 | 26d | 1 | 0.54mi |
| 2390 Elvans Rd SE Washington, DC | 3.0 | 2.5 | 2176 | $3,190 | $1.47 | 9d | 1 | 0.79mi |
| 1722 Gainesville St SE Washington, DC | 4.0 | 2.5 | 2000 | $3,490 | $1.75 | 26d | 1 | 0.80mi |
| 2520 Elvans Rd SE Washington, DC | 3.0 | 2.5 | 2760 | $3,800 | $1.38 | 26d | 1 | 0.84mi |
| 2530 Elvans Rd SE Unit B Washington, DC | 5.0 | 3.5 | 2760 | $7,500 | $2.72 | 9d | 1 | 0.85mi |
| 2320 Minnesota Ave SE Washington, DC | 3.0 | 3.5 | 2052 | $3,150 | $1.54 | 26d | 1 | 0.86mi |
| 1354 Pennsylvania Ave SE Washington, DC | 3.0 | 2.5 | 3200 | $4,500 | $1.41 | 9d | 1 | 1.02mi |
| 1016 G St SE Washington, DC | 3.0 | 2.5 | 2277 | $6,000 | $2.64 | 26d | 1 | 1.12mi |
| 3010 V Pl SE Washington, DC | 4.0 | 3.0 | 2232 | $3,500 | $1.57 | 26d | 1 | 1.18mi |
| 2928 Nelson Pl SE Unit 1 Washington, DC | 3.0 | 1.0 | 2720 | $2,300 | $0.85 | 26d | 1 | 1.28mi |
| 329 16th St SE Washington, DC | 3.0 | 3.0 | 2000 | $4,800 | $2.40 | 26d | 1 | 1.30mi |
| 1205 30th St SE Washington, DC | 3.0 | 1.0 | 3480 | $1,750 | $0.50 | 26d | 1 | 1.30mi |
| 629 S Carolina Ave SE Washington, DC | 4.0 | 4.5 | 4069 | $12,000 | $2.95 | 7d | 1 | 1.34mi |
| 1825 Massachusetts Ave SE Washington, DC | 3.0 | 2.5 | 1957 | $4,000 | $2.04 | 26d | 1 | 1.35mi |
| 2121 32nd Pl SE Unit Main Washington, DC | 3.0 | 3.0 | 3100 | $5,500 | $1.77 | 23d | 1 | 1.37mi |
| 237 15th St SE Unit 1 Washington, DC | 3.0 | 3.0 | 1938 | $4,500 | $2.32 | 26d | 1 | 1.39mi |
| 777 C St SE Washington, DC | 2.0–3.0 | 2.0–3.0 | 1839 | $14,994 | $8.15 | 5d | 3 | 1.45mi |
| 1240 Half St SW Washington, DC | 4.0 | 2.0 | 2000 | $4,650 | $2.33 | 20d | 1 | 1.46mi |
Listing history 29 events
-
2026-06-21days on market $580,000 Active 146 DOM
-
2026-06-18days on market $580,000 Active 143 DOM
-
2026-06-17days on market $580,000 Active 142 DOM
-
2026-06-16days on market $580,000 Active 141 DOM
-
2026-06-15days on market $580,000 Active 140 DOM
-
2026-06-13days on market $580,000 Active 138 DOM
-
2026-06-09days on market $580,000 Active 134 DOM
-
2026-06-08days on market $580,000 Active 133 DOM
-
2026-06-07days on market $580,000 Active 132 DOM
-
2026-06-04days on market $580,000 Active 129 DOM
-
2026-06-03days on market $580,000 Active 128 DOM
-
2026-06-02days on market $580,000 Active 127 DOM
-
2026-06-01days on market $580,000 Active 126 DOM
-
2026-05-31days on market $580,000 Active 125 DOM
-
2026-03-02price $580,000
-
2026-01-26$599,000 Active
-
2025-12-31historical
-
2025-08-03price $599,000
-
2025-06-05price $630,000
-
2025-06-05$600,000 Active
-
2025-06-04historical
-
2003-08-21soldstatus $95,000
-
2003-05-31soldstatus $95,000
-
2003-03-11historical
-
2002-11-26$99,900
-
2002-11-26historical
-
2002-08-23
-
1993-10-27soldstatus $93,150
-
1993-01-05soldstatus $23,400
ⓘ Source: listings_history table (triggers on properties + properties_extension) + one-shot
backfill from property_details.listing_events for pre-trigger history.
Tax reassessment forecast DC · Partial reset (capped growth)
- Current annual tax
- $3,950 · $329/mo
- Projected year-2 tax
- $3,950 · $329/mo
- Expected delta
- $0/yr ($0/mo · 0.0%)
ⓘ Screening estimate from a state-policy table — verify with the county assessor before closing.
Climate risk First Street
- Flood 1/10 Low FEMA zone X (unshaded) · 0% chance over 30 yrs
- Wildfire 1/10 Low
- Heat 8/10 Severe 7 d/yr ≥104°F today · 15 d/yr by 30 yrs out
- Wind 4/10 Moderate 17% chance of damaging wind over 30 yrs
- Air quality 4/10 Moderate 4 unhealthy d/yr today · 5 by 30 yrs out
Nearby sold comps map
Loading sold comps map…
Walkable amenities ~0.75 mi
Loading nearby amenities…
Taxation est. · year 1
- Rental income
- $58,214
- − Mortgage interest
- −$32,489
- − Property taxes
- −$3,950
- − Insurance
- −$2,900
- − Repairs & maintenance
- −$4,657
- − Management
- −$4,657
- − Depreciation
- −$16,873
- Taxable loss
- −$7,313
- Est. tax savings @ 24.0%
- +$1,755
- After-tax cash flow
- $4,394/yr
For passive investors: Depreciation is non-cash, so a rental often shows a tax loss while cash-flowing — sheltering income. Rental losses are passive: they offset passive income freely, and up to $25,000/yr can offset ordinary (W-2) income if you actively participate and your MAGI is under $100k (phasing out to $0 by $150k); unused losses carry forward. On sale, claimed depreciation is recaptured at up to 25%, and gains may owe capital-gains tax (a 1031 exchange can defer both). Figures are a year-1 estimate at your 24.0% rate — not tax advice; consult a CPA.
Schools (NCES district)
- District
- District Of Columbia Public Schools
- NCES district ID
- 1100030
- Math proficiency
- 33% ▲ 3.00%
- Reading proficiency
- 40% ▲ 5.00%
- Median HH income
- $67,671
- Composite
- 35.84/100
- National rank
- #9606
- State rank
- #8 of 32 in DC
Livability — Washington
- Score
- 73/100
- State rank
- #1
- US rank
- #5327
Category grades
Schools grade is shown separately in the Schools card above.
Census & demographics
- Census place
- Washington, DC
- County
- District of Columbia · 671,873 people
- City population
- 671,873
- Metro
- Washington-Arlington-Alexandria, DC-VA-MD-WV
- Population (ZIP)
- 53,005
- Household income
- $54,032
- Rent vs Own
- Severe rent burden
- 5148.0
Population outlook (District of Columbia County) Hauer SSP2
- Today (2025)
- 821,926 people
- By 2030
- 899,517 · +9.4%
- By 2040
- 1,061,162 · +29.1%
- By 2050
- 1,231,493 · +49.8%
- By 2075
- 1,603,312 · +95.1%
- By 2100
- 1,847,141 · +124.7%
Race, ethnicity, and origin ACS 2023
- Neighborhood character
- Predominantly Black (90%)
- Race & ethnicity
- Black 90% Two or more races 3% Hispanic / Latino 3% White 3%
- Common ancestry
- Lithuanian 1%
- Foreign-born
- 3% · Canada
- Languages at home
- 95% English-only · Spanish 2% French/Haitian/Cajun 1%
Political lean MEDSL · District of Columbia
- 2024 margin
- Solid D (+86.1) · D 91.2% · R 5.1% · Other 3.8%
- 2008→2024 swing
- +0.1pp no change · 2008: 85.9pp · 2024: 86.1pp
- All cycles
- 2024: D+86.1 2020: D+86.8 2016: D+88.7 2012: D+84.2 2008: D+85.9
Not yet ingested
- Civics
- —
Market trends
- HPI YoY
- ▼ -415.44%
- Current HPI
- 306.5068
- Rent YoY
- ▲ 3.86%
- Metro
- Washington-Arlington-Alexandria, DC-VA-MD-WV
- State GDP YoY
- ▲ 1.33%
- F500 in state
- 6
Industry mix (Fortune 500 HQ in DC)
| Industry | F500 HQs | Revenue |
|---|---|---|
| Financial Services | 1 | $153B |
|
||
| Life Sciences / Industrials | 1 | $25B |
|
||
| Industrial Machinery | 1 | $8B |
|
||
Price history
+2378.6% since first listed15 events — show timeline
- 2026-03-02 Price Changed $580,000 BRIGHT MLS
- 2026-01-26 Listed $599,000 BRIGHT MLS
- 2025-12-31 Listing Removed — BRIGHT MLS
- 2025-08-03 Price Changed $599,000 BRIGHT MLS
- 2025-06-05 Price Changed $630,000 BRIGHT MLS
- 2025-06-05 Listed $600,000 BRIGHT MLS
- 2025-06-04 Coming Soon — BRIGHT MLS
- 2003-08-21 Sold (Public Records) $95,000 Public Records
- 2003-05-31 Sold (MLS) $95,000 MRIS
- 2003-03-11 Delisted — MRIS
- 2002-11-26 Delisted — MRIS
- 2002-11-26 Listed $99,900 MRIS
- 2002-08-23 Listed — MRIS
- 1993-10-27 Sold (Public Records) $93,150 Public Records
- 1993-01-05 Sold (Public Records) $23,400 Public Records
Property tax history
+1.1%/yrLatest (2025): $3,950 · +4.5% YoY. Source: county tax records.
Cash-flow waterfall
monthlySold comps — $/sqft
last 12 mo · ≤1 miLoading sold comps…