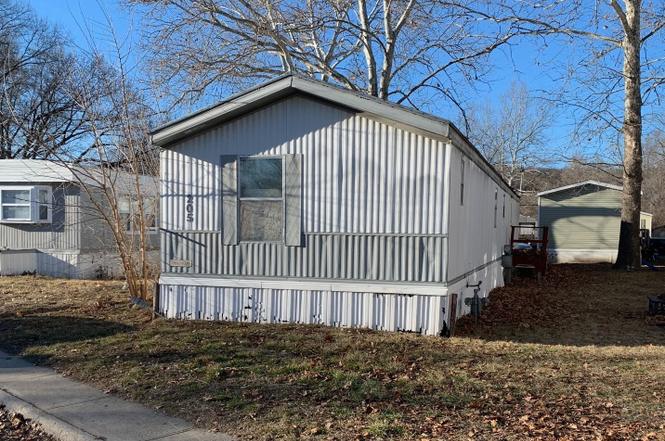
205 Delaware Not Applicable · Edwardsville, KS
Flood risk 6/10 · Moderate
- FEMA flood zone
- X (shaded)
- Chance of flooding over 30 yrs
- 0.7%
- Est. flood insurance / yr
- $473 – $860
Fire risk 1/10 · Minimal
- Est. fire insurance / yr
- $1,154 – $2,142
Heat risk 4/10 · Minor
- Hot days now (above 107°F)
- 7 days/yr
- Hot days in 30 yrs
- 17 days/yr
Wind risk 2/10 · Minimal
- Chance of severe wind over 30 yrs
- —
Air-quality risk 2/10 · Minimal
- Unhealthy air days now
- 1 days/yr
- Unhealthy air days in 30 yrs
- 2 days/yr
Risk factors via First Street. Map © Google.
Why this score? — see what drove the B grade
The composite is a weighted blend of 9 inputs, each scored 0–100. Each bar is that input's sub-score; the figure is the points it added to the 100-point composite (weight × sub-score).
- Cash flow +30.0/30.0
- 1% rule +10.0/10.0
- DSCR +10.0/10.0
- ARV discount +7.5/15.0
- Appreciation +5.0/10.0
- Livability +3.2/5.0
- Rent growth +2.5/5.0
- Condition / age +2.5/5.0
- Schools +2.3/10.0
$30,300
🖨 Deal sheet (PDF) 📄 Offer letter ✓ Due diligence
Key facts
- Basketball court
- Community events
- Built 2024
Tags
Property features AI
Finance
- Other: Address: 205 Delaware, Edwardsville, KS 66113; Listing status: Active; Last modification: 2024-05-06
- Financial info: List price $30,300
Exterior
- Home design: Single-family property; Plan name 81536
- Exterior features: Living area approximately 1,216
Interior
- Bedrooms: 3 bedrooms
- Bathrooms: 2 bathrooms
- Interior features: Spec home (new construction inventory)
Neighborhood map
What this means for you Summary
Snapshot
- This is a 3-bed/2.0-bath manufactured listed at $30k.
Deal economics
- At list price, monthly cash flow is $521 ($6k/yr) — positive.
- The deal already cash-flows at list — no discount required.
- Meets the 1% rule at list price ($924 rent vs $30k).
- Recommended offer: $27k (12.0% below list) — sets the bar for market timing.
- Cap rate 26.9% vs local median 3.8% in Edwardsville — top-decile yield for the area; either an underpriced asset or a hidden risk that comps aren't pricing in. Stress-test before assuming the spread holds.
Location & tenants
- Location reads 65/100 on livability (#289 in KS) — a middle-class / working-renter tenant base. Strengths: employment A+, cost of living A+, housing A+; Watch: amenities F, commute F, health & safety F.
- Bonner Springs (suburban): math 21% / reading 29% proficiency, ranked #131 of 169 in KS (top 78%) — low school quality limits family demand, transient renter base, plan for 1-2y turnover.
- Zoned schools: Edwardsville Elem (math 32% / reading 42%, grade F, #358 of 684 statewide, top 56%, 341 students, 62% FRL); Robert E Clark Middle (math 15% / reading 23%, grade F, #159 of 219 statewide, top 73%, 563 students, 52% FRL); Bonner Springs High (math 17% / reading 22%, grade F, #216 of 327 statewide, top 70%, 777 students, 44% FRL).
- Market conditions: 15 active listings in the ZIP; 369 units permitted in Wyandotte County in 2024 (236 in 5+ unit buildings).
Forward outlook
- In year one you build about $1k of equity ($209 loan paydown + $909 appreciation (3.0% local appreciation)).
- Wyandotte County population projected at +17% by 2050 — long-run rental-demand tailwind backs the buy-and-hold thesis.
- At projected returns (3.0% appreciation + 3.0% rent growth), your $8k cash investment doubles in ~2 years — after that, you're playing with house money.
Negotiation context
- It's been on market 785 days — a 12% lower offer ($27k) is reasonable based on typical stale-listing flexibility.
Risks & watch-outs
- Climate carrying-cost: major flood risk — expect insurance premiums to compound above CPI over the hold.
Questions for the listing agent
- It's been on market 785 days. Have you received any prior offers? Is the seller open to a 12% concession, seller financing, or rate buy-down credit?
- Why hasn't it sold? Are there any deal-killer items the seller is aware of (foundation, flood, title, zoning, code violations)?
- Is there a deadline driving the sale (1031 exchange, divorce, estate, relocation)? That informs how much negotiation room exists.
- Schools are D-rated, which usually means shorter tenancies and higher turnover. Who's the typical renter profile here, and what's been the actual vacancy rate?
- What's the average days-on-market for RENTAL listings here right now (not sales)? A rising rental-DOM trend means longer vacancies and softer asking-rent achievability than the comps imply.
- What's the recent tenant-quality profile in this submarket — average credit score on applications, eviction rate, late-payment / NSF rate, and stable-employment percentage? A property-management company in the area should have these aggregated.
- How much new for-sale + rental construction is in the pipeline within 1–3 miles? Heavy new supply typically softens prices + rents 12–24 months out; constrained supply supports both.
Investment metrics
- 1% rule
- 3.05% ✓
- Cap rate
- 26.91%
- Cash-on-cash
- 73.63%
- DSCR
- 4.28
- GRM
- 2.7
CMA / ARV
No comps found within radius.
Projected returns pro-forma
3.0% appreciation · 3.0% rent growth · sell at horizon
- IRR
- 78.2%
- Equity multiple
- 5.34×
- Total profit
- $36,820
- Equity at exit
- $13,624
- IRR
- 77.7%
- Equity multiple
- 10.98×
- Total profit
- $84,633
- Equity at exit
- $20,997
Cash invested: $8,484 (down + closing). Projections, not guarantees.
Landlord ↔ Tenant lean methodology
- Overall (STATE)
- 83 Strongly Landlord-Friendly
- State Kansas
- 83 Strongly Landlord-Friendly · R+10
- County
- — inherits STATE
- City
- — inherits STATE
ZIP-level market 66113
- Active inventory
- 15
- Price-to-rent
- 2.7×
Monthly cashflow live
- Estimated rent
- $924 medium interval (Pro) →
- Mortgage (P&I)
- −$159
- Tax est. 1.5%
- −$38 /mo · $454/yr
- Insurance
- −$13
- HOA
- −$0
- Lot rent leased land?
- −$0
- Vacancy / Maint / Mgmt
- −$194
- Net cashflow
- $521
Break-even live
Sensitivity live
| Price | -10% $542 | -5% $531 | +0% $521 | +5% $510 | +10% $500 |
|---|---|---|---|---|---|
| Rent | -10% $448 | -5% $484 | +0% $521 | +5% $557 | +10% $594 |
| Rate | -1.0pp $536 | -0.5pp $528 | base $521 | +0.5pp $513 | +1.0pp $505 |
UW: 25.0% down · 7.5% · 30yr · 1.5% tax · 5.0% vac · 8.0% maint · 8.0% mgmt
Financing live
Cash to close
- Down payment
- $7,575
- Closing costs
- $909
- Reserves months
- —
- Total cash needed
- —
Loan-product check · same deal, 3 products live
Conventional
25% down · 7.5% · 30yr
- Down + closing
- —
- Monthly P&I
- —
- Monthly cashflow
- —
- DSCR
- —
- Eligible?
- —
Personal DTI + credit; lowest rate.
DSCR
20% down · 8.5% · 30yr
- Down + closing
- —
- Monthly P&I
- —
- Monthly cashflow
- —
- DSCR
- —
- Eligible?
- —
No personal income docs; deal must DSCR.
Hard money
10% down · 12.0% · 12mo
- Down + closing
- —
- Monthly P&I
- —
- Monthly cashflow
- —
- DSCR
- —
- Eligible?
- —
Short-term bridge; refi at stabilization.
Listing history 16 events
-
2026-06-22days on market $30,300 Active 785 DOM
-
2026-06-21days on market $30,300 Active 784 DOM
-
2026-06-18days on market $30,300 Active 781 DOM
-
2026-06-17days on market $30,300 Active 780 DOM
-
2026-06-16days on market $30,300 Active 779 DOM
-
2026-06-15days on market $30,300 Active 778 DOM
-
2026-06-13days on market $30,300 Active 776 DOM
-
2026-06-13days on market $30,300 Active 775 DOM
-
2026-06-09days on market $30,300 Active 772 DOM
-
2026-06-08days on market $30,300 Active 771 DOM
-
2026-06-07days on market $30,300 Active 770 DOM
-
2026-06-05days on market $30,300 Active 767 DOM
-
2026-06-03days on market $30,300 Active 766 DOM
-
2026-06-02days on market $30,300 Active 765 DOM
-
2026-06-01days on market $30,300 Active 764 DOM
-
2026-05-31days on market $30,300 Active 763 DOM
ⓘ Source: listings_history table (triggers on properties + properties_extension) + one-shot
backfill from property_details.listing_events for pre-trigger history.
Climate risk First Street
- Flood 6/10 Major FEMA zone X (shaded) · 70% chance over 30 yrs
- Wildfire 1/10 Low
- Heat 4/10 Moderate 7 d/yr ≥107°F today · 17 d/yr by 30 yrs out
- Wind 2/10 Low
- Air quality 2/10 Low 1 unhealthy d/yr today · 2 by 30 yrs out
Nearby sold comps map
Loading sold comps map…
Walkable amenities ~0.75 mi
Loading nearby amenities…
Taxation est. · year 1
- Rental income
- $11,088
- − Mortgage interest
- −$1,697
- − Property taxes
- −$454
- − Insurance
- −$152
- − Repairs & maintenance
- −$887
- − Management
- −$887
- − Depreciation
- −$881
- Taxable income
- $6,129
- Est. tax owed @ 24.0%
- −$1,471
- After-tax cash flow
- $4,776/yr
For passive investors: Depreciation is non-cash, so a rental often shows a tax loss while cash-flowing — sheltering income. Rental losses are passive: they offset passive income freely, and up to $25,000/yr can offset ordinary (W-2) income if you actively participate and your MAGI is under $100k (phasing out to $0 by $150k); unused losses carry forward. On sale, claimed depreciation is recaptured at up to 25%, and gains may owe capital-gains tax (a 1031 exchange can defer both). Figures are a year-1 estimate at your 24.0% rate — not tax advice; consult a CPA.
Schools (NCES district)
- District
- Bonner Springs
- NCES district ID
- 2004050
- Math proficiency
- 21% ▼ -7.00%
- Reading proficiency
- 29% ▼ -5.00%
- Median HH income
- $56,480
- Composite
- 22.65/100
- National rank
- #8055
- State rank
- #131 of 169 in KS
Livability — Edwardsville
- Score
- 65/100
- State rank
- #289
- US rank
- #12913
Category grades
Schools grade is shown separately in the Schools card above.
Census & demographics
- Census place
- Edwardsville, KS
Population outlook (Wyandotte County) Hauer SSP2
- Today (2025)
- 177,063 people
- By 2030
- 183,212 · +3.5%
- By 2040
- 195,697 · +10.5%
- By 2050
- 207,897 · +17.4%
- By 2075
- 236,169 · +33.4%
- By 2100
- 255,790 · +44.5%
Not yet ingested
- Political lean
- —
- Race & ethnicity
- —
- Common origin
- —
- Civics
- —
Market trends
- HPI YoY
- —
- Current HPI
- —
- Rent YoY
- —
- Metro
- —
- State GDP YoY
- —
- F500 in state
- 0
Cash-flow waterfall
monthlySold comps — $/sqft
last 12 mo · ≤1 miLoading sold comps…