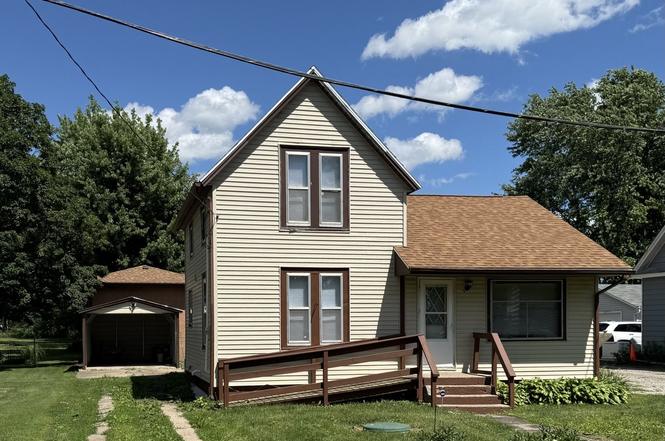
14180 Elmira Rd · Toulon, IL
Flood risk 1/10 · Minimal
- FEMA flood zone
- X
- Chance of flooding over 30 yrs
- 0.0%
- Est. flood insurance / yr
- $473 – $860
Fire risk 1/10 · Minimal
- Est. fire insurance / yr
- $804 – $1,492
Heat risk 3/10 · Minor
- Hot days now (above 103°F)
- 7 days/yr
- Hot days in 30 yrs
- 17 days/yr
Wind risk 2/10 · Minimal
- Chance of severe wind over 30 yrs
- 1.0%
Air-quality risk 2/10 · Minimal
- Unhealthy air days now
- 1 days/yr
- Unhealthy air days in 30 yrs
- 2 days/yr
Risk factors via First Street. Map © Google.
Why this score? — see what drove the C+ grade
The composite is a weighted blend of 9 inputs, each scored 0–100. Each bar is that input's sub-score; the figure is the points it added to the 100-point composite (weight × sub-score).
- Cash flow +25.0/30.0
- DSCR +8.1/10.0
- ARV discount +7.5/15.0
- Appreciation +7.5/10.0
- 1% rule +5.4/10.0
- Livability +3.2/5.0
- Rent growth +2.5/5.0
- Condition / age +2.5/5.0
- Schools +1.7/10.0
$70,000
🖨 Deal sheet 📄 Offer letter ✓ Due diligence
Listing remarks
This 3- bedroom home is located in a nice, small-town setting. The main floor offers a spacious living room with a beautiful decorative fireplace that serves as a stunning focal point & adds character & charm! There is a convenient first floor bedroom, full bath, laundry hook-ups & an eat-in kitchen that offers ample space for meals & gatherings with family & friends. Upstairs, you'll find 2 additional bedrooms. Outside, the manageable yard is easy to maintain while offering space to enjoy the outdoors! The 1-car detached American Steel garage is equipped with power, making it ideal for parking, storage or hobbies. Whether you are looking for your first home, d
Key facts
- 4,850 sq ft lot
- Garage
- Listed 3 days
Property features AI
Finance
- HOA & community: No master association fees required
Exterior
- Parking: Detached garage (1 garage space; 1 total parking space)
- Utilities: Well water; Septic tank sewer
- Home design: Detached single-family home; 1.5-story design; Built approximately 61–70 years ago; Built before 1978
- Construction: Vinyl siding; Brick/mortar foundation; Asphalt roof
- Exterior features: Patio; Level lot approximately 50 x 97
Interior
- Kitchen: Range
- Bedrooms: Master bedroom on the main level (approx. 11 x 12) with luxury vinyl flooring; Second bedroom on the second level (approx. 12 x 13) with luxury vinyl flooring; Third bedroom on the second level (approx. 7 x 8) with luxury vinyl flooring
- Flooring: Luxury vinyl flooring in main living areas and bedrooms
- Bathrooms: One full bathroom
- Heating & cooling: Propane forced-air heating; Central air conditioning
- Interior features: Five total rooms; Unfinished partial basement; One fireplace in the living room
- Laundry & utility: Laundry room
Neighborhood map
What this means for you Summary
Snapshot
- This is a 3-bed/1.0-bath other listed at $70k.
Deal economics
- At list price, monthly cash flow is $152 ($2k/yr) — positive.
- The deal already cash-flows at list — no discount required.
- Meets the 1% rule at list price ($729 rent vs $70k).
Location & tenants
- Location reads 65/100 on livability (#659 in IL) — a middle-class / working-renter tenant base. Strengths: crime A+, cost of living A+, housing A; Watch: employment D, schools F, amenities F.
- Stark County CUSD 100 (rural): math 17% / reading 21% proficiency, ranked #435 of 620 in IL (top 70%) — low school quality limits family demand, transient renter base, plan for 1-2y turnover.
- Market conditions: 7 active listings in the ZIP; 2 units permitted in Stark County in 2024 (0 in 5+ unit buildings).
Forward outlook
- In year one you build about $4k of equity ($484 loan paydown + $4k appreciation (5.0% local appreciation)).
- Stark County population projected at -36% by 2050 — secular population decline; favor cash flow + early exit over multi-decade hold.
- At projected returns (5.0% appreciation + 3.0% rent growth), your $20k cash investment doubles in ~4 years — after that, you're playing with house money.
- By year 8, paydown + projected appreciation supports a ~$30k cash-out refi (75% LTV) — recoverable capital for the next deal without selling this one.
Negotiation context
- Only 3 days on market — expect competitive offers; lowballing is unlikely to land.
- Current owner paid $12k; list at $70k implies a 483% gain — meaningful room to come down on a strong offer.
Questions for the listing agent
- Is there a deadline driving the sale (1031 exchange, divorce, estate, relocation)? That informs how much negotiation room exists.
- Schools are F-rated, which usually means shorter tenancies and higher turnover. Who's the typical renter profile here, and what's been the actual vacancy rate?
- What's the average days-on-market for RENTAL listings here right now (not sales)? A rising rental-DOM trend means longer vacancies and softer asking-rent achievability than the comps imply.
- What's the recent tenant-quality profile in this submarket — average credit score on applications, eviction rate, late-payment / NSF rate, and stable-employment percentage? A property-management company in the area should have these aggregated.
- How much new for-sale + rental construction is in the pipeline within 1–3 miles? Heavy new supply typically softens prices + rents 12–24 months out; constrained supply supports both.
Investment metrics
- 1% rule
- 1.04% ✓
- Cap rate
- 8.90%
- Cash-on-cash
- 9.31%
- DSCR
- 1.41
- GRM
- 8.0
CMA / ARV
No comps found within radius.
Projected returns pro-forma
5.02% appreciation · 3.0% rent growth · sell at horizon
- IRR
- 20.9%
- Equity multiple
- 2.32×
- Total profit
- $25,860
- Equity at exit
- $39,742
- IRR
- 20.5%
- Equity multiple
- 4.56×
- Total profit
- $69,738
- Equity at exit
- $68,650
Cash invested: $19,600 (down + closing). Projections, not guarantees.
Landlord ↔ Tenant lean methodology
- Overall (STATE)
- 43 Moderately Tenant-Leaning
- State Illinois
- 43 Moderately Tenant-Leaning · D+7
- County
- — inherits STATE
- City
- — inherits STATE
ZIP-level market 61483
- Home prices YoY
- 3.7%
- Active inventory
- 7
- Price-to-rent
- 8.0×
Monthly cashflow live
- Estimated rent
- $729 medium interval (Pro) →
- Mortgage (P&I)
- −$367
- Tax from tax record
- −$28 /mo · $336/yr
- Insurance
- −$29
- HOA
- −$0
- Vacancy / Maint / Mgmt
- −$153
- Net cashflow
- $152
Break-even live
UW: 25.0% down · 7.5% · 30yr · 1.5% tax · 5.0% vac · 8.0% maint · 8.0% mgmt
Financing live
Cash to close
- Down payment
- $17,500
- Closing costs
- $2,100
- Reserves months
- —
- Total cash needed
- —
Loan-product check · same deal, 3 products live
Conventional
25% down · 7.5% · 30yr
- Down + closing
- —
- Monthly P&I
- —
- Monthly cashflow
- —
- DSCR
- —
- Eligible?
- —
Personal DTI + credit; lowest rate.
DSCR
20% down · 8.5% · 30yr
- Down + closing
- —
- Monthly P&I
- —
- Monthly cashflow
- —
- DSCR
- —
- Eligible?
- —
No personal income docs; deal must DSCR.
Hard money
10% down · 12.0% · 12mo
- Down + closing
- —
- Monthly P&I
- —
- Monthly cashflow
- —
- DSCR
- —
- Eligible?
- —
Short-term bridge; refi at stabilization.
Listing history 4 events
-
2026-06-18days on market $70,000 Active 3 DOM
-
2026-06-17days on market $70,000 Active 2 DOM
-
2026-06-16remarks 679-char remark
-
2026-06-16$70,000 Active 1 DOM
ⓘ Source: listings_history table (triggers on properties + properties_extension) + one-shot
backfill from property_details.listing_events for pre-trigger history.
Tax reassessment forecast IL · Partial reset (capped growth)
- Current annual tax
- $336 · $28/mo
- Projected year-2 tax
- $962 · $80/mo
- Expected delta
- +$627/yr (+$52/mo · 186.7%)
ⓘ Screening estimate from a state-policy table — verify with the county assessor before closing.
Climate risk First Street
- Flood 1/10 Low FEMA zone X · 0% chance over 30 yrs
- Wildfire 1/10 Low
- Heat 3/10 Moderate 7 d/yr ≥103°F today · 17 d/yr by 30 yrs out
- Wind 2/10 Low 100% chance of damaging wind over 30 yrs
- Air quality 2/10 Low 1 unhealthy d/yr today · 2 by 30 yrs out
Nearby sold comps map
Loading sold comps map…
Walkable amenities ~0.75 mi
Loading nearby amenities…
Taxation est. · year 1
- Rental income
- $8,753
- − Mortgage interest
- −$3,921
- − Property taxes
- −$336
- − Insurance
- −$350
- − Repairs & maintenance
- −$700
- − Management
- −$700
- − Depreciation
- −$2,036
- Taxable income
- $710
- Est. tax owed @ 24.0%
- −$170
- After-tax cash flow
- $1,654/yr
For passive investors: Depreciation is non-cash, so a rental often shows a tax loss while cash-flowing — sheltering income. Rental losses are passive: they offset passive income freely, and up to $25,000/yr can offset ordinary (W-2) income if you actively participate and your MAGI is under $100k (phasing out to $0 by $150k); unused losses carry forward. On sale, claimed depreciation is recaptured at up to 25%, and gains may owe capital-gains tax (a 1031 exchange can defer both). Figures are a year-1 estimate at your 24.0% rate — not tax advice; consult a CPA.
Schools (NCES district)
- District
- Stark County CUSD 100
- NCES district ID
- 1737490
- Math proficiency
- 17% ▼ -9.00%
- Reading proficiency
- 21% ▼ -12.00%
- Median HH income
- $49,620
- Composite
- 17.04/100
- National rank
- #9124
- State rank
- #435 of 620 in IL
Livability — Toulon
- Score
- 65/100
- State rank
- #659
- US rank
- #13531
Category grades
Schools grade is shown separately in the Schools card above.
Census & demographics
- Population (ZIP)
- 1,876
Population outlook (Stark County) Hauer SSP2
- Today (2025)
- 5,233 people
- By 2030
- 4,898 · -6.4%
- By 2040
- 4,130 · -21.1%
- By 2050
- 3,369 · -35.6%
- By 2075
- 2,062 · -60.6%
- By 2100
- 1,205 · -77.0%
Race, ethnicity, and origin ACS 2023
- Neighborhood character
- Predominantly White (93%)
- Race & ethnicity
- White 93% Two or more races 4% Black 1%
- Common ancestry
- Slovak 8% Romanian 2% English 2%
- Foreign-born
- 2%
- Languages at home
- 97% English-only · Spanish 2% Arabic 1% German/W. Germanic 0%
Political lean MEDSL · Stark
- 2024 margin
- Solid R (+45.6) · D 26.3% · R 71.8% · Other 1.9%
- 2008→2024 swing
- -40.2pp toward R · 2008: -5.4pp · 2024: -45.6pp
- All cycles
- 2024: R+45.6 2020: R+41.2 2016: R+38.0 2012: R+16.2 2008: R+5.4
Not yet ingested
- Civics
- —
Market trends
- HPI YoY
- ▲ 5.02%
- Current HPI
- 141.1894
- Rent YoY
- —
- Metro
- —
- State GDP YoY
- ▲ 1.59%
- F500 in state
- 60
Industry mix (Fortune 500 HQ in IL)
| Industry | F500 HQs | Revenue |
|---|---|---|
| Insurance | 4 | $201B |
|
||
| Consumer Goods | 4 | $87B |
|
||
| Industrial Machinery | 3 | $64B |
|
||
| Healthcare | 2 | $55B |
|
||
| Retail / Pharmacy | 1 | $148B |
|
||
| Agriculture / Food | 1 | $86B |
|
||
Price history
+483.3% since first listed2 events — show timeline
- 2026-06-13 Listed $70,000 MRED as Distributed by MLS Grid
- 2025-11-01 Sold (Public Records) $12,000 Public Records
Property tax history
-5.4%/yrLatest (2025): $336 · -60.6% YoY. Source: county tax records.
Cash-flow waterfall
monthlySold comps — $/sqft
last 12 mo · ≤1 miLoading sold comps…