 Duplex
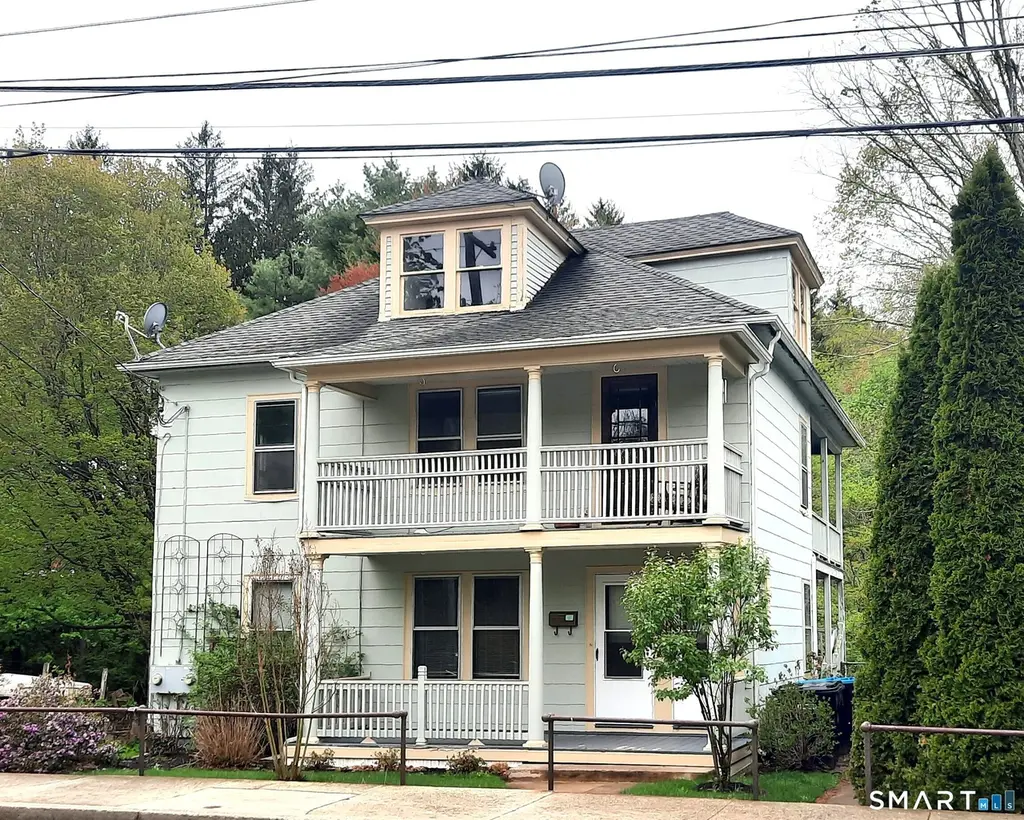
15 Milton St · Putnam, CT
Flood risk 1/10 · Minimal
- FEMA flood zone
- X (unshaded)
- Chance of flooding over 30 yrs
- 0.0%
- Est. flood insurance / yr
- $473 – $860
Fire risk 2/10 · Minimal
- Est. fire insurance / yr
- $829 – $1,539
Heat risk 4/10 · Minor
- Hot days now (above 95°F)
- 7 days/yr
- Hot days in 30 yrs
- 15 days/yr
Wind risk 6/10 · Moderate
- Chance of severe wind over 30 yrs
- 58.0%
Air-quality risk 2/10 · Minimal
- Unhealthy air days now
- 2 days/yr
- Unhealthy air days in 30 yrs
- 2 days/yr
Risk factors via First Street. Map © Google.
Why this score? — see what drove the C+ grade
The composite is a weighted blend of 9 inputs, each scored 0–100. Each bar is that input's sub-score; the figure is the points it added to the 100-point composite (weight × sub-score).
- Cash flow +22.4/30.0
- ARV discount +15.0/15.0
- DSCR +7.2/10.0
- 1% rule +5.4/10.0
- Livability +3.3/5.0
- Schools +2.6/10.0
- Rent growth +2.5/5.0
- Condition / age +2.5/5.0
- Appreciation +0.0/10.0
$250,000
🖨 Deal sheet (PDF) 📄 Offer letter ✓ Due diligence
Multi-family units
County records classify this as Multi-Family (2-4 Unit). Listing-text estimate: 2 units. confirmed
Listing remarks
Two-family home offering excellent investment or owner-occupant opportunity. The units are almost identical, up and down, with 2 bedrooms and a full bath, large double living room, and the kitchen. The 1st floor unit has laundry. 2nd floor does not, but there is a hookup in the basement. The property includes off-street parking, a 3 car detached garage that needs some work, and a private back yard with pretty trees. The basement is dry. Separate electric services. The 1st floor unit is oil fired hot water baseboard, and the 2nd floor is electric baseboard. The property is in need of some work and updating, but has neat older home features, like arched entries and paneled doors. Peeling pain
Key facts
- Off street parking
- Arched entries
- Private back yard
Tags
Property features AI
Exterior
- Parking: Detached garage; 3-car garage; Paved driveway and off-street parking; Total parking for 6 vehicles
- Security: No security features provided
- Utilities: Public water connected; Public sewer connected; Fuel tank located in basement
- Home design: Multi-family (2-family); Multi-family property for sale
- Construction: Frame construction; Shingle exterior siding; Asphalt shingle roof; Stone and wood foundation
- Exterior features: Porch; Gutters; Exterior lighting; Lightly wooded lot; Private paved driveway
Interior
- Kitchen: No kitchen appliance details provided
- Bedrooms: 4 bedrooms
- Flooring: No interior flooring details provided
- Bathrooms: 2 full bathrooms
- Heating & cooling: Baseboard and hot water heating; Heat fuel: electric and oil; Electric tankless hot water
- Interior features: 12 total rooms; Full unfinished basement with concrete and dirt floors and a walk-out; Has partially finished walk-up attic; Window unit cooling
- Laundry & utility: Basement washer/dryer hook-ups; Some units include washer/dryer; Hook-up in unit 1
Neighborhood map
What this means for you Summary
Snapshot
- This is a 2 × 2-bed/1.0-bath units multifamily listed at $250k.
Deal economics
- At list price, monthly cash flow is $415 ($5k/yr) — positive. Per door: $207/mo.
- The deal already cash-flows at list — no discount required.
- Meets the 1% rule at list price ($3k rent vs $250k).
- Cap rate 8.3% vs local median 3.4% in Putnam — top-decile yield for the area; either an underpriced asset or a hidden risk that comps aren't pricing in. Stress-test before assuming the spread holds.
Location & tenants
- Location reads 66/100 on livability (#117 in CT) — a middle-class / working-renter tenant base. Strengths: crime A+, housing A+, cost of living A; Watch: health & safety D+, schools D-, amenities F.
- Putnam School District (suburban): math 25% / reading 34% proficiency, ranked #126 of 153 in CT (top 82%) — low school quality limits family demand, transient renter base, plan for 1-2y turnover.
- Market conditions: 59 active listings in the ZIP; 2 comparable units currently listed for rent nearby; 149 units permitted in Northeastern Connecticut Planning Region in 2024 (0 in 5+ unit buildings).
Forward outlook
- Local home prices are declining (-3.0%/yr); year-one equity from $2k of loan paydown is wiped out by about $8k of value loss. Plan a longer hold.
Negotiation context
- Only 6 days on market — expect competitive offers; lowballing is unlikely to land.
- 6 sale attempts since 21y ago with the ask held roughly flat each time — persistent listings suggest the price (not the market) is what's stuck; bring a comps-based counter.
- Current owner paid $145k; list at $250k implies a 72% gain — meaningful room to come down on a strong offer.
Risks & watch-outs
- Watch-outs: built in 1900 — expect roof / HVAC / electrical / plumbing capex.
- Climate carrying-cost: major wind risk, 58% chance of damaging wind over 30y — expect insurance premiums to compound above CPI over the hold.
Questions for the listing agent
- Can we see the unit-by-unit rent roll, current vacancy, and any below-market leases? What's the average tenancy length?
- What capital expenditures (roof, boiler, parking lot, exteriors) have been made in the last 5 years, and what's planned in the next 2?
- Built in 1900 — when were the roof, HVAC, electrical panel, plumbing, and water heater last replaced?
- Is there a deadline driving the sale (1031 exchange, divorce, estate, relocation)? That informs how much negotiation room exists.
- Schools are D-rated, which usually means shorter tenancies and higher turnover. Who's the typical renter profile here, and what's been the actual vacancy rate?
- What's the average days-on-market for RENTAL listings here right now (not sales)? A rising rental-DOM trend means longer vacancies and softer asking-rent achievability than the comps imply.
- What's the recent tenant-quality profile in this submarket — average credit score on applications, eviction rate, late-payment / NSF rate, and stable-employment percentage? A property-management company in the area should have these aggregated.
- How much new apartment / multifamily construction is in the pipeline within 1–3 miles? Heavy new supply (>2% of stock underway) typically softens rents 12–24 months out; light construction supports rent growth.
Investment metrics
- 1% rule
- 1.04% ✓
- Cap rate
- 8.28%
- Cash-on-cash
- 7.11%
- DSCR
- 1.32
- GRM
- 8.0
CMA / ARV
- ARV (median comp)
- $317,341
- List price
- $250,000
- Delta
- -21.22%
- Verdict
- UNDERPRICED
- Comps
- 20 within 1.0 mi
Show comp detail 8 sales within ~0.75 mi
| Address | Dist | Beds/Ba | Sqft | Sold | Price | $/sf | Match |
|---|---|---|---|---|---|---|---|
| 19 Bolles St | 0.57mi | 4/2.0 | 1,820 (-3%) | 1mo | $297,500 | $163 | 67 |
| 68 Battey St | 0.23mi | 5/2.0 (+1) | 1,824 (-3%) | 15mo | $240,000 | $132 | 67 |
| 41-43 Mill St | 0.23mi | 4/2.0 | 2,128 (+13%) | 1mo | $250,000 | $117 | 66 |
| 203 School St | 0.63mi | 5/3.0 (+1) | 1,887 (+1%) | 1mo | $367,150 | $195 | 60 |
| 39 Battey St | 0.29mi | 4/2.0 | 1,605 (-14%) | 7mo | $300,000 | $187 | 56 |
| 48 Smith St | 0.31mi | 5/2.0 (+1) | 1,714 (-9%) | 19mo | $365,000 | $213 | 50 |
| 126 Powhattan St | 0.54mi | 4/3.0 | 2,116 (+13%) | 15mo | $253,500 | $120 | 37 |
| 46 School St | 0.71mi | 4/2.0 | 1,662 (-11%) | 20mo | $230,000 | $138 | 31 |
Match score weights: distance 35% · size 25% · config 20% · recency 20%. Top-matched comps best support the ARV.
Projected returns pro-forma
-3.0% appreciation · 3.0% rent growth · sell at horizon
- IRR
- -5.4%
- Equity multiple
- 0.80×
- Total profit
- $-14,101
- Equity at exit
- $37,276
- IRR
- 4.2%
- Equity multiple
- 1.31×
- Total profit
- $21,669
- Equity at exit
- $21,615
Cash invested: $70,000 (down + closing). Projections, not guarantees.
Landlord ↔ Tenant lean methodology
- Overall (STATE)
- 27 Tenant-Leaning
- State Connecticut
- 27 Tenant-Leaning · D+7
- County
- — inherits STATE
- City
- — inherits STATE
ZIP-level market 06260
- Home prices YoY
- -4.3%
- Active inventory
- 59
- Price-to-rent
- 16.1×
Monthly cashflow live
- Estimated rent
- $2,588 medium interval (Pro) →
- Mortgage (P&I)
- −$1,311
- Tax from tax record
- −$214 /mo · $2,572/yr
- Insurance
- −$104
- HOA
- −$0
- Vacancy / Maint / Mgmt
- −$543
- Net cashflow
- $415
Break-even live
Sensitivity live
| Price | -10% $557 | -5% $486 | +0% $415 | +5% $344 | +10% $273 |
|---|---|---|---|---|---|
| Rent | -10% $211 | -5% $313 | +0% $415 | +5% $517 | +10% $619 |
| Rate | -1.0pp $541 | -0.5pp $479 | base $415 | +0.5pp $350 | +1.0pp $284 |
2-unit breakdown (identical units grouped — click to expand)
| Units | Beds | Baths | Est. rent |
|---|---|---|---|
| 2× units | 2 | 1 | $2,588 |
| #1 | 2 | 1 | $1,294 |
| #2 | 2 | 1 | $1,294 |
| Total (2 units) | $2,588 | ||
UW: 25.0% down · 7.5% · 30yr · 1.5% tax · 5.0% vac · 8.0% maint · 8.0% mgmt
Financing live
Cash to close
- Down payment
- $62,500
- Closing costs
- $7,500
- Reserves months
- —
- Total cash needed
- —
Loan-product check · same deal, 3 products live
Conventional
25% down · 7.5% · 30yr
- Down + closing
- —
- Monthly P&I
- —
- Monthly cashflow
- —
- DSCR
- —
- Eligible?
- —
Personal DTI + credit; lowest rate.
DSCR
20% down · 8.5% · 30yr
- Down + closing
- —
- Monthly P&I
- —
- Monthly cashflow
- —
- DSCR
- —
- Eligible?
- —
No personal income docs; deal must DSCR.
Hard money
10% down · 12.0% · 12mo
- Down + closing
- —
- Monthly P&I
- —
- Monthly cashflow
- —
- DSCR
- —
- Eligible?
- —
Short-term bridge; refi at stabilization.
Rent comps 2 comps
| Address | Beds | Baths | Sqft | Rent | $/sqft | DOM | Units | Dist |
|---|---|---|---|---|---|---|---|---|
| 105 Woodstock Ave Putnam, CT | 3.0 | 1.0 | 1350 | $1,800 | $1.33 | 15d | 1 | 0.08mi |
| 5 Mill St Unit 9 Putnam, CT | 3.0 | 1.0 | 1350 | $1,550 | $1.15 | 22d | 1 | 0.21mi |
Listing history 17 events
-
2026-05-06status Under Contract 761-char remark
-
2026-04-30$250,000 Active 761-char remark
-
2008-10-24soldstatus $145,000
-
2008-09-23soldstatus $180,495
-
2008-08-29$150,000
-
2008-07-20historical
-
2008-02-06historical
-
2008-01-20$184,995
-
2007-11-03$189,995
-
2007-03-06soldstatus $200,000
-
2007-03-06soldstatus $200,000
-
2006-11-20$206,995
-
2005-03-01soldstatus $181,500
-
2005-02-28soldstatus $181,500
-
2005-01-12$179,000
-
2003-08-18soldstatus $115,000
-
1987-06-05soldstatus $67,000
ⓘ Source: listings_history table (triggers on properties + properties_extension) + one-shot
backfill from property_details.listing_events for pre-trigger history.
Tax reassessment forecast CT · Partial reset (capped growth)
- Current annual tax
- $2,572 · $214/mo
- Projected year-2 tax
- $3,961 · $330/mo
- Expected delta
- +$1,389/yr (+$116/mo · 54.0%)
ⓘ Screening estimate from a state-policy table — verify with the county assessor before closing.
Climate risk First Street
- Flood 1/10 Low FEMA zone X (unshaded) · 0% chance over 30 yrs
- Wildfire 2/10 Low
- Heat 4/10 Moderate 7 d/yr ≥95°F today · 15 d/yr by 30 yrs out
- Wind 6/10 Major 58% chance of damaging wind over 30 yrs
- Air quality 2/10 Low 2 unhealthy d/yr today · 2 by 30 yrs out
Nearby sold comps map
Loading sold comps map…
Walkable amenities ~0.75 mi
Loading nearby amenities…
Taxation est. · year 1
- Rental income
- $31,056
- − Mortgage interest
- −$14,004
- − Property taxes
- −$2,572
- − Insurance
- −$1,250
- − Repairs & maintenance
- −$2,484
- − Management
- −$2,484
- − Depreciation
- −$7,273
- Taxable income
- $988
- Est. tax owed @ 24.0%
- −$237
- After-tax cash flow
- $4,743/yr
For passive investors: Depreciation is non-cash, so a rental often shows a tax loss while cash-flowing — sheltering income. Rental losses are passive: they offset passive income freely, and up to $25,000/yr can offset ordinary (W-2) income if you actively participate and your MAGI is under $100k (phasing out to $0 by $150k); unused losses carry forward. On sale, claimed depreciation is recaptured at up to 25%, and gains may owe capital-gains tax (a 1031 exchange can defer both). Figures are a year-1 estimate at your 24.0% rate — not tax advice; consult a CPA.
Schools (NCES district)
- District
- Putnam School District
- NCES district ID
- 0903480
- Math proficiency
- 25% ▼ -12.00%
- Reading proficiency
- 34% ▼ -19.00%
- Median HH income
- $51,031
- Composite
- 25.85/100
- National rank
- #7349
- State rank
- #126 of 153 in CT
Livability — Putnam
- Score
- 66/100
- State rank
- #117
- US rank
- #11486
Category grades
Schools grade is shown separately in the Schools card above.
Census & demographics
- Census place
- Putnam, CT
- Population (ZIP)
- 9,227
Population outlook (Northeastern Connecticut County) Hauer SSP2
- By 2040
- 104,160
Race, ethnicity, and origin ACS 2023
- Neighborhood character
- Predominantly White (84%)
- Race & ethnicity
- White 84% Hispanic / Latino 7% Two or more races 6% Black 2% Asian 1%
- Hispanic origin (detail)
- Puerto Rican 4%
- Common ancestry
- Lithuanian 18% Romanian 5% Scotch-Irish 1%
- Foreign-born
- 4% · Canada, South Korea
- Languages at home
- 94% English-only · Spanish 4% Russian/Polish/Slavic 1% French/Haitian/Cajun 1%
Political lean MEDSL · Northeastern Connecticut
- 2024 margin
- R (+15.4) · D 41.5% · R 57.0% · Other 1.5%
- All cycles
- 2024: R+15.4
Not yet ingested
- Civics
- —
Market trends
- HPI YoY
- ▼ -14.95%
- Current HPI
- 332.9661
- Rent YoY
- —
- Metro
- —
- State GDP YoY
- ▲ 1.06%
- F500 in state
- 38
Industry mix (Fortune 500 HQ in CT)
| Industry | F500 HQs | Revenue |
|---|---|---|
| Industrial Machinery | 4 | $38B |
|
||
| Insurance | 3 | $71B |
|
||
| Financial Services | 2 | $25B |
|
||
| Transportation / Logistics | 2 | $18B |
|
||
| Healthcare | 1 | $247B |
|
||
| Telecommunications | 1 | $55B |
|
||
Price history
+273.1% since first listed17 events — show timeline
- 2026-05-06 Pending — Smart MLS
- 2026-04-30 Listed $250,000 Smart MLS
- 2008-10-24 Sold (MLS) $145,000 Smart MLS
- 2008-09-23 Sold (Public Records) $180,495 Public Records
- 2008-08-29 Listed $150,000 Smart MLS
- 2008-07-20 Listing Removed — Smart MLS
- 2008-02-06 Listing Removed — Smart MLS
- 2008-01-20 Listed $184,995 Smart MLS
- 2007-11-03 Listed $189,995 Smart MLS
- 2007-03-06 Sold (Public Records) $200,000 Public Records
- 2007-03-06 Sold (MLS) $200,000 Smart MLS
- 2006-11-20 Listed $206,995 Smart MLS
- 2005-03-01 Sold (Public Records) $181,500 Public Records
- 2005-02-28 Sold (MLS) $181,500 Smart MLS
- 2005-01-12 Listed $179,000 Smart MLS
- 2003-08-18 Sold (Public Records) $115,000 Public Records
- 1987-06-05 Sold (Public Records) $67,000 Public Records
Property tax history
+1.8%/yrLatest (2023): $2,572 · +3.6% YoY. Source: county tax records.
Cash-flow waterfall
monthlySold comps — $/sqft
last 12 mo · ≤1 miLoading sold comps…