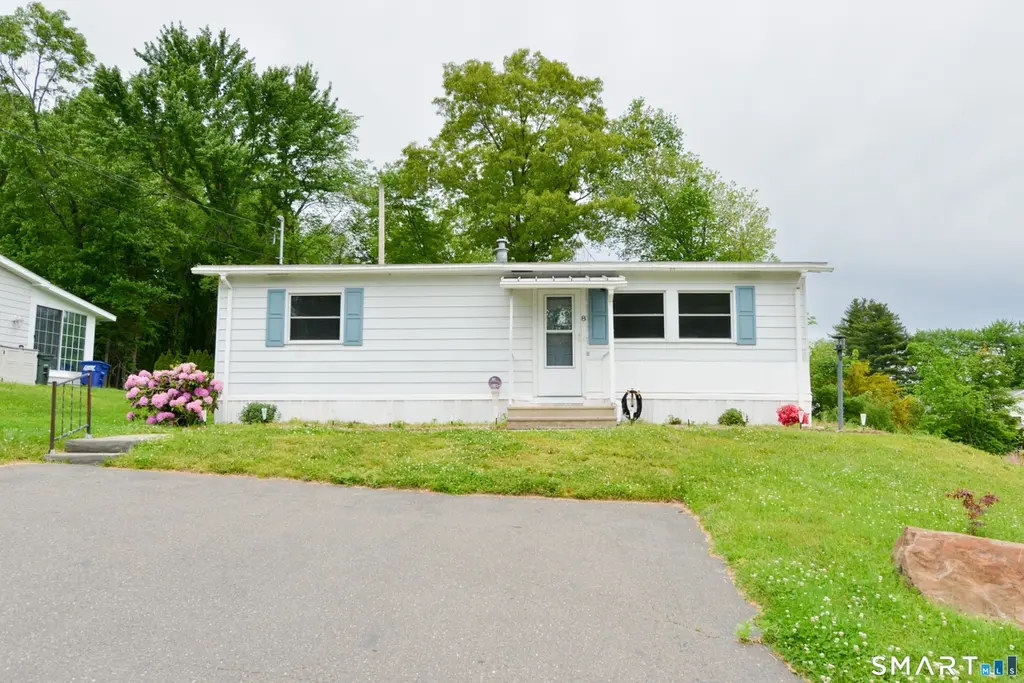
8 Maple Rock Rd · Bristol, CT
Flood risk 6/10 · Moderate
- FEMA flood zone
- X (unshaded)
- Chance of flooding over 30 yrs
- 0.72%
- Est. flood insurance / yr
- $507 – $1,088
Fire risk 1/10 · Minimal
- Est. fire insurance / yr
- $829 – $1,539
Heat risk 5/10 · Moderate
- Hot days now (above 97°F)
- 7 days/yr
- Hot days in 30 yrs
- 15 days/yr
Wind risk 6/10 · Moderate
- Chance of severe wind over 30 yrs
- 27.0%
Air-quality risk 3/10 · Minor
- Unhealthy air days now
- 2 days/yr
- Unhealthy air days in 30 yrs
- 3 days/yr
Risk factors via First Street. Map © Google.
Why this score? — see what drove the C- grade
The composite is a weighted blend of 9 inputs, each scored 0–100. Each bar is that input's sub-score; the figure is the points it added to the 100-point composite (weight × sub-score).
- Cash flow +15.7/30.0
- 1% rule +9.7/10.0
- ARV discount +7.5/15.0
- Schools +5.2/10.0
- DSCR +4.8/10.0
- Livability +4.0/5.0
- Rent growth +2.5/5.0
- Condition / age +2.5/5.0
- Appreciation +0.0/10.0
$127,900
🖨 Deal sheet 📄 Offer letter ✓ Due diligence
Listing remarks MLS
Affordable, cozy 2 bedroom ranch with central air. Jensen's 55+ community. Enjoy community pool/clubhouse. Land lease $450/mo. Incl trash, water & sewer. New thermal windows tinted to reduce sun glare, remodeled kitchen is open to the living room, extra insulation added above ceiling, remodeled bath, covered deck. Natural gas heating, updated electrical, Shed for storage, space for garden.
Key facts
- Pool
- Built 1970
- Listed 4 days
Property features AI
Finance
- HOA & community: Homeowners association with monthly fee; HOA fee covers clubhouse, water, and pool service; Community pool
Exterior
- Utilities: Public water connected; Public sewer connected
- Home design: Single family home in a 55+ adult community; Prefab construction; White exterior color
- Construction: Asphalt shingle roof; Aluminum siding; Slab foundation; Prefab construction; Built with white exterior
- Exterior features: Lightly wooded lot; Shed; Gutters; Exterior lighting; In-ground concrete swimming pool
Interior
- Kitchen: Oven/Range; Refrigerator
- Bedrooms: 2 bedrooms
- Bathrooms: 1 full bathroom
- Heating & cooling: Central air conditioning; Hot air heating (natural gas); Natural gas hot water
- Interior features: Cable available and pre-wired; Ridge vents
- Laundry & utility: Main level laundry
Neighborhood map
What this means for you Summary
Snapshot
- This is a 2-bed/1.0-bath manufactured listed at $128k.
Deal economics
- At list price, monthly cash flow is $55 ($665/yr) — positive.
- The deal already cash-flows at list — no discount required.
- Meets the 1% rule at list price ($2k rent vs $128k).
- Cap rate 6.8% vs local median 3.3% in Bristol — top-decile yield for the area; either an underpriced asset or a hidden risk that comps aren't pricing in. Stress-test before assuming the spread holds.
Location & tenants
- Location reads 81/100 on livability (#21 in CT, #1,585 nationally) — a professional / high-income tenant draw. Strengths: crime A+, housing A+, health & safety A+; Watch: commute F.
- Southington School District (suburban): math 52% / reading 64% proficiency, ranked #51 of 153 in CT (top 33%) — acceptable for families but not a draw, mixed tenant base, ~2y average lease; only 11% free/reduced lunch — higher-income household profile.
- Zoned schools: Southington High School (math 48% / reading 68%, grade C, #50 of 194 statewide, top 25%, 1,945 students, 22% FRL).
- Market conditions: 105 active listings in the ZIP; 8 comparable units currently listed for rent nearby; rentals at typical pace (median 21d on market — plan ~3-4 weeks tenant-placement turnaround); high-income renter base; 1,867 units permitted in Capitol Planning Region in 2024 (1,399 in 5+ unit buildings).
- This rent is only 18% of the median local income ($126k/yr) — well below the 30% rent-burden line; pricing power to push rent on renewal without tenant pushback.
Forward outlook
- Local home prices are declining (-3.0%/yr); year-one equity from $884 of loan paydown is wiped out by about $4k of value loss. Plan a longer hold.
Negotiation context
- Only 4 days on market — expect competitive offers; lowballing is unlikely to land.
- 5 sale attempts since 14y ago; this cycle's ask is 221% above the opening price — seller raised mid-cycle; expect resistance to lowballs.
- Current owner paid $30k; list at $128k implies a 326% gain — meaningful room to come down on a strong offer.
Risks & watch-outs
- Watch-outs: HOA is 34% of rent.
- Climate carrying-cost: major flood risk; major wind risk, 27% chance of damaging wind over 30y; extreme-heat days projected 7→15/yr by 2055 (HVAC capex compounding) — expect insurance premiums to compound above CPI over the hold.
Questions for the listing agent
- Built in 1970 — when were the roof, HVAC, electrical panel, plumbing, and water heater last replaced?
- What does the HOA fee cover, when was the last increase, and are there any pending special assessments or reserve-fund shortfalls?
- Is there a deadline driving the sale (1031 exchange, divorce, estate, relocation)? That informs how much negotiation room exists.
- What's the average days-on-market for RENTAL listings here right now (not sales)? A rising rental-DOM trend means longer vacancies and softer asking-rent achievability than the comps imply.
- What's the recent tenant-quality profile in this submarket — average credit score on applications, eviction rate, late-payment / NSF rate, and stable-employment percentage? A property-management company in the area should have these aggregated.
- How much new for-sale + rental construction is in the pipeline within 1–3 miles? Heavy new supply typically softens prices + rents 12–24 months out; constrained supply supports both.
Investment metrics
- 1% rule
- 1.47% ✓
- Cap rate
- 6.81%
- Cash-on-cash
- 1.86%
- DSCR
- 1.08
- GRM
- 5.7
CMA / ARV
No comps found within radius.
Projected returns pro-forma
-3.0% appreciation · 3.0% rent growth · sell at horizon
- IRR
- -13.0%
- Equity multiple
- 0.53×
- Total profit
- $-16,829
- Equity at exit
- $19,070
- IRR
- -3.6%
- Equity multiple
- 0.76×
- Total profit
- $-8,625
- Equity at exit
- $11,058
Cash invested: $35,812 (down + closing). Projections, not guarantees.
Landlord ↔ Tenant lean methodology
- Overall (STATE)
- 27 Tenant-Leaning
- State Connecticut
- 27 Tenant-Leaning · D+7
- County
- — inherits STATE
- City
- — inherits STATE
ZIP-level market 06489
- Active inventory
- 105
- Price-to-rent
- 5.7×
Monthly cashflow live
- Estimated rent
- $1,882 high interval (Pro) →
- Mortgage (P&I)
- −$671
- Tax from tax record
- −$60 /mo · $726/yr
- Insurance
- −$53
- HOA
- −$647
- Vacancy / Maint / Mgmt
- −$395
- Net cashflow
- $55
Break-even live
UW: 25.0% down · 7.5% · 30yr · 1.5% tax · 5.0% vac · 8.0% maint · 8.0% mgmt
Financing live
Cash to close
- Down payment
- $31,975
- Closing costs
- $3,837
- Reserves months
- —
- Total cash needed
- —
Loan-product check · same deal, 3 products live
Conventional
25% down · 7.5% · 30yr
- Down + closing
- —
- Monthly P&I
- —
- Monthly cashflow
- —
- DSCR
- —
- Eligible?
- —
Personal DTI + credit; lowest rate.
DSCR
20% down · 8.5% · 30yr
- Down + closing
- —
- Monthly P&I
- —
- Monthly cashflow
- —
- DSCR
- —
- Eligible?
- —
No personal income docs; deal must DSCR.
Hard money
10% down · 12.0% · 12mo
- Down + closing
- —
- Monthly P&I
- —
- Monthly cashflow
- —
- DSCR
- —
- Eligible?
- —
Short-term bridge; refi at stabilization.
Rent comps 8 comps
| Address | Beds | Baths | Sqft | Rent | $/sqft | DOM | Units | Dist |
|---|---|---|---|---|---|---|---|---|
| 5 Stoughton Rd Southington, CT | 2.0 | 1.0 | 720 | $1,850 | $2.57 | 43d | 1 | 0.99mi |
| 295 Redstone Hill Rd #24 Bristol, CT | 1.0 | 1.0 | 819 | $1,695 | $2.07 | 43d | 1 | 1.24mi |
| 270 East St Unit R Plainville, CT | 2.0 | 1.0 | 792 | $2,200 | $2.78 | 19d | 1 | 1.26mi |
| 279 Redstone Hill Rd #44 Bristol, CT | 1.0 | 1.0 | 799 | $1,440 | $1.80 | 43d | 1 | 1.27mi |
| 513 Emmett St Bristol, CT | 3.0 | 1.0 | 936 | $2,000 | $2.14 | 1d | 1 | 1.41mi |
| 513 Emmett St Unit B11 Bristol, CT | 3.0 | 1.0 | 936 | $2,000 | $2.14 | 19d | 1 | 1.41mi |
| 515 Emmett St Unit B11 Bristol, CT | 2.0 | 1.0 | 936 | $1,650 | $1.76 | 21d | 1 | 1.41mi |
| 422 Emmett St Unit J Bristol, CT | 2.0 | 1.0 | 710 | $1,850 | $2.61 | 2d | 1 | 1.47mi |
HOA detail
- Monthly dues
- $647 · $7,764/yr
- Likely covers
- watersewertrashgaselectricpool
Listing history 7 events
-
2026-06-07statusdays on market $127,900 Under Contract 4 DOM
-
2026-06-05days on market $127,900 Active 3 DOM
-
2026-06-03days on market $127,900 Active 2 DOM
-
2026-06-02statusdays on market $127,900 Active 1 DOM
-
2026-06-01days on market $127,900 Coming Soon 2 DOM
-
2026-05-31remarks 640-char remark
-
2026-05-31$127,900 Coming Soon 1 DOM
ⓘ Source: listings_history table (triggers on properties + properties_extension) + one-shot
backfill from property_details.listing_events for pre-trigger history.
Tax reassessment forecast CT · Partial reset (capped growth)
- Current annual tax
- $726 · $60/mo
- Projected year-2 tax
- $1,732 · $144/mo
- Expected delta
- +$1,006/yr (+$84/mo · 138.5%)
ⓘ Screening estimate from a state-policy table — verify with the county assessor before closing.
Climate risk First Street
- Flood 6/10 Major FEMA zone X (unshaded) · 72% chance over 30 yrs
- Wildfire 1/10 Low
- Heat 5/10 Major 7 d/yr ≥97°F today · 15 d/yr by 30 yrs out
- Wind 6/10 Major 27% chance of damaging wind over 30 yrs
- Air quality 3/10 Moderate 2 unhealthy d/yr today · 3 by 30 yrs out
Nearby sold comps map
Loading sold comps map…
Walkable amenities ~0.75 mi
Loading nearby amenities…
Taxation est. · year 1
- Rental income
- $22,587
- − Mortgage interest
- −$7,164
- − Property taxes
- −$726
- − Insurance
- −$640
- − Repairs & maintenance
- −$1,807
- − Management
- −$1,807
- − HOA
- −$7,764
- − Depreciation
- −$3,721
- Taxable loss
- −$1,042
- Est. tax savings @ 24.0%
- +$250
- After-tax cash flow
- $915/yr
For passive investors: Depreciation is non-cash, so a rental often shows a tax loss while cash-flowing — sheltering income. Rental losses are passive: they offset passive income freely, and up to $25,000/yr can offset ordinary (W-2) income if you actively participate and your MAGI is under $100k (phasing out to $0 by $150k); unused losses carry forward. On sale, claimed depreciation is recaptured at up to 25%, and gains may owe capital-gains tax (a 1031 exchange can defer both). Figures are a year-1 estimate at your 24.0% rate — not tax advice; consult a CPA.
Schools (NCES district)
- District
- Southington School District
- NCES district ID
- 0904230
- Math proficiency
- 52% ▼ -9.00%
- Reading proficiency
- 64% ▼ -5.00%
- Median HH income
- $81,467
- Composite
- 52.38/100
- National rank
- #1581
- State rank
- #51 of 153 in CT
Livability — Bristol
- Score
- 81/100
- State rank
- #21
- US rank
- #1585
Category grades
Schools grade is shown separately in the Schools card above.
Census & demographics
- County
- Hartford County · 754,208 people
- City population
- 61,684
- Metro
- Hartford-East Hartford-Middletown, CT
- Population (ZIP)
- 32,706
- Household income
- $126,465
- Rent vs Own
- Severe rent burden
- 513.0
Population outlook (Capitol County) Hauer SSP2
- By 2040
- 1,063,519
Race, ethnicity, and origin ACS 2023
- Neighborhood character
- Predominantly White (87%)
- Race & ethnicity
- White 87% Two or more races 6% Hispanic / Latino 5% Asian 2% Black 1%
- Hispanic origin (detail)
- Puerto Rican 3%
- Common ancestry
- Romanian 13% Lithuanian 7% Russian 2%
- Foreign-born
- 9% · Canada, China, Jamaica
- Languages at home
- 88% English-only · Other Indo-European 4% Spanish 3% Russian/Polish/Slavic 2%
Political lean MEDSL · Capitol
- 2024 margin
- Strong D (+21.9) · D 60.1% · R 38.2% · Other 1.7%
- All cycles
- 2024: D+21.9
Not yet ingested
- Civics
- —
Market trends
- HPI YoY
- ▼ -161.57%
- Current HPI
- 179.8884
- Rent YoY
- —
- Metro
- Hartford-East Hartford-Middletown, CT
- State GDP YoY
- ▲ 1.06%
- F500 in state
- 38
Industry mix (Fortune 500 HQ in CT)
| Industry | F500 HQs | Revenue |
|---|---|---|
| Industrial Machinery | 4 | $38B |
|
||
| Insurance | 3 | $71B |
|
||
| Financial Services | 2 | $25B |
|
||
| Transportation / Logistics | 2 | $18B |
|
||
| Healthcare | 1 | $247B |
|
||
| Telecommunications | 1 | $55B |
|
||
Price history
+136.9% since first listed12 events — show timeline
- 2026-05-31 Coming Soon $127,900 Smart MLS
- 2017-06-30 Sold (MLS) $30,000 Smart MLS
- 2017-02-14 Listed $39,800 Smart MLS
- 2017-02-12 Listing Removed — Smart MLS
- 2016-05-10 Listed $39,800 Smart MLS
- 2014-12-31 Listing Removed — Smart MLS
- 2014-05-30 Listed $63,000 Smart MLS
- 2013-11-30 Listing Removed — Smart MLS
- 2013-05-31 Listed $65,000 Smart MLS
- 2012-12-01 Listing Removed — Smart MLS
- 2012-06-01 Listed $67,500 Smart MLS
- 2007-09-07 Sold (Public Records) $54,000 Public Records
Property tax history
+3.1%/yrLatest (2025): $726 · +5.7% YoY. Source: county tax records.
Cash-flow waterfall
monthlySold comps — $/sqft
last 12 mo · ≤1 miLoading sold comps…