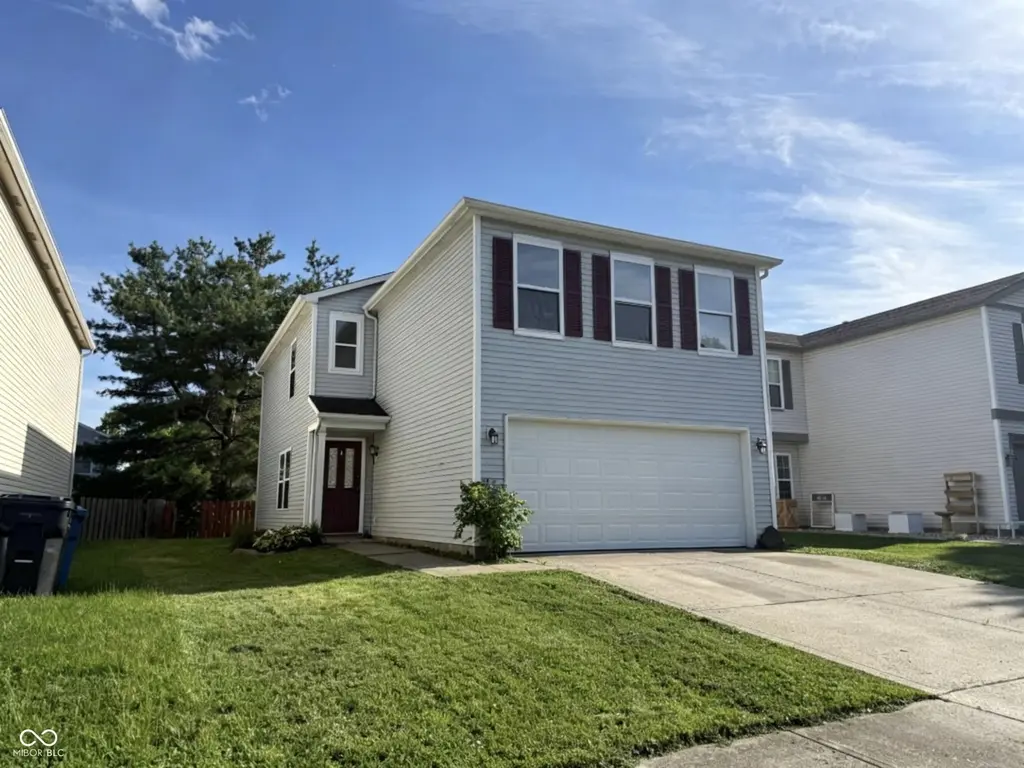
10965 Sweetsen Rd · Indianapolis city (balance), IN
Flood risk 1/10 · Minimal
- FEMA flood zone
- X (unshaded)
- Chance of flooding over 30 yrs
- 0.0%
- Est. flood insurance / yr
- $507 – $1,088
Fire risk 1/10 · Minimal
- Est. fire insurance / yr
- $717 – $1,331
Heat risk 4/10 · Minor
- Hot days now (above 102°F)
- 7 days/yr
- Hot days in 30 yrs
- 19 days/yr
Wind risk 2/10 · Minimal
- Chance of severe wind over 30 yrs
- 1.0%
Air-quality risk 2/10 · Minimal
- Unhealthy air days now
- 1 days/yr
- Unhealthy air days in 30 yrs
- 1 days/yr
Risk factors via First Street. Map © Google.
Why this score? — see what drove the C grade
The composite is a weighted blend of 9 inputs, each scored 0–100. Each bar is that input's sub-score; the figure is the points it added to the 100-point composite (weight × sub-score).
- Cash flow +18.6/30.0
- ARV discount +14.8/15.0
- DSCR +5.9/10.0
- Schools +5.5/10.0
- 1% rule +4.4/10.0
- Rent growth +3.2/5.0
- Livability +2.5/5.0
- Condition / age +2.5/5.0
- Appreciation +0.0/10.0
$210,000
🖨 Deal sheet (PDF) 📄 Offer letter ✓ Due diligence
Listing remarks MLS
Spacious 4 Bed, 2.5 Bath Single Family Home! Flowing Open Floor Plan With Completely Remodeled Interior, And Large Bedrooms. Many Updates Include All New Kitchen Appliances in 2016, New A/C in 2014. Bathrooms Have All Been Remodeled. Fence Is 3 Years Old.
Key facts
- Built-in garage
- Private yard
- 4,356 sq ft lot
Tags
Property features AI
Finance
- HOA & community: Homeowners association (quarterly fee of $187); HOA includes management; HOA disclosures: Covenants & Restrictions
Exterior
- Parking: Attached 2-car garage (approximately 380 sq ft)
- Utilities: Public water; Municipal sewer connected; Cable connected; Natural gas connected
- Home design: Single family residence; Two levels; Ownership: Other/See Remarks
- Construction: Vinyl siding; Slab foundation
- Exterior features: Deck; Full yard fence; Sidewalks; Storm sewer; Street lights; Suburban setting
Interior
- Kitchen: Electric oven; Microwave; Microhood; Dishwasher; Disposal; Refrigerator; Pantry; Eat-in kitchen
- Bedrooms: 4 bedrooms on the upper level
- Bathrooms: 2 full bathrooms; 1 half bathroom; Primary suite bathroom
- Heating & cooling: Natural gas heating; Central air conditioning
- Interior features: Attic access; Walk-in closet(s); Painted woodwork; Eat-in kitchen; Pantry; Utility room
- Laundry & utility: Main level laundry room; Washer; Dryer; Gas water heater; Owned water softener
Neighborhood map
What this means for you Summary
Snapshot
- This is a 3-bed/2.5-bath single-family listed at $210k.
Deal economics
- At list price, monthly cash flow is $204 ($2k/yr) — positive.
- The deal already cash-flows at list — no discount required.
- To meet the 1% rule (rent ≥ 1% of price), the offer needs to be $198k (5.9% below list).
- Recommended offer: $198k (5.9% below list) — sets the bar for 1% rule.
- Cap rate 7.5% vs local median 4.4% in Indianapolis city (balance) — top-decile yield for the area; either an underpriced asset or a hidden risk that comps aren't pricing in. Stress-test before assuming the spread holds.
Location & tenants
- Location reads: area grade C — affects rentability + tenant quality, not the cash-flow math above.
- Plainfield Community School Corporation (suburban): math 62% / reading 65% proficiency, ranked #11 of 301 in IN (top 4%) — acceptable for families but not a draw, mixed tenant base, ~2y average lease.
- Market conditions: Rents rising (+2.9%/yr); 63 active listings in the ZIP; 14 comparable units currently listed for rent nearby; rentals leasing fast (median 13d on market — plan ~1-2 weeks tenant-placement turnaround); solid renter incomes; 1,294 units permitted in Hendricks County in 2024 (18 in 5+ unit buildings).
Forward outlook
- Local home prices are declining (-3.0%/yr); year-one equity from $1k of loan paydown is wiped out by about $6k of value loss. Plan a longer hold.
- Hendricks County population projected at +35% by 2050 — long-run rental-demand tailwind backs the buy-and-hold thesis.
Negotiation context
- It's been on market 28 days — a 2% lower offer ($207k) is reasonable based on typical stale-listing flexibility.
- 11 sale attempts since 19y ago with the ask held roughly flat each time — persistent listings suggest the price (not the market) is what's stuck; bring a comps-based counter.
- Current owner paid $152k; 38% above their basis — modest negotiation headroom, anchor on the comps not their cost.
Questions for the listing agent
- What does the HOA fee cover, when was the last increase, and are there any pending special assessments or reserve-fund shortfalls?
- Is there a deadline driving the sale (1031 exchange, divorce, estate, relocation)? That informs how much negotiation room exists.
- What's the average days-on-market for RENTAL listings here right now (not sales)? A rising rental-DOM trend means longer vacancies and softer asking-rent achievability than the comps imply.
- What's the recent tenant-quality profile in this submarket — average credit score on applications, eviction rate, late-payment / NSF rate, and stable-employment percentage? A property-management company in the area should have these aggregated.
- How much new for-sale + rental construction is in the pipeline within 1–3 miles? Heavy new supply typically softens prices + rents 12–24 months out; constrained supply supports both.
Investment metrics
- 1% rule
- 0.94% ✗
- Cap rate
- 7.46%
- Cash-on-cash
- 4.17%
- DSCR
- 1.19
- GRM
- 8.9
CMA / ARV
- ARV (median comp)
- $250,776
- List price
- $210,000
- Delta
- -16.26%
- Verdict
- UNDERPRICED
- Comps
- 20 within 1.0 mi
Show comp detail 10 sales within ~0.75 mi
| Address | Dist | Beds/Ba | Sqft | Sold | Price | $/sf | Match |
|---|---|---|---|---|---|---|---|
| 10863 Walnut Grv | 0.11mi | 2/1.5 (-1) | 1,728 (+0%) | 10mo | $205,000 | $119 | 77 |
| 10853 Sweetsen Rd | 0.11mi | 3/2.5 | 1,759 (+2%) | 19mo | $220,000 | $125 | 76 |
| 10797 Glenayr Dr | 0.17mi | 3/2.5 | 1,728 (+0%) | 23mo | $260,000 | $150 | 72 |
| 8821 Taggart Dr | 0.17mi | 4/2.0 (+1) | 1,733 (+0%) | 22mo | $259,900 | $150 | 66 |
| 10829 Glenayr Dr | 0.14mi | 3/2.5 | 1,536 (-11%) | 21mo | $230,500 | $150 | 58 |
| 10938 Delphi Dr | 0.26mi | 3/2.5 | 1,967 (+14%) | 12mo | $236,000 | $120 | 54 |
| 5483 E Allison Rd | 0.59mi | 3/2.0 | 1,704 (-1%) | 22mo | $365,000 | $214 | 50 |
| 8838 Taggart Dr | 0.18mi | 3/2.5 | 1,971 (+14%) | 23mo | $250,000 | $127 | 49 |
| 6171 E Newberry Ct | 0.74mi | 3/2.0 | 1,770 (+3%) | 15mo | $262,000 | $148 | 47 |
| 6130 E Solitude Ct | 0.71mi | 3/2.0 | 1,844 (+7%) | 22mo | $270,000 | $146 | 35 |
Match score weights: distance 35% · size 25% · config 20% · recency 20%. Top-matched comps best support the ARV.
Projected returns pro-forma
-3.0% appreciation · 2.88% rent growth · sell at horizon
- IRR
- -9.9%
- Equity multiple
- 0.64×
- Total profit
- $-21,277
- Equity at exit
- $31,312
- IRR
- -0.7%
- Equity multiple
- 0.95×
- Total profit
- $-2,855
- Equity at exit
- $18,157
Cash invested: $58,800 (down + closing). Projections, not guarantees.
Landlord ↔ Tenant lean methodology
- Overall (STATE)
- 90 Strongly Landlord-Friendly
- State Indiana
- 90 Strongly Landlord-Friendly · R+11
- County
- — inherits STATE
- City
- — inherits STATE
ZIP-level market 46113
- Home prices YoY
- -13.0%
- Rents YoY
- 2.9%
- Active inventory
- 63
- Price-to-rent
- 8.9×
Monthly cashflow live
- Estimated rent
- $1,976 high interval (Pro) →
- Mortgage (P&I)
- −$1,101
- Tax from tax record
- −$106 /mo · $1,271/yr
- Insurance
- −$88
- HOA
- −$62
- Vacancy / Maint / Mgmt
- −$415
- Net cashflow
- $204
Break-even live
Sensitivity live
| Price | -10% $323 | -5% $264 | +0% $204 | +5% $145 | +10% $86 |
|---|---|---|---|---|---|
| Rent | -10% $48 | -5% $126 | +0% $204 | +5% $282 | +10% $361 |
| Rate | -1.0pp $310 | -0.5pp $258 | base $204 | +0.5pp $150 | +1.0pp $95 |
UW: 25.0% down · 7.5% · 30yr · 1.5% tax · 5.0% vac · 8.0% maint · 8.0% mgmt
Financing live
Cash to close
- Down payment
- $52,500
- Closing costs
- $6,300
- Reserves months
- —
- Total cash needed
- —
Loan-product check · same deal, 3 products live
Conventional
25% down · 7.5% · 30yr
- Down + closing
- —
- Monthly P&I
- —
- Monthly cashflow
- —
- DSCR
- —
- Eligible?
- —
Personal DTI + credit; lowest rate.
DSCR
20% down · 8.5% · 30yr
- Down + closing
- —
- Monthly P&I
- —
- Monthly cashflow
- —
- DSCR
- —
- Eligible?
- —
No personal income docs; deal must DSCR.
Hard money
10% down · 12.0% · 12mo
- Down + closing
- —
- Monthly P&I
- —
- Monthly cashflow
- —
- DSCR
- —
- Eligible?
- —
Short-term bridge; refi at stabilization.
Rent comps 14 comps
| Address | Beds | Baths | Sqft | Rent | $/sqft | DOM | Units | Dist |
|---|---|---|---|---|---|---|---|---|
| 10893 Glenayr Dr Camby, IN | 3.0 | 2.0 | 1171 | $1,659 | $1.42 | 11d | 1 | 0.08mi |
| 10817 Sweetsen Rd Camby, IN | 3.0 | 2.5 | 1739 | $1,880 | $1.08 | 2d | 1 | 0.15mi |
| 10940 Daylight Dr Camby, IN | 3.0 | 2.5 | 2124 | $2,025 | $0.95 | 2d | 1 | 0.16mi |
| 10801 Sweetsen Rd Camby, IN | 4.0 | 2.5 | 1752 | $1,925 | $1.10 | 8d | 1 | 0.16mi |
| 10762 Glenayr Dr Camby, IN | 3.0 | 2.5 | 1816 | $1,810 | $1.00 | 44d | 1 | 0.21mi |
| 8396 Gunnoah Way E Camby, IN | 1.0–2.0 | 1.0–2.0 | 929 | $1,800 | $1.94 | 2d | 18 | 0.35mi |
| 8607 Bluff Point Dr Camby, IN | 3.0 | 2.0 | 1224 | $1,650 | $1.35 | 21d | 1 | 0.36mi |
| 9205 Middlebury Way Camby, IN | 3.0 | 2.5 | 1792 | $1,760 | $0.98 | 8d | 1 | 0.53mi |
| 9210 Centenary Ln Camby, IN | 3.0 | 2.5 | 2030 | $1,910 | $0.94 | 24d | 1 | 0.70mi |
| 8735 Limberlost Ct Camby, IN | 3.0 | 2.5 | 1987 | $1,895 | $0.95 | 18d | 1 | 0.72mi |
| 13147 N Becks Grove Ct Camby, IN | 3.0 | 2.0 | 1440 | $1,885 | $1.31 | 5d | 1 | 1.25mi |
| 13134 N Etna Green Dr Camby, IN | 3.0 | 2.5 | 1613 | $1,855 | $1.15 | 17d | 1 | 1.26mi |
| 8624 Hosta Way Camby, IN | 3.0 | 2.5 | 1846 | $1,761 | $0.95 | 13d | 1 | 1.29mi |
| 13320 N White Cloud Ct Camby, IN | 3.0 | 2.0 | 1911 | $2,000 | $1.05 | 17d | 1 | 1.29mi |
HOA detail
- Monthly dues
- $62 · $744/yr
Listing history 27 events
-
2026-06-15status $210,000 Pending 28 DOM
-
2026-06-13days on market $210,000 Active 28 DOM
-
2026-06-13days on market $210,000 Active 27 DOM
-
2026-06-09days on market $210,000 Active 26 DOM
-
2026-06-08days on market $210,000 Active 25 DOM
-
2026-06-07days on market $210,000 Active 24 DOM
-
2026-06-02days on market $210,000 Active 22 DOM
-
2026-06-01days on market $210,000 Active 21 DOM
-
2026-05-31days on market $210,000 Active 20 DOM
-
2026-05-09$210,000 Active 741-char remark
-
2024-07-19historical $1,750
-
2024-07-17$1,750
-
2024-03-20$250,000 Active
-
2020-04-10soldstatus $152,000 Sold
Show marketing remark (255 chars)
Spacious 4 Bed, 2.5 Bath Single Family Home! Flowing Open Floor Plan With Completely Remodeled Interior, And Large Bedrooms. Many Updates Include All New Kitchen Appliances in 2016, New A/C in 2014. Bathrooms Have All Been Remodeled. Fence Is 3 Years Old.
-
2020-03-11status Pending
Show marketing remark (255 chars)
Spacious 4 Bed, 2.5 Bath Single Family Home! Flowing Open Floor Plan With Completely Remodeled Interior, And Large Bedrooms. Many Updates Include All New Kitchen Appliances in 2016, New A/C in 2014. Bathrooms Have All Been Remodeled. Fence Is 3 Years Old.
-
2020-03-03status Active
Show marketing remark (255 chars)
Spacious 4 Bed, 2.5 Bath Single Family Home! Flowing Open Floor Plan With Completely Remodeled Interior, And Large Bedrooms. Many Updates Include All New Kitchen Appliances in 2016, New A/C in 2014. Bathrooms Have All Been Remodeled. Fence Is 3 Years Old.
-
2020-03-02status Pending
Show marketing remark (255 chars)
Spacious 4 Bed, 2.5 Bath Single Family Home! Flowing Open Floor Plan With Completely Remodeled Interior, And Large Bedrooms. Many Updates Include All New Kitchen Appliances in 2016, New A/C in 2014. Bathrooms Have All Been Remodeled. Fence Is 3 Years Old.
-
2020-02-27$155,000 Active
Show marketing remark (255 chars)
Spacious 4 Bed, 2.5 Bath Single Family Home! Flowing Open Floor Plan With Completely Remodeled Interior, And Large Bedrooms. Many Updates Include All New Kitchen Appliances in 2016, New A/C in 2014. Bathrooms Have All Been Remodeled. Fence Is 3 Years Old.
-
2014-08-29historical
-
2014-08-26soldstatus $86,300
-
2014-07-22$84,333
-
2008-04-07historical
-
2008-02-28$102,900
-
2008-02-27historical
-
2007-12-11soldstatus $70,000
-
2007-09-22$75,000
-
2007-08-10$75,000
ⓘ Source: listings_history table (triggers on properties + properties_extension) + one-shot
backfill from property_details.listing_events for pre-trigger history.
Tax reassessment forecast IN · Partial reset (capped growth)
- Current annual tax
- $1,271 · $106/mo
- Projected year-2 tax
- $1,528 · $127/mo
- Expected delta
- +$257/yr (+$21/mo · 20.2%)
ⓘ Screening estimate from a state-policy table — verify with the county assessor before closing.
Climate risk First Street
- Flood 1/10 Low FEMA zone X (unshaded) · 0% chance over 30 yrs
- Wildfire 1/10 Low
- Heat 4/10 Moderate 7 d/yr ≥102°F today · 19 d/yr by 30 yrs out
- Wind 2/10 Low 100% chance of damaging wind over 30 yrs
- Air quality 2/10 Low 1 unhealthy d/yr today · 1 by 30 yrs out
Nearby sold comps map
Loading sold comps map…
Walkable amenities ~0.75 mi
Loading nearby amenities…
Taxation est. · year 1
- Rental income
- $23,713
- − Mortgage interest
- −$11,763
- − Property taxes
- −$1,271
- − Insurance
- −$1,050
- − Repairs & maintenance
- −$1,897
- − Management
- −$1,897
- − HOA
- −$744
- − Depreciation
- −$6,109
- Taxable loss
- −$1,019
- Est. tax savings @ 24.0%
- +$244
- After-tax cash flow
- $2,697/yr
For passive investors: Depreciation is non-cash, so a rental often shows a tax loss while cash-flowing — sheltering income. Rental losses are passive: they offset passive income freely, and up to $25,000/yr can offset ordinary (W-2) income if you actively participate and your MAGI is under $100k (phasing out to $0 by $150k); unused losses carry forward. On sale, claimed depreciation is recaptured at up to 25%, and gains may owe capital-gains tax (a 1031 exchange can defer both). Figures are a year-1 estimate at your 24.0% rate — not tax advice; consult a CPA.
Schools (NCES district)
- District
- Plainfield Community School Corporation
- NCES district ID
- 1808970
- Math proficiency
- 62% ▼ -8.00%
- Reading proficiency
- 65% ▼ -8.00%
- Median HH income
- $58,531
- Composite
- 54.79/100
- National rank
- #1315
- State rank
- #11 of 301 in IN
Livability — Indianapolis city (balance)
No livability data for this city. (Only ~50 U.S. cities are tracked.)
Census & demographics
- County
- Marion County · 998,460 people
- City population
- 881,119
- Metro
- Indianapolis-Carmel-Anderson, IN
- Population (ZIP)
- 17,192
- Household income
- $84,463
- Rent vs Own
- Severe rent burden
- 201.0
Population outlook (Hendricks County) Hauer SSP2
- Today (2025)
- 187,418 people
- By 2030
- 201,494 · +7.5%
- By 2040
- 228,487 · +21.9%
- By 2050
- 253,068 · +35.0%
- By 2075
- 308,920 · +64.8%
- By 2100
- 336,510 · +79.6%
Race, ethnicity, and origin ACS 2023
- Neighborhood character
- Predominantly White (73%)
- Race & ethnicity
- White 73% Black 16% Two or more races 7% Hispanic / Latino 6%
- Hispanic origin (detail)
- Mexican 3% Puerto Rican 2%
- Common ancestry
- Hispanic 5% Lithuanian 3% Slovak 2%
- Foreign-born
- 10% · Canada
- Languages at home
- 88% English-only · Spanish 5% French/Haitian/Cajun 5%
Political lean MEDSL · Hendricks
- 2024 margin
- Strong R (+21.5) · D 38.4% · R 59.9% · Other 1.7%
- 2008→2024 swing
- +1.9pp toward D · 2008: -23.4pp · 2024: -21.5pp
- All cycles
- 2024: R+21.5 2020: R+23.9 2016: R+34.2 2012: R+34.9 2008: R+23.4
Not yet ingested
- Civics
- —
Market trends
- HPI YoY
- ▼ -33.73%
- Current HPI
- 225.185
- Rent YoY
- ▲ 2.88%
- Metro
- Indianapolis-Carmel-Anderson, IN
- State GDP YoY
- ▲ 2.90%
- F500 in state
- 18
Industry mix (Fortune 500 HQ in IN)
| Industry | F500 HQs | Revenue |
|---|---|---|
| Industrial Machinery | 2 | $37B |
|
||
| Healthcare | 1 | $177B |
|
||
| Pharmaceuticals | 1 | $45B |
|
||
| Metals / Steel | 1 | $18B |
|
||
| Agriculture | 1 | $17B |
|
||
| Packaging | 1 | $12B |
|
||
Price history
+180.0% since first listed21 events — show timeline
- 2026-06-14 Pending — MIBOR as Distributed by MLS Grid
- 2026-06-12 Relisted — MIBOR as Distributed by MLS Grid
- 2026-06-07 Relisted — MIBOR as Distributed by MLS Grid
- 2026-05-09 Listed $210,000 MIBOR as Distributed by MLS Grid
- 2024-07-19 Rental Removed $1,750 MIBOR
- 2024-07-17 Listed for Rent $1,750 MIBOR
- 2024-03-20 Listed $250,000 MIBOR as Distributed by MLS Grid
- 2020-04-10 Sold (MLS) $152,000 MIBOR as Distributed by MLS Grid
- 2020-03-11 Pending — MIBOR as Distributed by MLS Grid
- 2020-03-03 Relisted — MIBOR as Distributed by MLS Grid
- 2020-03-02 Pending — MIBOR as Distributed by MLS Grid
- 2020-02-27 Listed $155,000 MIBOR as Distributed by MLS Grid
- 2014-08-29 Listing Removed — MIBOR as Distributed by MLS Grid
- 2014-08-26 Sold (MLS) $86,300 MIBOR as Distributed by MLS Grid
- 2014-07-22 Listed $84,333 MIBOR as Distributed by MLS Grid
- 2008-04-07 Listing Removed — MIBOR as Distributed by MLS Grid
- 2008-02-28 Listed $102,900 MIBOR as Distributed by MLS Grid
- 2008-02-27 Listing Removed — MIBOR as Distributed by MLS Grid
- 2007-12-11 Sold (MLS) $70,000 MIBOR as Distributed by MLS Grid
- 2007-09-22 Listed $75,000 MIBOR as Distributed by MLS Grid
- 2007-08-10 Listed $75,000 MIBOR as Distributed by MLS Grid
Property tax history
-3.2%/yrLatest (2025): $1,271 · +18.7% YoY. Source: county tax records.
Cash-flow waterfall
monthlySold comps — $/sqft
last 12 mo · ≤1 miLoading sold comps…