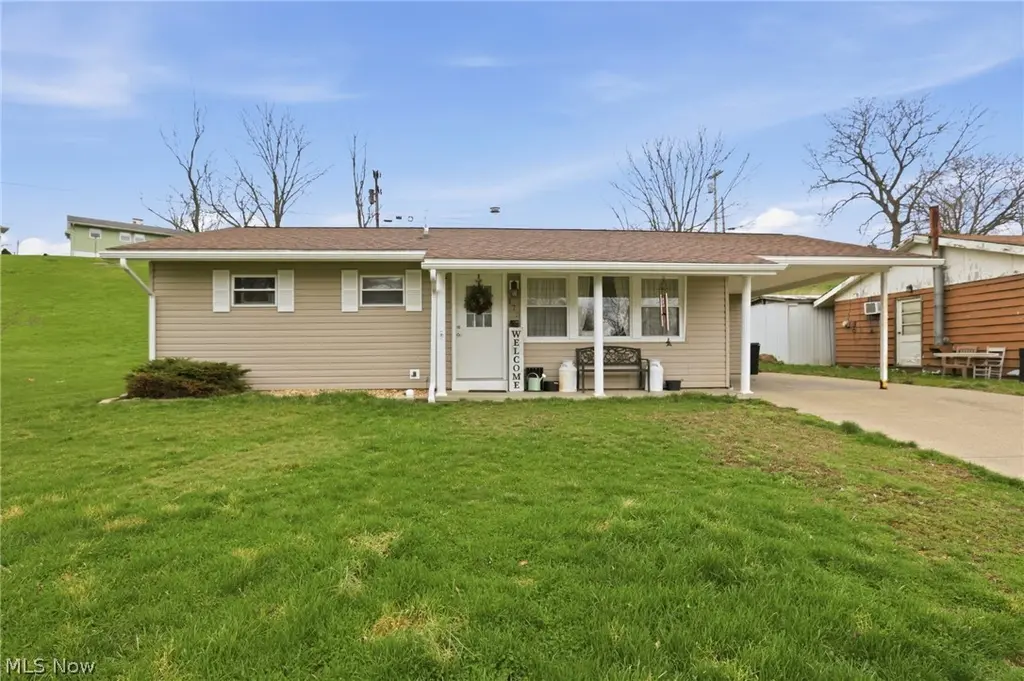
175 Andover Rd · Woodsfield, OH
Flood risk 1/10 · Minimal
- FEMA flood zone
- X (unshaded)
- Chance of flooding over 30 yrs
- 0.0%
- Est. flood insurance / yr
- $473 – $860
Fire risk 3/10 · Minor
- Est. fire insurance / yr
- $713 – $1,323
Heat risk 3/10 · Minor
- Hot days now (above 97°F)
- 7 days/yr
- Hot days in 30 yrs
- 19 days/yr
Wind risk 1/10 · Minimal
- Chance of severe wind over 30 yrs
- 1.0%
Air-quality risk 1/10 · Minimal
- Unhealthy air days now
- 0 days/yr
- Unhealthy air days in 30 yrs
- 0 days/yr
Risk factors via First Street. Map © Google.
Why this score? — see what drove the D+ grade
The composite is a weighted blend of 9 inputs, each scored 0–100. Each bar is that input's sub-score; the figure is the points it added to the 100-point composite (weight × sub-score).
- Cash flow +16.2/30.0
- ARV discount +7.6/15.0
- Appreciation +5.5/10.0
- DSCR +5.0/10.0
- Schools +3.8/10.0
- 1% rule +3.5/10.0
- Livability +3.2/5.0
- Rent growth +2.5/5.0
- Condition / age +2.5/5.0
$113,000
🖨 Deal sheet 📄 Offer letter ✓ Due diligence
Listing remarks MLS
Come see this charming home! Don't miss this opportunity.
Key facts
- Blue uv light
- Cleaned ductwork
- Tile finishes
Tags
Neighborhood map
What this means for you Summary
Snapshot
- This is a 3-bed/1.0-bath single-family listed at $113k.
Deal economics
- At list price, monthly cash flow is $61 ($727/yr) — positive.
- The deal already cash-flows at list — no discount required.
- To meet the 1% rule (rent ≥ 1% of price), the offer needs to be $97k (14.5% below list).
- Recommended offer: $97k (14.5% below list) — sets the bar for 1% rule.
Location & tenants
- Location reads 65/100 on livability (#753 in OH) — a middle-class / working-renter tenant base. Strengths: crime A+, cost of living A+, housing A+; Watch: schools C-, amenities F, commute F.
- Switzerland Of Ohio Local (rural): math 39% / reading 51% proficiency, ranked #503 of 656 in OH (top 77%) — families likely to look elsewhere, expect single-tenant / working-renter base with shorter leases.
- Market conditions: 34 active listings in the ZIP.
Forward outlook
- In year one you build about $2k of equity ($781 loan paydown + $1k appreciation (0.9% local appreciation)).
- Monroe County population projected at -22% by 2050 — secular population decline; favor cash flow + early exit over multi-decade hold.
- At projected returns (0.9% appreciation + 3.0% rent growth), your $32k cash investment doubles in ~9 years — after that, you're playing with house money.
Negotiation context
- It's been on market 32 days — a 3% lower offer ($110k) is reasonable based on typical stale-listing flexibility.
- 2 sale attempts since 5y ago; this cycle's ask has dropped $6k (5%) from the opening price — seller is motivated, your offer sets the floor, not the list.
- Current owner paid $70k; list at $113k implies a 63% gain — meaningful room to come down on a strong offer.
Risks & watch-outs
- Watch-outs: built in 1958 — expect roof / HVAC / electrical / plumbing capex.
Questions for the listing agent
- It's been on market 32 days. Have you received any prior offers? Is the seller open to a 15% concession, seller financing, or rate buy-down credit?
- Built in 1958 — when were the roof, HVAC, electrical panel, plumbing, and water heater last replaced?
- Is there a deadline driving the sale (1031 exchange, divorce, estate, relocation)? That informs how much negotiation room exists.
- The area grade is low — what's the realistic commute time and amenity access for the typical tenant pool here? Any planned neighborhood developments (good or bad) we should know about?
- What's the average days-on-market for RENTAL listings here right now (not sales)? A rising rental-DOM trend means longer vacancies and softer asking-rent achievability than the comps imply.
- What's the recent tenant-quality profile in this submarket — average credit score on applications, eviction rate, late-payment / NSF rate, and stable-employment percentage? A property-management company in the area should have these aggregated.
- How much new for-sale + rental construction is in the pipeline within 1–3 miles? Heavy new supply typically softens prices + rents 12–24 months out; constrained supply supports both.
Investment metrics
- 1% rule
- 0.85% ✗
- Cap rate
- 6.94%
- Cash-on-cash
- 2.30%
- DSCR
- 1.10
- GRM
- 9.8
CMA / ARV
- ARV (on-the-fly)
- $113,184
- Comps found
- 3
Show comp detail 3 sales within ~0.75 mi
| Address | Dist | Beds/Ba | Sqft | Sold | Price | $/sf | Match |
|---|---|---|---|---|---|---|---|
| 175 Andover Rd | 0.00mi | 3/1.0 | 864 (0%) | 1mo | $113,000 | $131 | 100 |
| 123 Andover Rd | 0.12mi | 3/1.0 | 864 (0%) | 2mo | $125,000 | $145 | 93 |
| 601 Fairfax Cir | 0.19mi | 3/1.0 | 864 (0%) | 15mo | $96,000 | $111 | 79 |
Match score weights: distance 35% · size 25% · config 20% · recency 20%. Top-matched comps best support the ARV.
Projected returns pro-forma
0.94% appreciation · 3.0% rent growth · sell at horizon
- IRR
- 3.5%
- Equity multiple
- 1.18×
- Total profit
- $5,623
- Equity at exit
- $38,239
- IRR
- 8.0%
- Equity multiple
- 1.97×
- Total profit
- $30,560
- Equity at exit
- $50,556
Cash invested: $31,640 (down + closing). Projections, not guarantees.
Landlord ↔ Tenant lean methodology
- Overall (STATE)
- 73 Landlord-Friendly
- State Ohio
- 73 Landlord-Friendly · R+6
- County
- — inherits STATE
- City
- — inherits STATE
ZIP-level market 43793
- Home prices YoY
- 0.7%
- Active inventory
- 34
- Price-to-rent
- 9.8×
Monthly cashflow live
- Estimated rent
- $966 medium interval (Pro) →
- Mortgage (P&I)
- −$593
- Tax from tax record
- −$63 /mo · $751/yr
- Insurance
- −$47
- HOA
- −$0
- Vacancy / Maint / Mgmt
- −$203
- Net cashflow
- $61
Break-even live
UW: 25.0% down · 7.5% · 30yr · 1.5% tax · 5.0% vac · 8.0% maint · 8.0% mgmt
Financing live
Cash to close
- Down payment
- $28,250
- Closing costs
- $3,390
- Reserves months
- —
- Total cash needed
- —
Loan-product check · same deal, 3 products live
Conventional
25% down · 7.5% · 30yr
- Down + closing
- —
- Monthly P&I
- —
- Monthly cashflow
- —
- DSCR
- —
- Eligible?
- —
Personal DTI + credit; lowest rate.
DSCR
20% down · 8.5% · 30yr
- Down + closing
- —
- Monthly P&I
- —
- Monthly cashflow
- —
- DSCR
- —
- Eligible?
- —
No personal income docs; deal must DSCR.
Hard money
10% down · 12.0% · 12mo
- Down + closing
- —
- Monthly P&I
- —
- Monthly cashflow
- —
- DSCR
- —
- Eligible?
- —
Short-term bridge; refi at stabilization.
Listing history 10 events
-
2026-04-25status Pending
-
2026-04-24price $113,000
-
2026-04-12price $115,000
-
2026-04-03price $117,000
-
2026-03-23$119,000 Active
-
2021-09-09soldstatus $69,500 Closed 57-char remark
Show marketing remark (57 chars)
Come see this charming home! Don't miss this opportunity.
-
2021-07-31status Pending 57-char remark
Show marketing remark (57 chars)
Come see this charming home! Don't miss this opportunity.
-
2021-07-30$69,500 Active 57-char remark
Show marketing remark (57 chars)
Come see this charming home! Don't miss this opportunity.
-
2015-03-30soldstatus $56,000
-
2000-01-10soldstatus $40,000
ⓘ Source: listings_history table (triggers on properties + properties_extension) + one-shot
backfill from property_details.listing_events for pre-trigger history.
Tax reassessment forecast OH · Partial reset (capped growth)
- Current annual tax
- $751 · $63/mo
- Projected year-2 tax
- $1,257 · $105/mo
- Expected delta
- +$506/yr (+$42/mo · 67.4%)
ⓘ Screening estimate from a state-policy table — verify with the county assessor before closing.
Climate risk First Street
- Flood 1/10 Low FEMA zone X (unshaded) · 0% chance over 30 yrs
- Wildfire 3/10 Moderate
- Heat 3/10 Moderate 7 d/yr ≥97°F today · 19 d/yr by 30 yrs out
- Wind 1/10 Low 100% chance of damaging wind over 30 yrs
- Air quality 1/10 Low 0 unhealthy d/yr today · 0 by 30 yrs out
Nearby sold comps map
Loading sold comps map…
Walkable amenities ~0.75 mi
Loading nearby amenities…
Taxation est. · year 1
- Rental income
- $11,587
- − Mortgage interest
- −$6,330
- − Property taxes
- −$751
- − Insurance
- −$565
- − Repairs & maintenance
- −$927
- − Management
- −$927
- − Depreciation
- −$3,287
- Taxable loss
- −$1,199
- Est. tax savings @ 24.0%
- +$288
- After-tax cash flow
- $1,015/yr
For passive investors: Depreciation is non-cash, so a rental often shows a tax loss while cash-flowing — sheltering income. Rental losses are passive: they offset passive income freely, and up to $25,000/yr can offset ordinary (W-2) income if you actively participate and your MAGI is under $100k (phasing out to $0 by $150k); unused losses carry forward. On sale, claimed depreciation is recaptured at up to 25%, and gains may owe capital-gains tax (a 1031 exchange can defer both). Figures are a year-1 estimate at your 24.0% rate — not tax advice; consult a CPA.
Schools (NCES district)
- District
- Switzerland Of Ohio Local
- NCES district ID
- 3904865
- Math proficiency
- 39% ▼ -13.00%
- Reading proficiency
- 51% ▼ -3.00%
- Median HH income
- $40,358
- Composite
- 37.67/100
- National rank
- #4367
- State rank
- #503 of 656 in OH
Livability — Woodsfield
- Score
- 65/100
- State rank
- #753
- US rank
- #13569
Category grades
Schools grade is shown separately in the Schools card above.
Census & demographics
- Census place
- Woodsfield, OH
- County
- Monroe · 13,010 people
- Population (ZIP)
- 4,879
- Household income
- $51,193
- Rent vs Own
- Severe rent burden
- 16.6
Population outlook (Monroe County) Hauer SSP2
- Today (2025)
- 13,685 people
- By 2030
- 13,113 · -4.2%
- By 2040
- 11,852 · -13.4%
- By 2050
- 10,621 · -22.4%
- By 2075
- 7,975 · -41.7%
- By 2100
- 5,494 · -59.9%
Race, ethnicity, and origin ACS 2023
- Neighborhood character
- Predominantly White (94%)
- Race & ethnicity
- White 94% Two or more races 5% Asian 1%
- Common ancestry
- Italian 3% Slovak 2% Iranian 1%
- Foreign-born
- 1% · Philippines
- Languages at home
- 98% English-only · Other Asian/Pacific 1%
Political lean MEDSL · Monroe
- 2024 margin
- Solid R (+59.8) · D 19.7% · R 79.4%
- 2008→2024 swing
- -68.9pp toward R · 2008: 9.2pp · 2024: -59.8pp
- All cycles
- 2024: R+59.8 2020: R+54.0 2016: R+46.9 2012: R+7.9 2008: D+9.2
Not yet ingested
- Civics
- —
Market trends
- HPI YoY
- ▲ 0.94%
- Current HPI
- 143.8315
- Rent YoY
- —
- Metro
- —
- State GDP YoY
- ▲ 1.98%
- F500 in state
- 48
Industry mix (Fortune 500 HQ in OH)
| Industry | F500 HQs | Revenue |
|---|---|---|
| Insurance | 3 | $145B |
|
||
| Industrial Machinery | 3 | $49B |
|
||
| Financial Services | 3 | $24B |
|
||
| Consumer Goods | 2 | $93B |
|
||
| Aerospace / Defense | 2 | $47B |
|
||
| Utilities | 2 | $33B |
|
||
Price history
+182.5% since first listed10 events — show timeline
- 2026-04-25 Pending — MLSNOW
- 2026-04-24 Price Changed $113,000 MLSNOW
- 2026-04-12 Price Changed $115,000 MLSNOW
- 2026-04-03 Price Changed $117,000 MLSNOW
- 2026-03-23 Listed $119,000 MLSNOW
- 2021-09-09 Sold (MLS) $69,500 MLSNOW
- 2021-07-31 Pending — MLSNOW
- 2021-07-30 Listed $69,500 MLSNOW
- 2015-03-30 Sold (Public Records) $56,000 Public Records
- 2000-01-10 Sold (Public Records) $40,000 Public Records
Property tax history
+4.3%/yrLatest (2025): $751 · +17.0% YoY. Source: county tax records.
Cash-flow waterfall
monthlySold comps — $/sqft
last 12 mo · ≤1 miLoading sold comps…