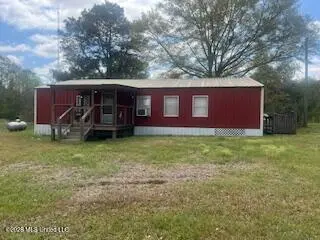
52 Ellisville-turner Rd · Ellisville, MS
Flood risk 1/10 · Minimal
- FEMA flood zone
- X (unshaded)
- Chance of flooding over 30 yrs
- 0.0%
- Est. flood insurance / yr
- $507 – $1,088
Fire risk 4/10 · Minor
- Est. fire insurance / yr
- $1,241 – $2,305
Heat risk 7/10 · Major
- Hot days now (above 107°F)
- 7 days/yr
- Hot days in 30 yrs
- 20 days/yr
Wind risk 8/10 · Major
- Chance of severe wind over 30 yrs
- 97.0%
Air-quality risk 1/10 · Minimal
- Unhealthy air days now
- 0 days/yr
- Unhealthy air days in 30 yrs
- 0 days/yr
Risk factors via First Street. Map © Google.
Why this score? — see what drove the B- grade
The composite is a weighted blend of 9 inputs, each scored 0–100. Each bar is that input's sub-score; the figure is the points it added to the 100-point composite (weight × sub-score).
- Cash flow +30.0/30.0
- DSCR +10.0/10.0
- 1% rule +8.8/10.0
- ARV discount +7.5/15.0
- Schools +3.3/10.0
- Livability +3.2/5.0
- Rent growth +2.5/5.0
- Condition / age +2.5/5.0
- Appreciation +0.0/10.0
$105,000
🖨 Deal sheet (PDF) 📄 Offer letter ✓ Due diligence
Listing remarks MLS
Charming country property with investment potential! This 2-bedroom, 1-bath home sits on a full acre and offers a spacious layout with a large kitchen, dining, and living area--perfect for comfortable everyday living. Enjoy peaceful surroundings from the inviting front porch, while the side deck with ramp access provides added convenience and functionality. Ideal for investors or those looking to expand, the property also features an additional mobile home pad located behind the home--offering the opportunity for a second income-producing unit. Conveniently located just 5 minutes (4.9 miles) from Jones College, approximately 18 minutes to Laurel, and only 20 minutes to Bogue Homa Lake. A great blend of country charm and income potential!
Key facts
- Large kitchen
- Full acre
- 1 acre lot
Tags
Neighborhood map
What this means for you Summary
Snapshot
- This is a 2-bed/1.0-bath single-family listed at $105k.
Deal economics
- At list price, monthly cash flow is $493 ($6k/yr) — positive.
- The deal already cash-flows at list — no discount required.
- Meets the 1% rule at list price ($1k rent vs $105k).
- Recommended offer: $99k (6.0% below list) — sets the bar for market timing.
Location & tenants
- Location reads 64/100 on livability (#123 in MS) — a middle-class / working-renter tenant base. Strengths: crime A+, cost of living A+, housing A-; Watch: health & safety D, schools D-, amenities F.
- Jones County School District (rural): math 40% / reading 39% proficiency, ranked #40 of 130 in MS (top 31%) — families likely to look elsewhere, expect single-tenant / working-renter base with shorter leases.
- Market conditions: 92 active listings in the ZIP; 23 units permitted in Jones County in 2024 (5 in 5+ unit buildings).
Forward outlook
- Local home prices are declining (-3.0%/yr); year-one equity from $726 of loan paydown is wiped out by about $3k of value loss. Plan a longer hold.
- Jones County population projected to shrink 4% by 2050 — rents likely to lag national; underwrite the cash flow, not the appreciation.
- At projected returns (-3.0% appreciation + 3.0% rent growth), your $29k cash investment doubles in ~7 years — after that, you're playing with house money.
Negotiation context
- It's been on market 87 days — a 6% lower offer ($99k) is reasonable based on typical stale-listing flexibility.
- 4 sale attempts since 4y ago with the ask held roughly flat each time — persistent listings suggest the price (not the market) is what's stuck; bring a comps-based counter.
Risks & watch-outs
- Climate carrying-cost: severe wind risk, 97% chance of damaging wind over 30y; extreme-heat days projected 7→20/yr by 2055 (HVAC capex compounding) — expect insurance premiums to compound above CPI over the hold.
Questions for the listing agent
- It's been on market 87 days. Have you received any prior offers? Is the seller open to a 6% concession, seller financing, or rate buy-down credit?
- Why hasn't it sold? Are there any deal-killer items the seller is aware of (foundation, flood, title, zoning, code violations)?
- Is there a deadline driving the sale (1031 exchange, divorce, estate, relocation)? That informs how much negotiation room exists.
- Schools are D-rated, which usually means shorter tenancies and higher turnover. Who's the typical renter profile here, and what's been the actual vacancy rate?
- What's the average days-on-market for RENTAL listings here right now (not sales)? A rising rental-DOM trend means longer vacancies and softer asking-rent achievability than the comps imply.
- What's the recent tenant-quality profile in this submarket — average credit score on applications, eviction rate, late-payment / NSF rate, and stable-employment percentage? A property-management company in the area should have these aggregated.
- How much new for-sale + rental construction is in the pipeline within 1–3 miles? Heavy new supply typically softens prices + rents 12–24 months out; constrained supply supports both.
Investment metrics
- 1% rule
- 1.38% ✓
- Cap rate
- 11.92%
- Cash-on-cash
- 20.11%
- DSCR
- 1.89
- GRM
- 6.0
CMA / ARV
- ARV (median comp)
- $21,829
- List price
- $105,000
- Delta
- 381.02%
- Verdict
- OVERPRICED
- Comps
- 1 within 2.0 mi
Projected returns pro-forma
-3.0% appreciation · 3.0% rent growth · sell at horizon
- IRR
- 12.3%
- Equity multiple
- 1.49×
- Total profit
- $14,351
- Equity at exit
- $15,656
- IRR
- 21.2%
- Equity multiple
- 2.80×
- Total profit
- $52,825
- Equity at exit
- $9,078
Cash invested: $29,400 (down + closing). Projections, not guarantees.
Landlord ↔ Tenant lean methodology
- Overall (STATE)
- 90 Strongly Landlord-Friendly
- State Mississippi
- 90 Strongly Landlord-Friendly · R+11
- County
- — inherits STATE
- City
- — inherits STATE
ZIP-level market 39437
- Home prices YoY
- -20.6%
- Active inventory
- 92
- Price-to-rent
- 6.0×
Monthly cashflow live
- Estimated rent
- $1,453 medium interval (Pro) →
- Mortgage (P&I)
- −$551
- Tax from tax record
- −$61 /mo · $730/yr
- Insurance
- −$44
- HOA
- −$0
- Vacancy / Maint / Mgmt
- −$305
- Net cashflow
- $493
Break-even live
Sensitivity live
| Price | -10% $552 | -5% $523 | +0% $493 | +5% $463 | +10% $433 |
|---|---|---|---|---|---|
| Rent | -10% $378 | -5% $435 | +0% $493 | +5% $550 | +10% $608 |
| Rate | -1.0pp $546 | -0.5pp $520 | base $493 | +0.5pp $466 | +1.0pp $438 |
UW: 25.0% down · 7.5% · 30yr · 1.5% tax · 5.0% vac · 8.0% maint · 8.0% mgmt
Financing live
Cash to close
- Down payment
- $26,250
- Closing costs
- $3,150
- Reserves months
- —
- Total cash needed
- —
Loan-product check · same deal, 3 products live
Conventional
25% down · 7.5% · 30yr
- Down + closing
- —
- Monthly P&I
- —
- Monthly cashflow
- —
- DSCR
- —
- Eligible?
- —
Personal DTI + credit; lowest rate.
DSCR
20% down · 8.5% · 30yr
- Down + closing
- —
- Monthly P&I
- —
- Monthly cashflow
- —
- DSCR
- —
- Eligible?
- —
No personal income docs; deal must DSCR.
Hard money
10% down · 12.0% · 12mo
- Down + closing
- —
- Monthly P&I
- —
- Monthly cashflow
- —
- DSCR
- —
- Eligible?
- —
Short-term bridge; refi at stabilization.
Listing history 23 events
-
2026-06-19days on market $105,000 Active 87 DOM
-
2026-06-18days on market $105,000 Active 86 DOM
-
2026-06-17days on market $105,000 Active 85 DOM
-
2026-06-16days on market $105,000 Active 84 DOM
-
2026-06-15days on market $105,000 Active 83 DOM
-
2026-06-14days on market $105,000 Active 81 DOM
-
2026-06-13days on market $105,000 Active 80 DOM
-
2026-06-10days on market $105,000 Active 78 DOM
-
2026-06-09days on market $105,000 Active 77 DOM
-
2026-06-08days on market $105,000 Active 76 DOM
-
2026-06-07days on market $105,000 Active 75 DOM
-
2026-06-05days on market $105,000 Active 72 DOM
-
2026-06-03days on market $105,000 Active 71 DOM
-
2026-06-02days on market $105,000 Active 70 DOM
-
2026-06-01days on market $105,000 Active 69 DOM
-
2026-05-31days on market $105,000 Active 68 DOM
-
2026-05-30days on market $105,000 Active 67 DOM
-
2026-03-24$105,000 Active 747-char remark
Show marketing remark (749 chars)
Charming country property with investment potential! This 2-bedroom, 1-bath home sits on a full acre and offers a spacious layout with a large kitchen, dining, and living area--perfect for comfortable everyday living. Enjoy peaceful surroundings from the inviting front porch, while the side deck with ramp access provides added convenience and functionality. Ideal for investors or those looking to expand, the property also features an additional mobile home pad located behind the home--offering the opportunity for a second income-producing unit. Conveniently located just 5 minutes (4.9 miles) from Jones College, approximately 18 minutes to Laurel, and only 20 minutes to Bogue Homa Lake. A great blend of country charm and income potential!
-
2026-03-24$105,000 Active 749-char remark
Show marketing remark (749 chars)
Charming country property with investment potential! This 2-bedroom, 1-bath home sits on a full acre and offers a spacious layout with a large kitchen, dining, and living area--perfect for comfortable everyday living. Enjoy peaceful surroundings from the inviting front porch, while the side deck with ramp access provides added convenience and functionality. Ideal for investors or those looking to expand, the property also features an additional mobile home pad located behind the home--offering the opportunity for a second income-producing unit. Conveniently located just 5 minutes (4.9 miles) from Jones College, approximately 18 minutes to Laurel, and only 20 minutes to Bogue Homa Lake. A great blend of country charm and income potential!
-
2025-09-29price $110,000
-
2025-07-29$125,000 Active
-
2022-03-14soldstatus
-
2022-01-07$69,000
ⓘ Source: listings_history table (triggers on properties + properties_extension) + one-shot
backfill from property_details.listing_events for pre-trigger history.
Tax reassessment forecast MS · Resets to sale price
- Current annual tax
- $730 · $61/mo
- Projected year-2 tax
- $830 · $69/mo
- Expected delta
- +$99/yr (+$8/mo · 13.6%)
ⓘ Screening estimate from a state-policy table — verify with the county assessor before closing.
Climate risk First Street
- Flood 1/10 Low FEMA zone X (unshaded) · 0% chance over 30 yrs
- Wildfire 4/10 Moderate
- Heat 7/10 Severe 7 d/yr ≥107°F today · 20 d/yr by 30 yrs out
- Wind 8/10 Severe 97% chance of damaging wind over 30 yrs
- Air quality 1/10 Low 0 unhealthy d/yr today · 0 by 30 yrs out
Nearby sold comps map
Loading sold comps map…
Walkable amenities ~0.75 mi
Loading nearby amenities…
Taxation est. · year 1
- Rental income
- $17,439
- − Mortgage interest
- −$5,882
- − Property taxes
- −$730
- − Insurance
- −$525
- − Repairs & maintenance
- −$1,395
- − Management
- −$1,395
- − Depreciation
- −$3,055
- Taxable income
- $4,457
- Est. tax owed @ 24.0%
- −$1,070
- After-tax cash flow
- $4,844/yr
For passive investors: Depreciation is non-cash, so a rental often shows a tax loss while cash-flowing — sheltering income. Rental losses are passive: they offset passive income freely, and up to $25,000/yr can offset ordinary (W-2) income if you actively participate and your MAGI is under $100k (phasing out to $0 by $150k); unused losses carry forward. On sale, claimed depreciation is recaptured at up to 25%, and gains may owe capital-gains tax (a 1031 exchange can defer both). Figures are a year-1 estimate at your 24.0% rate — not tax advice; consult a CPA.
Schools (NCES district)
- District
- Jones County School District
- NCES district ID
- 2802280
- Math proficiency
- 40% ▼ -11.00%
- Reading proficiency
- 39% ▼ -6.00%
- Median HH income
- $41,051
- Composite
- 33.24/100
- National rank
- #5520
- State rank
- #40 of 130 in MS
Livability — Ellisville
- Score
- 64/100
- State rank
- #123
- US rank
- #13645
Category grades
Schools grade is shown separately in the Schools card above.
Census & demographics
- City population
- 12,287
- Population (ZIP)
- 12,287
Population outlook (Jones County) Hauer SSP2
- Today (2025)
- 68,800 people
- By 2030
- 68,773 · +-0.0%
- By 2040
- 68,087 · -1.0%
- By 2050
- 66,241 · -3.7%
- By 2075
- 58,600 · -14.8%
- By 2100
- 45,744 · -33.5%
Race, ethnicity, and origin ACS 2023
- Neighborhood character
- Predominantly White (78%)
- Race & ethnicity
- White 78% Black 16% Hispanic / Latino 5% Two or more races 2%
- Hispanic origin (detail)
- Mexican 5%
- Common ancestry
- Italian 2% Slovak 2% Lithuanian 2%
- Foreign-born
- 2% · Canada
- Languages at home
- 93% English-only · Spanish 6% Other Indo-European 1%
Political lean MEDSL · Jones
- 2024 margin
- Solid R (+46.8) · D 26.2% · R 73.0%
- 2008→2024 swing
- -8.2pp toward R · 2008: -38.6pp · 2024: -46.8pp
- All cycles
- 2024: R+46.8 2020: R+42.2 2016: R+43.6 2012: R+38.2 2008: R+38.6
Not yet ingested
- Civics
- —
Market trends
- HPI YoY
- ▼ -36.84%
- Current HPI
- 142.2369
- Rent YoY
- —
- Metro
- —
- State GDP YoY
- —
- F500 in state
- 0
Price history
+52.2% since first listed6 events — show timeline
- 2026-03-24 Listed $105,000 HAAR
- 2026-03-24 Listed $105,000 MLSU
- 2025-09-29 Price Changed $110,000 LBOR
- 2025-07-29 Listed $125,000 LBOR
- 2022-03-14 Sold (MLS) — LBOR
- 2022-01-07 Listed $69,000 LBOR
Property tax history
+6.9%/yrLatest (2025): $730 · -4.2% YoY. Source: county tax records.
Cash-flow waterfall
monthlySold comps — $/sqft
last 12 mo · ≤1 miLoading sold comps…