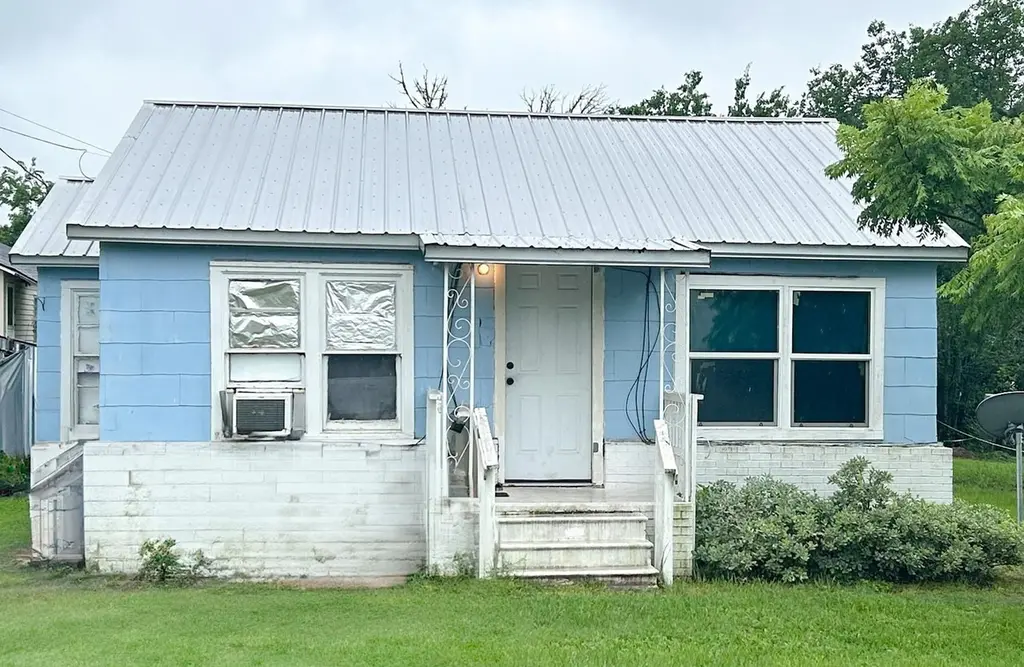
540 W Hempstead St · Giddings, TX
Flood risk 1/10 · Minimal
- FEMA flood zone
- X (unshaded)
- Chance of flooding over 30 yrs
- 0.0%
- Est. flood insurance / yr
- $507 – $1,088
Fire risk 3/10 · Minor
- Est. fire insurance / yr
- $1,222 – $2,270
Heat risk 8/10 · Major
- Hot days now (above 109°F)
- 7 days/yr
- Hot days in 30 yrs
- 23 days/yr
Wind risk 8/10 · Major
- Chance of severe wind over 30 yrs
- 90.0%
Air-quality risk 1/10 · Minimal
- Unhealthy air days now
- 0 days/yr
- Unhealthy air days in 30 yrs
- 0 days/yr
Risk factors via First Street. Map © Google.
Why this score? — see what drove the B- grade
The composite is a weighted blend of 9 inputs, each scored 0–100. Each bar is that input's sub-score; the figure is the points it added to the 100-point composite (weight × sub-score).
- Cash flow +30.0/30.0
- 1% rule +10.0/10.0
- DSCR +10.0/10.0
- ARV discount +7.5/15.0
- Schools +3.8/10.0
- Livability +3.2/5.0
- Rent growth +2.5/5.0
- Condition / age +2.5/5.0
- Appreciation +0.0/10.0
$79,500
🖨 Deal sheet (PDF) 📄 Offer letter ✓ Due diligence
Listing remarks MLS
Tucked away with plenty of charm, this 2-bedroom, 1-bath home is a diamond in the rough just waiting for the right touch. With a little vision and some TLC, this “cute” could easily become truly adorable. Whether you’re an investor, flipper, or buyer looking to create something special, the potential here is hard to ignore. Priced to sell and ready for transformation—opportunities like this don’t linger long.
Key facts
- 4,830 sq ft lot
- 2 parking spots
- Community pool
Property features AI
Finance
- Financial info: Property assessed and tax details available (financial figures excluded)
- HOA & community: Community amenities include fitness center, golf, laundry facilities, library, playground, pool, restaurant, airport/runway access, and street lights
Exterior
- Parking: Off-street parking for 2 vehicles
- Utilities: Electricity connected; Natural gas connected; Public water; Public sewer
- Home design: Single-story home; Faces north; Pillar/post/pier foundation
- Construction: Frame construction; Metal roof; Built according to public records
- Exterior features: Covered porch; Storage structure; Community pool access
Interior
- Kitchen: Free-standing gas range
- Bedrooms: 2 bedrooms on the main level
- Bathrooms: 1 full bathroom
- Heating & cooling: Natural gas heating; Wall/window air conditioning units
- Interior features: No additional interior features listed
- Laundry & utility: Laundry inside
Neighborhood map
What this means for you Summary
Snapshot
- This is a 2-bed/1.0-bath single-family listed at $80k.
Deal economics
- At list price, monthly cash flow is $887 ($11k/yr) — positive.
- The deal already cash-flows at list — no discount required.
- Meets the 1% rule at list price ($2k rent vs $80k).
- Cap rate 19.7% vs local median 3.4% in Giddings — top-decile yield for the area; either an underpriced asset or a hidden risk that comps aren't pricing in. Stress-test before assuming the spread holds.
Location & tenants
- Location reads 64/100 on livability (#751 in TX) — a middle-class / working-renter tenant base. Strengths: cost of living A+, housing A+; Watch: amenities F, commute F, employment D-.
- Giddings ISD (rural): math 45% / reading 45% proficiency, ranked #270 of 826 in TX (top 33%) — families likely to look elsewhere, expect single-tenant / working-renter base with shorter leases.
- Zoned schools: Giddings El (math 27% / reading 27%, grade F, #2,791 of 4,322 statewide, top 68%, 574 students, 72% FRL); Giddings Middle (math 41% / reading 45%, grade D-, #540 of 1,662 statewide, top 33%, 455 students, 57% FRL); Giddings H S (math 77% / reading 62%, grade B, #119 of 1,632 statewide, top 9%, 653 students, 46% FRL) — zoned schools at 58% FRL track the district average.
- Market conditions: 92 active listings in the ZIP; 1 comparable units currently listed for rent nearby; 18 units permitted in Lee County in 2024 (0 in 5+ unit buildings).
Forward outlook
- Local home prices are declining (-3.0%/yr); year-one equity from $550 of loan paydown is wiped out by about $2k of value loss. Plan a longer hold.
- At projected returns (-3.0% appreciation + 3.0% rent growth), your $22k cash investment doubles in ~3 years — after that, you're playing with house money.
Negotiation context
- Only 12 days on market — expect competitive offers; lowballing is unlikely to land.
- 3 sale attempts with the ask held roughly flat each time — persistent listings suggest the price (not the market) is what's stuck; bring a comps-based counter.
Risks & watch-outs
- Watch-outs: built in 1944 — expect roof / HVAC / electrical / plumbing capex.
- Climate carrying-cost: severe wind risk, 90% chance of damaging wind over 30y; extreme-heat days projected 7→23/yr by 2055 (HVAC capex compounding) — expect insurance premiums to compound above CPI over the hold.
Questions for the listing agent
- Built in 1944 — when were the roof, HVAC, electrical panel, plumbing, and water heater last replaced?
- Is there a deadline driving the sale (1031 exchange, divorce, estate, relocation)? That informs how much negotiation room exists.
- Schools are F-rated, which usually means shorter tenancies and higher turnover. Who's the typical renter profile here, and what's been the actual vacancy rate?
- What's the average days-on-market for RENTAL listings here right now (not sales)? A rising rental-DOM trend means longer vacancies and softer asking-rent achievability than the comps imply.
- What's the recent tenant-quality profile in this submarket — average credit score on applications, eviction rate, late-payment / NSF rate, and stable-employment percentage? A property-management company in the area should have these aggregated.
- How much new for-sale + rental construction is in the pipeline within 1–3 miles? Heavy new supply typically softens prices + rents 12–24 months out; constrained supply supports both.
Investment metrics
- 1% rule
- 2.26% ✓
- Cap rate
- 19.68%
- Cash-on-cash
- 47.80%
- DSCR
- 3.13
- GRM
- 3.7
CMA / ARV
- ARV (median comp)
- $173,287
- List price
- $79,500
- Delta
- -54.12%
- Verdict
- UNDERPRICED
- Comps
- 20 within 1.0 mi
Show comp detail 3 sales within ~0.75 mi
| Address | Dist | Beds/Ba | Sqft | Sold | Price | $/sf | Match |
|---|---|---|---|---|---|---|---|
| 555 W Hempstead St | 0.03mi | 2/1.0 | 910 (-11%) | 17mo | $150,000 | $165 | 66 |
| 486 E Galveston St | 0.57mi | 2/1.0 | 1,068 (+4%) | 11mo | $174,000 | $163 | 57 |
| 569 N Chambers St | 0.74mi | 2/2.0 | 1,002 (-2%) | 20mo | $229,000 | $229 | 41 |
Match score weights: distance 35% · size 25% · config 20% · recency 20%. Top-matched comps best support the ARV.
Projected returns pro-forma
-3.0% appreciation · 3.0% rent growth · sell at horizon
- IRR
- 45.2%
- Equity multiple
- 2.96×
- Total profit
- $43,611
- Equity at exit
- $11,854
- IRR
- 51.1%
- Equity multiple
- 5.98×
- Total profit
- $110,770
- Equity at exit
- $6,874
Cash invested: $22,260 (down + closing). Projections, not guarantees.
Landlord ↔ Tenant lean methodology
- Overall (STATE)
- 87 Strongly Landlord-Friendly
- State Texas
- 87 Strongly Landlord-Friendly · R+5
- County
- — inherits STATE
- City
- — inherits STATE
ZIP-level market 78942
- Home prices YoY
- -17.2%
- Active inventory
- 92
- Price-to-rent
- 3.7×
Monthly cashflow live
- Estimated rent
- $1,800 medium interval (Pro) →
- Mortgage (P&I)
- −$417
- Tax from tax record
- −$85 /mo · $1,023/yr
- Insurance
- −$33
- HOA
- −$0
- Vacancy / Maint / Mgmt
- −$378
- Net cashflow
- $887
Break-even live
Sensitivity live
| Price | -10% $932 | -5% $909 | +0% $887 | +5% $864 | +10% $842 |
|---|---|---|---|---|---|
| Rent | -10% $745 | -5% $816 | +0% $887 | +5% $958 | +10% $1,029 |
| Rate | -1.0pp $927 | -0.5pp $907 | base $887 | +0.5pp $866 | +1.0pp $845 |
UW: 25.0% down · 7.5% · 30yr · 1.5% tax · 5.0% vac · 8.0% maint · 8.0% mgmt
Financing live
Cash to close
- Down payment
- $19,875
- Closing costs
- $2,385
- Reserves months
- —
- Total cash needed
- —
Loan-product check · same deal, 3 products live
Conventional
25% down · 7.5% · 30yr
- Down + closing
- —
- Monthly P&I
- —
- Monthly cashflow
- —
- DSCR
- —
- Eligible?
- —
Personal DTI + credit; lowest rate.
DSCR
20% down · 8.5% · 30yr
- Down + closing
- —
- Monthly P&I
- —
- Monthly cashflow
- —
- DSCR
- —
- Eligible?
- —
No personal income docs; deal must DSCR.
Hard money
10% down · 12.0% · 12mo
- Down + closing
- —
- Monthly P&I
- —
- Monthly cashflow
- —
- DSCR
- —
- Eligible?
- —
Short-term bridge; refi at stabilization.
Rent comps 1 comps
| Address | Beds | Baths | Sqft | Rent | $/sqft | DOM | Units | Dist |
|---|---|---|---|---|---|---|---|---|
| 199 Cactus St Giddings, TX | 3.0 | 2.0 | 1350 | $1,800 | $1.33 | 19d | 1 | 0.91mi |
Listing history 4 events
-
2026-05-15status Active 442-char remark
-
2026-05-01$79,500 Active 442-char remark
Show marketing remark (442 chars)
Tucked away with plenty of charm, this 2-bedroom, 1-bath home is a diamond in the rough just waiting for the right touch. With a little vision and some TLC, this “cute” could easily become truly adorable. Whether you’re an investor, flipper, or buyer looking to create something special, the potential here is hard to ignore. Priced to sell and ready for transformation—opportunities like this don’t linger long.
-
2014-12-04soldstatus
ⓘ Source: listings_history table (triggers on properties + properties_extension) + one-shot
backfill from property_details.listing_events for pre-trigger history.
Tax reassessment forecast TX · Resets to sale price
- Current annual tax
- $1,023 · $85/mo
- Projected year-2 tax
- $1,455 · $121/mo
- Expected delta
- +$432/yr (+$36/mo · 42.2%)
ⓘ Screening estimate from a state-policy table — verify with the county assessor before closing.
Climate risk First Street
- Flood 1/10 Low FEMA zone X (unshaded) · 0% chance over 30 yrs
- Wildfire 3/10 Moderate
- Heat 8/10 Severe 7 d/yr ≥109°F today · 23 d/yr by 30 yrs out
- Wind 8/10 Severe 90% chance of damaging wind over 30 yrs
- Air quality 1/10 Low 0 unhealthy d/yr today · 0 by 30 yrs out
Nearby sold comps map
Loading sold comps map…
Walkable amenities ~0.75 mi
Loading nearby amenities…
Taxation est. · year 1
- Rental income
- $21,600
- − Mortgage interest
- −$4,453
- − Property taxes
- −$1,023
- − Insurance
- −$398
- − Repairs & maintenance
- −$1,728
- − Management
- −$1,728
- − Depreciation
- −$2,313
- Taxable income
- $9,957
- Est. tax owed @ 24.0%
- −$2,390
- After-tax cash flow
- $8,251/yr
For passive investors: Depreciation is non-cash, so a rental often shows a tax loss while cash-flowing — sheltering income. Rental losses are passive: they offset passive income freely, and up to $25,000/yr can offset ordinary (W-2) income if you actively participate and your MAGI is under $100k (phasing out to $0 by $150k); unused losses carry forward. On sale, claimed depreciation is recaptured at up to 25%, and gains may owe capital-gains tax (a 1031 exchange can defer both). Figures are a year-1 estimate at your 24.0% rate — not tax advice; consult a CPA.
Schools (NCES district)
- District
- Giddings ISD
- NCES district ID
- 4820640
- Math proficiency
- 45% ▬ 0.00%
- Reading proficiency
- 45% ▲ 4.00%
- Median HH income
- $46,580
- Composite
- 38.32/100
- National rank
- #4226
- State rank
- #270 of 826 in TX
Livability — Giddings
- Score
- 64/100
- State rank
- #751
- US rank
- #13837
Category grades
Schools grade is shown separately in the Schools card above.
Census & demographics
- Census place
- Giddings, TX
- Population (ZIP)
- 9,858
Population outlook (Lee County) Hauer SSP2
- Today (2025)
- 17,796 people
- By 2030
- 18,082 · +1.6%
- By 2040
- 18,377 · +3.3%
- By 2050
- 17,950 · +0.9%
- By 2075
- 16,005 · -10.1%
- By 2100
- 13,413 · -24.6%
Race, ethnicity, and origin ACS 2023
- Neighborhood character
- Diverse neighborhood (Simpson 0.61)
- Race & ethnicity
- White 51% Hispanic / Latino 34% Black 12% Two or more races 10% Native American 3%
- Hispanic origin (detail)
- Mexican 32%
- Common ancestry
- Lithuanian 2% Romanian 2% Portuguese 2%
- Foreign-born
- 10% · Canada
- Languages at home
- 73% English-only · Spanish 26% German/W. Germanic 1%
Political lean MEDSL · Lee
- 2024 margin
- Solid R (+60.4) · D 19.5% · R 79.9%
- 2008→2024 swing
- -24.2pp toward R · 2008: -36.3pp · 2024: -60.4pp
- All cycles
- 2024: R+60.4 2020: R+55.7 2016: R+55.6 2012: R+46.3 2008: R+36.3
Not yet ingested
- Civics
- —
Market trends
- HPI YoY
- ▼ -42.66%
- Current HPI
- 205.1633
- Rent YoY
- —
- Metro
- —
- State GDP YoY
- ▲ 3.95%
- F500 in state
- 110
Industry mix (Fortune 500 HQ in TX)
| Industry | F500 HQs | Revenue |
|---|---|---|
| Energy | 16 | $1,198B |
|
||
| Technology | 5 | $198B |
|
||
| Engineering / Construction | 4 | $72B |
|
||
| Energy Services | 3 | $60B |
|
||
| Utilities | 3 | $41B |
|
||
| Healthcare | 2 | $330B |
|
||
Price history
+0.0% since first listed6 events — show timeline
- 2026-05-26 Pending — HARMLS
- 2026-05-26 Pending — Unlock MLS
- 2026-05-15 Relisted — Unlock MLS
- 2026-05-01 Listed $79,500 Unlock MLS
- 2026-05-01 Listed $79,500 HARMLS
- 2014-12-04 Sold (Public Records) — Public Records
Property tax history
+3.4%/yrLatest (2025): $1,023 · +5.3% YoY. Source: county tax records.
Cash-flow waterfall
monthlySold comps — $/sqft
last 12 mo · ≤1 miLoading sold comps…