 🏗️ New Construction
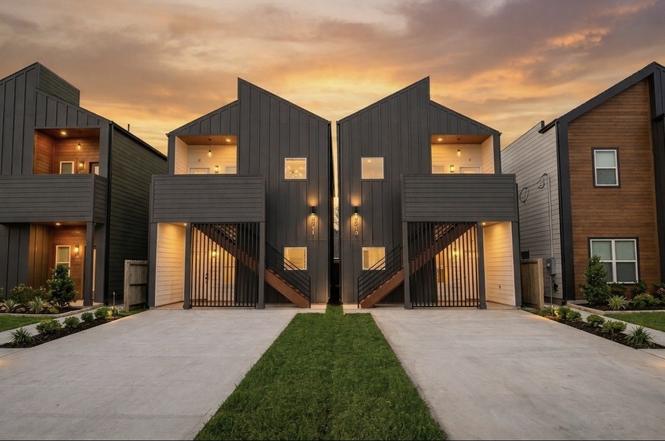
9725 Kerr A-b St · Houston, TX
Flood risk 5/10 · Moderate
- FEMA flood zone
- X (unshaded)
- Chance of flooding over 30 yrs
- 0.67%
- Est. flood insurance / yr
- $507 – $1,088
Fire risk 2/10 · Minimal
- Est. fire insurance / yr
- $1,222 – $2,270
Heat risk 9/10 · Severe
- Hot days now (above 109°F)
- 7 days/yr
- Hot days in 30 yrs
- 23 days/yr
Wind risk 9/10 · Severe
- Chance of severe wind over 30 yrs
- 99.0%
Air-quality risk 3/10 · Minor
- Unhealthy air days now
- 2 days/yr
- Unhealthy air days in 30 yrs
- 3 days/yr
Risk factors via First Street. Map © Google.
Why this score? — see what drove the C- grade
The composite is a weighted blend of 9 inputs, each scored 0–100. Each bar is that input's sub-score; the figure is the points it added to the 100-point composite (weight × sub-score).
- Cash flow +15.2/30.0
- Appreciation +10.0/10.0
- ARV discount +7.5/15.0
- DSCR +4.7/10.0
- 1% rule +4.2/10.0
- Livability +3.7/5.0
- Schools +2.8/10.0
- Rent growth +2.5/5.0
- Condition / age +2.5/5.0
$359,900
🖨 Deal sheet (PDF) 📄 Offer letter ✓ Due diligence
Multi-family units
County records classify this as Multi-Family (2-4 Unit). Listing-text estimate: 2 units. confirmed
Listing remarks
Construction to be completed by APRIL 30th, 2026 • Elevation is copyrighted © | Exceptional Investment Opportunity: Brand New Duplex, Ideal for Discerning Investors/Owners! Stunning, Purposefully designed to meet the exacting demands of the savvy investor. Crafted with meticulous attention, this property promises not only an exceptional living space but also a highly lucrative investment opportunity. 10ft walls, quartz countertop, kitchen drawers soft close. Tile from Tub to ceiling. Key Features: 1.Prime Location. 2.Contemporary Design. 3.Thoughtful Layout. 4.Quality Craftsmanship. 5.Investment Potential. 6.Turnkey equity Investment. No gas, All electric; Gutters; Individual, D
Key facts
- 2,500 sq ft lot
- Built 2026
- Listed 64 days
Tags
Neighborhood map
What this means for you Summary
Snapshot
- This is a 2 × 3-bed/2.0-bath units multifamily listed at $360k.
Deal economics
- At list price, monthly cash flow is $127 ($2k/yr) — positive. Per door: $63/mo.
- The deal already cash-flows at list — no discount required.
- To meet the 1% rule (rent ≥ 1% of price), the offer needs to be $331k (8.1% below list).
- Recommended offer: $331k (8.1% below list) — sets the bar for 1% rule.
- Cap rate 6.7% vs local median 3.2% in Houston — top-decile yield for the area; either an underpriced asset or a hidden risk that comps aren't pricing in. Stress-test before assuming the spread holds.
Location & tenants
- Location reads 74/100 on livability (#184 in TX, #4,771 nationally) — a middle-class / working-renter tenant base. Strengths: amenities A+, cost of living A+, housing A+; Watch: crime F.
- Galena Park ISD (suburban): math 32% / reading 33% proficiency, ranked #578 of 826 in TX (top 70%) — families likely to look elsewhere, expect single-tenant / working-renter base with shorter leases; 74% free/reduced lunch — lower-income household profile, screen leases tightly.
- Zoned schools: Woodland Acres El (math 30% / reading 39%, grade F, #1,995 of 4,322 statewide, top 50%, 443 students, 85% FRL); Woodland Acres Middle (math 35% / reading 34%, grade F, #858 of 1,662 statewide, top 54%, 603 students, 85% FRL); Galena Park H S (math 37% / reading 36%, grade F, #924 of 1,632 statewide, top 57%, 1,914 students, 87% FRL).
- Market conditions: 154 active listings in the ZIP; 1 comparable units currently listed for rent nearby; 29,883 units permitted in Harris County in 2024 (8,621 in 5+ unit buildings).
- At $3,309/mo this rent would consume 82% of the median local household income ($48k/yr) (locally 457% of renters already pay >50% of income on rent) — very limited rent-growth headroom before tenants either downsize or default.
Forward outlook
- In year one you build about $38k of equity ($2k loan paydown + $36k appreciation (10.0% local appreciation)).
- Harris County population projected at +47% by 2050 — long-run rental-demand tailwind backs the buy-and-hold thesis.
- At projected returns (10.0% appreciation + 3.0% rent growth), your $101k cash investment doubles in ~3 years — after that, you're playing with house money.
- By year 2, paydown + projected appreciation supports a ~$62k cash-out refi (75% LTV) — recoverable capital for the next deal without selling this one.
Negotiation context
- It's been on market 64 days — a 6% lower offer ($338k) is reasonable based on typical stale-listing flexibility.
- 3 sale attempts with the ask held roughly flat each time — persistent listings suggest the price (not the market) is what's stuck; bring a comps-based counter.
Risks & watch-outs
- Climate carrying-cost: moderate flood risk; severe wind risk, 99% chance of damaging wind over 30y; extreme-heat days projected 7→23/yr by 2055 (HVAC capex compounding) — expect insurance premiums to compound above CPI over the hold.
Questions for the listing agent
- It's been on market 64 days. Have you received any prior offers? Is the seller open to a 8% concession, seller financing, or rate buy-down credit?
- Can we see the unit-by-unit rent roll, current vacancy, and any below-market leases? What's the average tenancy length?
- What capital expenditures (roof, boiler, parking lot, exteriors) have been made in the last 5 years, and what's planned in the next 2?
- Why hasn't it sold? Are there any deal-killer items the seller is aware of (foundation, flood, title, zoning, code violations)?
- Is there a deadline driving the sale (1031 exchange, divorce, estate, relocation)? That informs how much negotiation room exists.
- Schools are D-rated, which usually means shorter tenancies and higher turnover. Who's the typical renter profile here, and what's been the actual vacancy rate?
- Crime grade is F in this area — have there been break-ins, vandalism, or insurance claims at this property in the last 3 years? What carrier currently insures it and at what premium?
- What's the average days-on-market for RENTAL listings here right now (not sales)? A rising rental-DOM trend means longer vacancies and softer asking-rent achievability than the comps imply.
- What's the recent tenant-quality profile in this submarket — average credit score on applications, eviction rate, late-payment / NSF rate, and stable-employment percentage? A property-management company in the area should have these aggregated.
- How much new apartment / multifamily construction is in the pipeline within 1–3 miles? Heavy new supply (>2% of stock underway) typically softens rents 12–24 months out; light construction supports rent growth.
Investment metrics
- 1% rule
- 0.92% ✗
- Cap rate
- 6.72%
- Cash-on-cash
- 1.51%
- DSCR
- 1.07
- GRM
- 9.1
CMA / ARV
No comps found within radius.
Projected returns pro-forma
10.0% appreciation · 3.0% rent growth · sell at horizon
- IRR
- 25.4%
- Equity multiple
- 3.03×
- Total profit
- $204,145
- Equity at exit
- $324,226
- IRR
- 22.3%
- Equity multiple
- 6.90×
- Total profit
- $594,915
- Equity at exit
- $699,207
Cash invested: $100,772 (down + closing). Projections, not guarantees.
Landlord ↔ Tenant lean methodology
- Overall (STATE)
- 87 Strongly Landlord-Friendly
- State Texas
- 87 Strongly Landlord-Friendly · R+5
- County
- — inherits STATE
- City
- — inherits STATE
ZIP-level market 77029
- Home prices YoY
- 7.2%
- Active inventory
- 154
- Price-to-rent
- 18.1×
Monthly cashflow live
- Estimated rent
- $3,309 high interval (Pro) →
- Mortgage (P&I)
- −$1,887
- Tax est. 1.5%
- −$450 /mo · $5,398/yr
- Insurance
- −$150
- HOA
- −$0
- Vacancy / Maint / Mgmt
- −$695
- Net cashflow
- $127
Break-even live
Sensitivity live
| Price | -10% $376 | -5% $251 | +0% $127 | +5% $3 | +10% $-122 |
|---|---|---|---|---|---|
| Rent | -10% $-134 | -5% $-4 | +0% $127 | +5% $258 | +10% $388 |
| Rate | -1.0pp $308 | -0.5pp $218 | base $127 | +0.5pp $34 | +1.0pp $-61 |
2-unit breakdown (identical units grouped — click to expand)
| Units | Beds | Baths | Est. rent |
|---|---|---|---|
| 2× units | 3 | 2 | $3,310 |
| #1 | 3 | 2 | $1,655 |
| #2 | 3 | 2 | $1,655 |
| Total (2 units) | $3,309 | ||
UW: 25.0% down · 7.5% · 30yr · 1.5% tax · 5.0% vac · 8.0% maint · 8.0% mgmt
Financing live
Cash to close
- Down payment
- $89,975
- Closing costs
- $10,797
- Reserves months
- —
- Total cash needed
- —
Loan-product check · same deal, 3 products live
Conventional
25% down · 7.5% · 30yr
- Down + closing
- —
- Monthly P&I
- —
- Monthly cashflow
- —
- DSCR
- —
- Eligible?
- —
Personal DTI + credit; lowest rate.
DSCR
20% down · 8.5% · 30yr
- Down + closing
- —
- Monthly P&I
- —
- Monthly cashflow
- —
- DSCR
- —
- Eligible?
- —
No personal income docs; deal must DSCR.
Hard money
10% down · 12.0% · 12mo
- Down + closing
- —
- Monthly P&I
- —
- Monthly cashflow
- —
- DSCR
- —
- Eligible?
- —
Short-term bridge; refi at stabilization.
Rent comps 1 comps
| Address | Beds | Baths | Sqft | Rent | $/sqft | DOM | Units | Dist |
|---|---|---|---|---|---|---|---|---|
| 220 Armstrong St Houston, TX | 5.0 | 2.0 | 1900 | $2,000 | $1.05 | 45d | 1 | 1.35mi |
Listing history 6 events
-
2026-03-19status Pending
-
2026-01-13$359,900 Active
-
2026-01-12historical
-
2025-10-17$369,900 Active
-
2025-09-02historical
-
2025-08-10$369,900 Active
ⓘ Source: listings_history table (triggers on properties + properties_extension) + one-shot
backfill from property_details.listing_events for pre-trigger history.
Climate risk First Street
- Flood 5/10 Major FEMA zone X (unshaded) · 67% chance over 30 yrs
- Wildfire 2/10 Low
- Heat 9/10 Extreme 7 d/yr ≥109°F today · 23 d/yr by 30 yrs out
- Wind 9/10 Extreme 99% chance of damaging wind over 30 yrs
- Air quality 3/10 Moderate 2 unhealthy d/yr today · 3 by 30 yrs out
Nearby sold comps map
Loading sold comps map…
Walkable amenities ~0.75 mi
Loading nearby amenities…
Taxation est. · year 1
- Rental income
- $39,708
- − Mortgage interest
- −$20,160
- − Property taxes
- −$5,398
- − Insurance
- −$1,800
- − Repairs & maintenance
- −$3,177
- − Management
- −$3,177
- − Depreciation
- −$10,470
- Taxable loss
- −$4,473
- Est. tax savings @ 24.0%
- +$1,074
- After-tax cash flow
- $2,597/yr
For passive investors: Depreciation is non-cash, so a rental often shows a tax loss while cash-flowing — sheltering income. Rental losses are passive: they offset passive income freely, and up to $25,000/yr can offset ordinary (W-2) income if you actively participate and your MAGI is under $100k (phasing out to $0 by $150k); unused losses carry forward. On sale, claimed depreciation is recaptured at up to 25%, and gains may owe capital-gains tax (a 1031 exchange can defer both). Figures are a year-1 estimate at your 24.0% rate — not tax advice; consult a CPA.
Schools (NCES district)
- District
- Galena Park ISD
- NCES district ID
- 4820250
- Math proficiency
- 32% ▼ -20.00%
- Reading proficiency
- 33% ▼ -7.00%
- Median HH income
- $43,158
- Composite
- 27.62/100
- National rank
- #6927
- State rank
- #578 of 826 in TX
Livability — Houston
- Score
- 74/100
- State rank
- #184
- US rank
- #4771
Category grades
Schools grade is shown separately in the Schools card above.
Census & demographics
- Census place
- Houston, TX
- County
- Harris County · 4,702,590 people
- City population
- 3,226,434
- Metro
- Houston-The Woodlands-Sugar Land, TX
- Population (ZIP)
- 16,154
- Household income
- $48,279
- Rent vs Own
- Severe rent burden
- 457.0
Population outlook (Harris County) Hauer SSP2
- Today (2025)
- 5,571,493 people
- By 2030
- 6,089,821 · +9.3%
- By 2040
- 7,142,806 · +28.2%
- By 2050
- 8,185,864 · +46.9%
- By 2075
- 10,574,329 · +89.8%
- By 2100
- 12,109,958 · +117.4%
Race, ethnicity, and origin ACS 2023
- Neighborhood character
- Predominantly Hispanic (72%)
- Race & ethnicity
- Hispanic / Latino 72% Two or more races 32% Black 22% White 5%
- Hispanic origin (detail)
- Mexican 66%
- Foreign-born
- 31% · Canada
- Languages at home
- 39% English-only · Spanish 61%
Political lean MEDSL · Harris
- 2024 margin
- Lean D (+5.5) · D 52.0% · R 46.4% · Other 1.6%
- 2008→2024 swing
- +3.9pp toward D · 2008: 1.6pp · 2024: 5.5pp
- All cycles
- 2024: D+5.5 2020: D+13.3 2016: D+12.4 2012: D+0.1 2008: D+1.6
Not yet ingested
- Civics
- —
Market trends
- HPI YoY
- ▲ 18.53%
- Current HPI
- 276.1811
- Rent YoY
- —
- Metro
- Houston-The Woodlands-Sugar Land, TX
- State GDP YoY
- ▲ 3.95%
- F500 in state
- 110
Industry mix (Fortune 500 HQ in TX)
| Industry | F500 HQs | Revenue |
|---|---|---|
| Energy | 16 | $1,198B |
|
||
| Technology | 5 | $198B |
|
||
| Engineering / Construction | 4 | $72B |
|
||
| Energy Services | 3 | $60B |
|
||
| Utilities | 3 | $41B |
|
||
| Healthcare | 2 | $330B |
|
||
Price history
-2.7% since first listed6 events — show timeline
- 2026-03-19 Pending — HARMLS
- 2026-01-13 Listed $359,900 HARMLS
- 2026-01-12 Listing Removed — HARMLS
- 2025-10-17 Listed $369,900 HARMLS
- 2025-09-02 Listing Removed — HARMLS
- 2025-08-10 Listed $369,900 HARMLS
Cash-flow waterfall
monthlySold comps — $/sqft
last 12 mo · ≤1 miLoading sold comps…