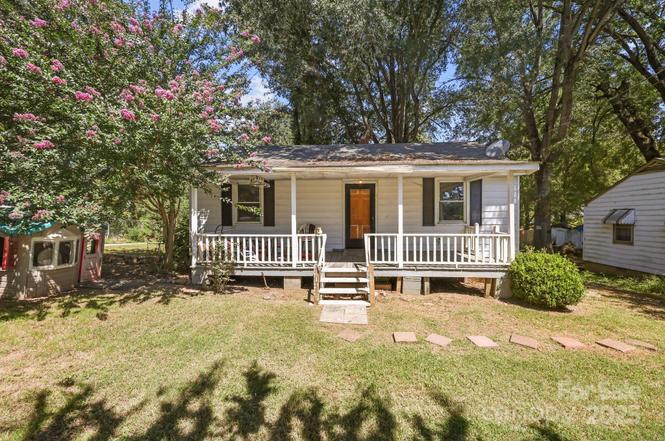
1530 Buffalo St · Enochville, NC
Flood risk 1/10 · Minimal
- FEMA flood zone
- X (unshaded)
- Chance of flooding over 30 yrs
- 0.0%
- Est. flood insurance / yr
- $507 – $1,088
Fire risk 3/10 · Minor
- Est. fire insurance / yr
- $906 – $1,684
Heat risk 6/10 · Moderate
- Hot days now (above 104°F)
- 7 days/yr
- Hot days in 30 yrs
- 17 days/yr
Wind risk 4/10 · Minor
- Chance of severe wind over 30 yrs
- 15.0%
Air-quality risk 2/10 · Minimal
- Unhealthy air days now
- 1 days/yr
- Unhealthy air days in 30 yrs
- 3 days/yr
Risk factors via First Street. Map © Google.
Why this score? — see what drove the B- grade
The composite is a weighted blend of 9 inputs, each scored 0–100. Each bar is that input's sub-score; the figure is the points it added to the 100-point composite (weight × sub-score).
- Cash flow +30.0/30.0
- 1% rule +10.0/10.0
- DSCR +10.0/10.0
- ARV discount +7.5/15.0
- Rent growth +3.1/5.0
- Livability +3.0/5.0
- Schools +2.6/10.0
- Condition / age +2.5/5.0
- Appreciation +0.0/10.0
$84,999
🖨 Deal sheet (PDF) 📄 Offer letter ✓ Due diligence
Listing remarks
* * * CURRENT BID IS $75,000, FILE NO. 25SP000231-790, UPSET BID PERIOD ENDS 6/22 AT 4:30 * * * This 2 bedroom, 1 bath home in growing Kannapolis is full of potential and priced well-an excellent opportunity for investors or handy homeowners to build equity fast. Situated on a corner lot outside the city limits, this home has hardwood floors that would gleam again with some TLC. The home also features a spacious kitchen, unfinished add on, and a charming front covered porch-perfect for your favorite rocking chairs. Outside, you'll find multiple storage sheds and a detached garage. Please note that this is a judicial sale. If you're unfamiliar with the process, your agent will be happy
Key facts
- Front covered porch
- Spacious kitchen
- Corner lot
Tags
Property features AI
Finance
- HOA & community: No HOA
Exterior
- Parking: Detached 1-car garage; Driveway
- Utilities: City water; Septic installed; Electricity connected
- Home design: Single-family residence; One story; Site built; RM2 zoning
- Construction: Vinyl exterior; Crawl space foundation; Shallow building footprint (one level)
- Exterior features: Covered front and rear porches; Corner lot; Roads are gravel and paved; publicly maintained
Interior
- Kitchen: Electric oven; Electric range; Refrigerator
- Bedrooms: 2 bedrooms (both on the main level)
- Flooring: Vinyl flooring; Wood flooring
- Bathrooms: 1 full bathroom (main level)
- Heating & cooling: Baseboard heating; Window AC unit(s)
- Interior features: Two or more access exits; Room count: 1
- Laundry & utility: Washer; Dryer; Laundry located in the kitchen
Neighborhood map
What this means for you Summary
Snapshot
- This is a 2-bed/1.0-bath single-family listed at $85k.
Deal economics
- At list price, monthly cash flow is $707 ($8k/yr) — positive.
- The deal already cash-flows at list — no discount required.
- Meets the 1% rule at list price ($2k rent vs $85k).
- Recommended offer: $75k (12.0% below list) — sets the bar for market timing.
- Cap rate 16.3% vs local median 3.0% in Enochville — top-decile yield for the area; either an underpriced asset or a hidden risk that comps aren't pricing in. Stress-test before assuming the spread holds.
Location & tenants
- Location reads 60/100 on livability (#506 in NC) — a middle-class / working-renter tenant base. Strengths: cost of living A+, housing A+, crime B+; Watch: schools F, amenities F, commute F.
- Rowan-Salisbury Schools (rural): math 26% / reading 35% proficiency, ranked #142 of 178 in NC (top 80%) — families likely to look elsewhere, expect single-tenant / working-renter base with shorter leases.
- Market conditions: Rents rising (+2.5%/yr); 225 active listings in the ZIP; 4 comparable units currently listed for rent nearby; rentals at typical pace (median 25d on market — plan ~3-4 weeks tenant-placement turnaround); 592 units permitted in Rowan County in 2024 (5 in 5+ unit buildings).
Forward outlook
- Local home prices are declining (-3.0%/yr); year-one equity from $587 of loan paydown is wiped out by about $3k of value loss. Plan a longer hold.
- Rowan County population projected to shrink 6% by 2050 — rents likely to lag national; underwrite the cash flow, not the appreciation.
- At projected returns (-3.0% appreciation + 2.5% rent growth), your $24k cash investment doubles in ~4 years — after that, you're playing with house money.
Negotiation context
- It's been on market 284 days — a 12% lower offer ($75k) is reasonable based on typical stale-listing flexibility.
- Current owner paid $55k; list at $85k implies a 55% gain — meaningful room to come down on a strong offer.
Risks & watch-outs
- Watch-outs: built in 1952 — expect roof / HVAC / electrical / plumbing capex.
- Climate carrying-cost: extreme-heat days projected 7→17/yr by 2055 (HVAC capex compounding) — expect insurance premiums to compound above CPI over the hold.
Questions for the listing agent
- It's been on market 284 days. Have you received any prior offers? Is the seller open to a 12% concession, seller financing, or rate buy-down credit?
- Built in 1952 — when were the roof, HVAC, electrical panel, plumbing, and water heater last replaced?
- Why hasn't it sold? Are there any deal-killer items the seller is aware of (foundation, flood, title, zoning, code violations)?
- Is there a deadline driving the sale (1031 exchange, divorce, estate, relocation)? That informs how much negotiation room exists.
- Schools are F-rated, which usually means shorter tenancies and higher turnover. Who's the typical renter profile here, and what's been the actual vacancy rate?
- What's the average days-on-market for RENTAL listings here right now (not sales)? A rising rental-DOM trend means longer vacancies and softer asking-rent achievability than the comps imply.
- What's the recent tenant-quality profile in this submarket — average credit score on applications, eviction rate, late-payment / NSF rate, and stable-employment percentage? A property-management company in the area should have these aggregated.
- How much new for-sale + rental construction is in the pipeline within 1–3 miles? Heavy new supply typically softens prices + rents 12–24 months out; constrained supply supports both.
Investment metrics
- 1% rule
- 1.84% ✓
- Cap rate
- 16.27%
- Cash-on-cash
- 35.64%
- DSCR
- 2.59
- GRM
- 4.5
CMA / ARV
- ARV (on-the-fly)
- $201,096
- Comps found
- 12
Show comp detail 12 sales within ~0.75 mi
| Address | Dist | Beds/Ba | Sqft | Sold | Price | $/sf | Match |
|---|---|---|---|---|---|---|---|
| 131 Westover Ave | 0.36mi | 2/1.0 | 867 (-2%) | 18mo | $198,000 | $228 | 65 |
| 112 Mccray Ave | 0.56mi | 2/1.0 | 850 (-4%) | 12mo | $244,900 | $288 | 58 |
| 1114 Mountain St | 0.72mi | 2/1.0 | 908 (+3%) | 10mo | $245,000 | $270 | 53 |
| 116 Dexter Ave | 0.45mi | 2/1.0 | 925 (+5%) | 22mo | $215,000 | $232 | 52 |
| 108 Franklin Ave | 0.41mi | 2/1.0 | 971 (+10%) | 14mo | $145,000 | $149 | 52 |
| 300 Gurley St | 0.70mi | 2/1.0 | 950 (+8%) | 10mo | $155,000 | $163 | 46 |
| 1407 Birch St | 0.74mi | 2/1.0 | 832 (-6%) | 12mo | $85,000 | $102 | 46 |
| 1411 Due West St | 0.48mi | 3/1.0 (+1) | 935 (+6%) | 21mo | $208,000 | $222 | 45 |
| 1006 Callie St | 0.67mi | 2/1.0 | 993 (+13%) | 4mo | $225,000 | $227 | 44 |
| 403 Westover Ave | 0.75mi | 2/1.0 | 852 (-3%) | 22mo | $217,000 | $255 | 41 |
| 211 Franklin Ave | 0.66mi | 1/1.0 (-1) | 750 (-15%) | 1mo | $172,000 | $229 | 39 |
| 1814 W C St | 0.47mi | 1/1.0 (-1) | 992 (+12%) | 18mo | $85,000 | $86 | 37 |
Match score weights: distance 35% · size 25% · config 20% · recency 20%. Top-matched comps best support the ARV.
Projected returns pro-forma
-3.0% appreciation · 2.5% rent growth · sell at horizon
- IRR
- 30.7%
- Equity multiple
- 2.28×
- Total profit
- $30,453
- Equity at exit
- $12,674
- IRR
- 37.7%
- Equity multiple
- 4.41×
- Total profit
- $81,260
- Equity at exit
- $7,349
Cash invested: $23,800 (down + closing). Projections, not guarantees.
Landlord ↔ Tenant lean methodology
- Overall (STATE)
- 85 Strongly Landlord-Friendly
- State North Carolina
- 85 Strongly Landlord-Friendly · R+3
- County
- — inherits STATE
- City
- — inherits STATE
ZIP-level market 28081
- Rents YoY
- 2.5%
- Active inventory
- 225
- Price-to-rent
- 4.5×
Monthly cashflow live
- Estimated rent
- $1,568 medium interval (Pro) →
- Mortgage (P&I)
- −$446
- Tax from tax record
- −$51 /mo · $609/yr
- Insurance
- −$35
- HOA
- −$0
- Vacancy / Maint / Mgmt
- −$329
- Net cashflow
- $707
Break-even live
Sensitivity live
| Price | -10% $755 | -5% $731 | +0% $707 | +5% $683 | +10% $659 |
|---|---|---|---|---|---|
| Rent | -10% $583 | -5% $645 | +0% $707 | +5% $769 | +10% $831 |
| Rate | -1.0pp $750 | -0.5pp $729 | base $707 | +0.5pp $685 | +1.0pp $662 |
UW: 25.0% down · 7.5% · 30yr · 1.5% tax · 5.0% vac · 8.0% maint · 8.0% mgmt
Financing live
Cash to close
- Down payment
- $21,250
- Closing costs
- $2,550
- Reserves months
- —
- Total cash needed
- —
Loan-product check · same deal, 3 products live
Conventional
25% down · 7.5% · 30yr
- Down + closing
- —
- Monthly P&I
- —
- Monthly cashflow
- —
- DSCR
- —
- Eligible?
- —
Personal DTI + credit; lowest rate.
DSCR
20% down · 8.5% · 30yr
- Down + closing
- —
- Monthly P&I
- —
- Monthly cashflow
- —
- DSCR
- —
- Eligible?
- —
No personal income docs; deal must DSCR.
Hard money
10% down · 12.0% · 12mo
- Down + closing
- —
- Monthly P&I
- —
- Monthly cashflow
- —
- DSCR
- —
- Eligible?
- —
Short-term bridge; refi at stabilization.
Rent comps 4 comps
| Address | Beds | Baths | Sqft | Rent | $/sqft | DOM | Units | Dist |
|---|---|---|---|---|---|---|---|---|
| 200 Franklin Ave Unit 200 Kannapolis, NC | 2.0 | 1.5 | 1024 | $1,500 | $1.46 | 21d | 1 | 0.56mi |
| 4301 Forestridge Ln Kannapolis, NC | 1.0–2.0 | 1.0–2.0 | 797 | $1,450 | $1.82 | 25d | 1 | 0.60mi |
| 515 Broad St Kannapolis, NC | 2.0 | 1.0 | 800 | $1,250 | $1.56 | 25d | 1 | 1.42mi |
| 210 S Main St Kannapolis, NC | 3.0 | 1.0–2.0 | 914 | $2,203 | $2.41 | 2d | 21 | 1.49mi |
Listing history 16 events
-
2026-06-21days on market $84,999 Active 284 DOM
-
2026-06-18days on market $84,999 Active 281 DOM
-
2026-06-17days on market $84,999 Active 280 DOM
-
2026-06-16days on market $84,999 Active 279 DOM
-
2026-06-15days on market $84,999 Active 278 DOM
-
2026-06-13days on market $84,999 Active 276 DOM
-
2026-06-10days on market $84,999 Active 272 DOM
-
2026-06-08pricedays on market $84,999 Active 271 DOM
-
2026-06-07days on market $99,000 Active 270 DOM
-
2026-06-04days on market $99,000 Active 267 DOM
-
2026-06-03days on market $99,000 Active 266 DOM
-
2026-06-02days on market $99,000 Active 265 DOM
-
2026-06-01days on market $99,000 Active 264 DOM
-
2026-05-31days on market $99,000 Active 263 DOM
-
2025-09-11$99,000 Active
-
2011-05-26soldstatus $55,000
ⓘ Source: listings_history table (triggers on properties + properties_extension) + one-shot
backfill from property_details.listing_events for pre-trigger history.
Tax reassessment forecast NC · Resets to sale price
- Current annual tax
- $609 · $51/mo
- Projected year-2 tax
- $697 · $58/mo
- Expected delta
- +$88/yr (+$7/mo · 14.4%)
ⓘ Screening estimate from a state-policy table — verify with the county assessor before closing.
Climate risk First Street
- Flood 1/10 Low FEMA zone X (unshaded) · 0% chance over 30 yrs
- Wildfire 3/10 Moderate
- Heat 6/10 Major 7 d/yr ≥104°F today · 17 d/yr by 30 yrs out
- Wind 4/10 Moderate 15% chance of damaging wind over 30 yrs
- Air quality 2/10 Low 1 unhealthy d/yr today · 3 by 30 yrs out
Nearby sold comps map
Loading sold comps map…
Walkable amenities ~0.75 mi
Loading nearby amenities…
Taxation est. · year 1
- Rental income
- $18,818
- − Mortgage interest
- −$4,761
- − Property taxes
- −$609
- − Insurance
- −$425
- − Repairs & maintenance
- −$1,505
- − Management
- −$1,505
- − Depreciation
- −$2,473
- Taxable income
- $7,538
- Est. tax owed @ 24.0%
- −$1,809
- After-tax cash flow
- $6,673/yr
For passive investors: Depreciation is non-cash, so a rental often shows a tax loss while cash-flowing — sheltering income. Rental losses are passive: they offset passive income freely, and up to $25,000/yr can offset ordinary (W-2) income if you actively participate and your MAGI is under $100k (phasing out to $0 by $150k); unused losses carry forward. On sale, claimed depreciation is recaptured at up to 25%, and gains may owe capital-gains tax (a 1031 exchange can defer both). Figures are a year-1 estimate at your 24.0% rate — not tax advice; consult a CPA.
Schools (NCES district)
- District
- Rowan-Salisbury Schools
- NCES district ID
- 3704050
- Math proficiency
- 26% ▲ 2.00%
- Reading proficiency
- 35% ▲ 1.00%
- Median HH income
- $43,953
- Composite
- 26.01/100
- National rank
- #7317
- State rank
- #142 of 178 in NC
Livability — Enochville
- Score
- 60/100
- State rank
- #506
- US rank
- #18525
Category grades
Schools grade is shown separately in the Schools card above.
Census & demographics
- Census place
- Enochville, NC
- County
- Cabarrus County · 218,793 people
- Metro
- Charlotte-Concord-Gastonia, NC-SC
- Population (ZIP)
- 29,075
- Household income
- $71,665
- Rent vs Own
- Severe rent burden
- 763.0
Population outlook (Rowan County) Hauer SSP2
- Today (2025)
- 140,430 people
- By 2030
- 140,193 · -0.2%
- By 2040
- 137,617 · -2.0%
- By 2050
- 131,826 · -6.1%
- By 2075
- 115,123 · -18.0%
- By 2100
- 92,774 · -33.9%
Race, ethnicity, and origin ACS 2023
- Neighborhood character
- Majority White (65%)
- Race & ethnicity
- White 65% Black 18% Hispanic / Latino 12% Two or more races 6% Asian 1%
- Hispanic origin (detail)
- Mexican 6%
- Common ancestry
- Slovak 2% Italian 1% Serbian 1%
- Foreign-born
- 8% · Canada, China
- Languages at home
- 88% English-only · Spanish 10% French/Haitian/Cajun 1% Chinese 1%
Political lean MEDSL · Rowan
- 2024 margin
- Solid R (+35.9) · D 31.6% · R 67.5%
- 2008→2024 swing
- -13.1pp toward R · 2008: -22.8pp · 2024: -35.9pp
- All cycles
- 2024: R+35.9 2020: R+35.7 2016: R+36.8 2012: R+26.0 2008: R+22.8
Not yet ingested
- Civics
- —
Market trends
- HPI YoY
- ▼ -202.75%
- Current HPI
- 282.9002
- Rent YoY
- ▲ 2.50%
- Metro
- Charlotte-Concord-Gastonia, NC-SC
- State GDP YoY
- ▲ 3.28%
- F500 in state
- 26
Industry mix (Fortune 500 HQ in NC)
| Industry | F500 HQs | Revenue |
|---|---|---|
| Financial Services | 2 | $213B |
|
||
| Retail | 2 | $95B |
|
||
| Industrial Conglomerate | 1 | $38B |
|
||
| Metals / Steel | 1 | $35B |
|
||
| Utilities | 1 | $30B |
|
||
| Industrial Machinery | 1 | $19B |
|
||
Price history
+80.0% since first listed2 events — show timeline
- 2025-09-11 Listed $99,000 CANOPYMLS as Distributed by MLS Grid
- 2011-05-26 Sold (Public Records) $55,000 Public Records
Property tax history
+4.1%/yrLatest (2025): $609 · +0.0% YoY. Source: county tax records.
Cash-flow waterfall
monthlySold comps — $/sqft
last 12 mo · ≤1 miLoading sold comps…