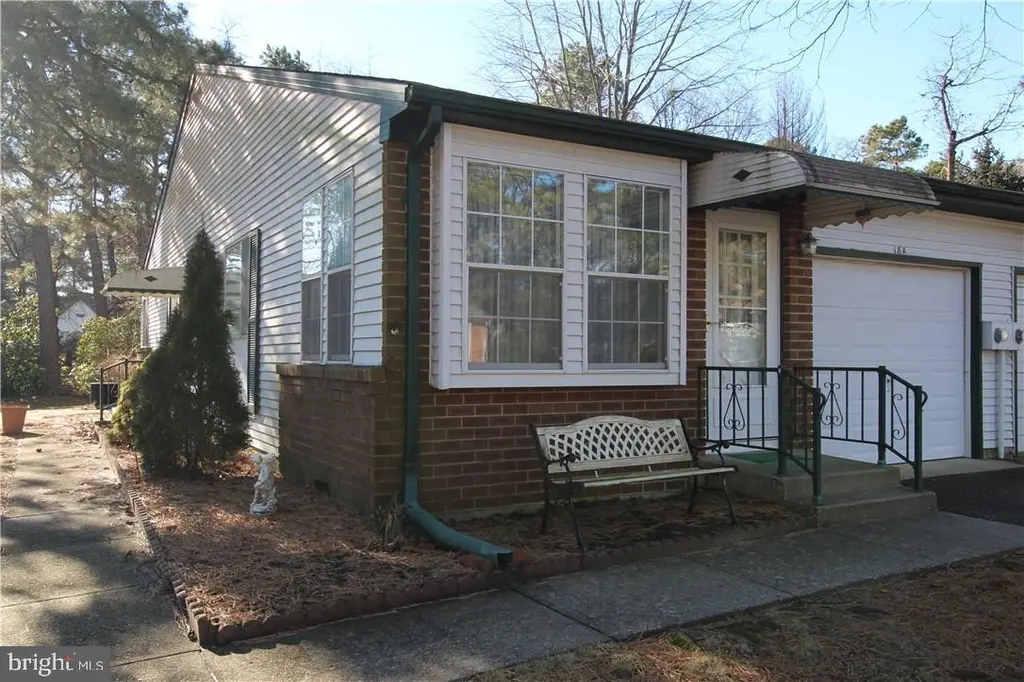
18A Sunset Rd · Crestwood Village, NJ
Flood risk 1/10 · Minimal
- FEMA flood zone
- X (unshaded)
- Chance of flooding over 30 yrs
- 0.0%
- Est. flood insurance / yr
- $507 – $1,088
Fire risk 4/10 · Minor
- Est. fire insurance / yr
- $526 – $976
Heat risk 6/10 · Moderate
- Hot days now (above 103°F)
- 7 days/yr
- Hot days in 30 yrs
- 14 days/yr
Wind risk 6/10 · Moderate
- Chance of severe wind over 30 yrs
- 64.0%
Air-quality risk 4/10 · Minor
- Unhealthy air days now
- 4 days/yr
- Unhealthy air days in 30 yrs
- 5 days/yr
Risk factors via First Street. Map © Google.
Why this score? — see what drove the B- grade
The composite is a weighted blend of 9 inputs, each scored 0–100. Each bar is that input's sub-score; the figure is the points it added to the 100-point composite (weight × sub-score).
- Cash flow +30.0/30.0
- 1% rule +10.0/10.0
- DSCR +10.0/10.0
- ARV discount +7.5/15.0
- Livability +3.2/5.0
- Schools +2.9/10.0
- Rent growth +2.5/5.0
- Condition / age +2.5/5.0
- Appreciation +0.0/10.0
$83,900
🖨 Deal sheet (PDF) 📄 Offer letter ✓ Due diligence
Listing remarks MLS
RT. 530 LFT SCHOOLHOUSE RD RT ONTO PENWOOD LFT ONTO SUNSET RD. SHEFFIELD WITH 1 1/2 BATHS C/A NEW GARAGE DOOR S/CW UPGRADED CARPET AND VINYL OPEN PATIO SOME STORMS
Key facts
- $145 HOA
- Garage
- Built 1977
Neighborhood map
What this means for you Summary
Snapshot
- This is a 2-bed/1.5-bath townhouse listed at $84k.
Deal economics
- At list price, monthly cash flow is $895 ($11k/yr) — positive.
- The deal already cash-flows at list — no discount required.
- Meets the 1% rule at list price ($2k rent vs $84k).
- Recommended offer: $81k (3.0% below list) — sets the bar for market timing.
- Cap rate 19.1% vs local median 5.5% in Crestwood Village — top-decile yield for the area; either an underpriced asset or a hidden risk that comps aren't pricing in. Stress-test before assuming the spread holds.
Location & tenants
- Location reads 63/100 on livability (#422 in NJ) — a middle-class / working-renter tenant base. Strengths: cost of living A, housing A, health & safety B+; Watch: schools F, amenities F, commute F.
- Manchester Township School District (suburban): math 25% / reading 44% proficiency, ranked #320 of 472 in NJ (top 68%) — families likely to look elsewhere, expect single-tenant / working-renter base with shorter leases.
- Market conditions: 658 active listings in the ZIP; 5 comparable units currently listed for rent nearby; rentals at typical pace (median 26d on market — plan ~3-4 weeks tenant-placement turnaround); 40% of comp listings sitting > 30 days — soft ceiling on asking rent; 4,434 units permitted in Ocean County in 2024 (868 in 5+ unit buildings).
Forward outlook
- Local home prices are declining (-3.0%/yr); year-one equity from $580 of loan paydown is wiped out by about $3k of value loss. Plan a longer hold.
- Ocean County population projected to shrink 8% by 2050 — rents likely to lag national; underwrite the cash flow, not the appreciation.
- At projected returns (-3.0% appreciation + 3.0% rent growth), your $23k cash investment doubles in ~3 years — after that, you're playing with house money.
Negotiation context
- It's been on market 32 days — a 3% lower offer ($81k) is reasonable based on typical stale-listing flexibility.
- 2 sale attempts since 29y ago with the ask held roughly flat each time — persistent listings suggest the price (not the market) is what's stuck; bring a comps-based counter.
- Current owner paid $55k; list at $84k implies a 53% gain — meaningful room to come down on a strong offer.
Risks & watch-outs
- Climate carrying-cost: major wind risk, 64% chance of damaging wind over 30y; extreme-heat days projected 7→14/yr by 2055 (HVAC capex compounding) — expect insurance premiums to compound above CPI over the hold.
Questions for the listing agent
- It's been on market 32 days. Have you received any prior offers? Is the seller open to a 3% concession, seller financing, or rate buy-down credit?
- Built in 1977 — when were the roof, HVAC, electrical panel, plumbing, and water heater last replaced?
- What does the HOA fee cover, when was the last increase, and are there any pending special assessments or reserve-fund shortfalls?
- Is there a deadline driving the sale (1031 exchange, divorce, estate, relocation)? That informs how much negotiation room exists.
- Schools are F-rated, which usually means shorter tenancies and higher turnover. Who's the typical renter profile here, and what's been the actual vacancy rate?
- What's the average days-on-market for RENTAL listings here right now (not sales)? A rising rental-DOM trend means longer vacancies and softer asking-rent achievability than the comps imply.
- What's the recent tenant-quality profile in this submarket — average credit score on applications, eviction rate, late-payment / NSF rate, and stable-employment percentage? A property-management company in the area should have these aggregated.
- How much new for-sale + rental construction is in the pipeline within 1–3 miles? Heavy new supply typically softens prices + rents 12–24 months out; constrained supply supports both.
Investment metrics
- 1% rule
- 2.44% ✓
- Cap rate
- 19.10%
- Cash-on-cash
- 45.74%
- DSCR
- 3.04
- GRM
- 3.4
CMA / ARV
- ARV (on-the-fly)
- $205,905
- Comps found
- 5
Show comp detail 5 sales within ~0.75 mi
| Address | Dist | Beds/Ba | Sqft | Sold | Price | $/sf | Match |
|---|---|---|---|---|---|---|---|
| 12 A Sunset Rd | 0.07mi | 2/1.5 | 1,216 (+9%) | 0mo | $225,000 | $185 | 81 |
| 5 Stonybrook Ct Unit A | 0.44mi | 2/1.5 | 1,080 (-3%) | 10mo | $230,000 | $213 | 66 |
| 53-B Sunset Rd | 0.43mi | 2/1.0 | 1,113 (0%) | 20mo | $225,000 | $202 | 61 |
| 10-B Lenape Dr Unit B | 0.59mi | 2/1.0 | 1,216 (+9%) | 2mo | $112,000 | $92 | 53 |
| 3 Ironside Unit B | 0.72mi | 2/1.0 | 1,216 (+9%) | 9mo | $99,000 | $81 | 41 |
Match score weights: distance 35% · size 25% · config 20% · recency 20%. Top-matched comps best support the ARV.
Projected returns pro-forma
-3.0% appreciation · 3.0% rent growth · sell at horizon
- IRR
- 43.0%
- Equity multiple
- 2.85×
- Total profit
- $43,554
- Equity at exit
- $12,510
- IRR
- 49.1%
- Equity multiple
- 5.76×
- Total profit
- $111,849
- Equity at exit
- $7,254
Cash invested: $23,492 (down + closing). Projections, not guarantees.
Landlord ↔ Tenant lean methodology
- Overall (STATE)
- 21 Tenant-Leaning
- State New Jersey
- 21 Tenant-Leaning · D+6
- County
- — inherits STATE
- City
- — inherits STATE
ZIP-level market 08759
- Active inventory
- 658
- Price-to-rent
- 3.4×
Monthly cashflow live
- Estimated rent
- $2,051 high interval (Pro) →
- Mortgage (P&I)
- −$440
- Tax est. 1.5%
- −$105 /mo · $1,258/yr
- Insurance
- −$35
- HOA
- −$145
- Vacancy / Maint / Mgmt
- −$431
- Net cashflow
- $895
Break-even live
Sensitivity live
| Price | -10% $953 | -5% $924 | +0% $895 | +5% $866 | +10% $837 |
|---|---|---|---|---|---|
| Rent | -10% $733 | -5% $814 | +0% $895 | +5% $976 | +10% $1,057 |
| Rate | -1.0pp $938 | -0.5pp $917 | base $895 | +0.5pp $874 | +1.0pp $852 |
UW: 25.0% down · 7.5% · 30yr · 1.5% tax · 5.0% vac · 8.0% maint · 8.0% mgmt
Financing live
Cash to close
- Down payment
- $20,975
- Closing costs
- $2,517
- Reserves months
- —
- Total cash needed
- —
Loan-product check · same deal, 3 products live
Conventional
25% down · 7.5% · 30yr
- Down + closing
- —
- Monthly P&I
- —
- Monthly cashflow
- —
- DSCR
- —
- Eligible?
- —
Personal DTI + credit; lowest rate.
DSCR
20% down · 8.5% · 30yr
- Down + closing
- —
- Monthly P&I
- —
- Monthly cashflow
- —
- DSCR
- —
- Eligible?
- —
No personal income docs; deal must DSCR.
Hard money
10% down · 12.0% · 12mo
- Down + closing
- —
- Monthly P&I
- —
- Monthly cashflow
- —
- DSCR
- —
- Eligible?
- —
Short-term bridge; refi at stabilization.
Rent comps 5 comps
| Address | Beds | Baths | Sqft | Rent | $/sqft | DOM | Units | Dist |
|---|---|---|---|---|---|---|---|---|
| 19B Maplewood Dr #52 Whiting, NJ | 2.0 | 1.5 | 1109 | $2,250 | $2.03 | 17d | 1 | 0.20mi |
| 57D Milford Ave Unit 53 Whiting, NJ | 2.0 | 1.0 | 880 | $1,800 | $2.05 | 25d | 1 | 0.21mi |
| 9A Juniper Ln Unit 50 Whiting, NJ | 1.0 | 1.0 | 1009 | $1,950 | $1.93 | 44d | 1 | 0.63mi |
| 49 Westport Dr #71 Whiting, NJ | 2.0 | 1.5 | 1192 | $1,995 | $1.67 | 44d | 1 | 1.32mi |
| 50 Westport Dr #71 Whiting, NJ | 2.0 | 1.0 | 1120 | $2,200 | $1.96 | 0d | 1 | 1.33mi |
HOA detail
- Monthly dues
- $145 · $1,740/yr
Listing history 8 events
-
2019-09-13status Pending
-
2019-09-11historical
-
2019-09-11status Pending
-
2019-02-15status Under Contract
-
2019-01-14$83,900 Active
-
1997-03-25soldstatus $55,000 163-char remark
Show marketing remark (163 chars)
RT. 530 LFT SCHOOLHOUSE RD RT ONTO PENWOOD LFT ONTO SUNSET RD. SHEFFIELD WITH 1 1/2 BATHS C/A NEW GARAGE DOOR S/CW UPGRADED CARPET AND VINYL OPEN PATIO SOME STORMS
-
1997-01-06historical 163-char remark
Show marketing remark (163 chars)
RT. 530 LFT SCHOOLHOUSE RD RT ONTO PENWOOD LFT ONTO SUNSET RD. SHEFFIELD WITH 1 1/2 BATHS C/A NEW GARAGE DOOR S/CW UPGRADED CARPET AND VINYL OPEN PATIO SOME STORMS
-
1997-01-02$55,500 163-char remark
Show marketing remark (163 chars)
RT. 530 LFT SCHOOLHOUSE RD RT ONTO PENWOOD LFT ONTO SUNSET RD. SHEFFIELD WITH 1 1/2 BATHS C/A NEW GARAGE DOOR S/CW UPGRADED CARPET AND VINYL OPEN PATIO SOME STORMS
ⓘ Source: listings_history table (triggers on properties + properties_extension) + one-shot
backfill from property_details.listing_events for pre-trigger history.
Climate risk First Street
- Flood 1/10 Low FEMA zone X (unshaded) · 0% chance over 30 yrs
- Wildfire 4/10 Moderate
- Heat 6/10 Major 7 d/yr ≥103°F today · 14 d/yr by 30 yrs out
- Wind 6/10 Major 64% chance of damaging wind over 30 yrs
- Air quality 4/10 Moderate 4 unhealthy d/yr today · 5 by 30 yrs out
Nearby sold comps map
Loading sold comps map…
Walkable amenities ~0.75 mi
Loading nearby amenities…
Taxation est. · year 1
- Rental income
- $24,611
- − Mortgage interest
- −$4,700
- − Property taxes
- −$1,258
- − Insurance
- −$420
- − Repairs & maintenance
- −$1,969
- − Management
- −$1,969
- − HOA
- −$1,740
- − Depreciation
- −$2,441
- Taxable income
- $10,115
- Est. tax owed @ 24.0%
- −$2,428
- After-tax cash flow
- $8,317/yr
For passive investors: Depreciation is non-cash, so a rental often shows a tax loss while cash-flowing — sheltering income. Rental losses are passive: they offset passive income freely, and up to $25,000/yr can offset ordinary (W-2) income if you actively participate and your MAGI is under $100k (phasing out to $0 by $150k); unused losses carry forward. On sale, claimed depreciation is recaptured at up to 25%, and gains may owe capital-gains tax (a 1031 exchange can defer both). Figures are a year-1 estimate at your 24.0% rate — not tax advice; consult a CPA.
Schools (NCES district)
- District
- Manchester Township School District
- NCES district ID
- 3409450
- Math proficiency
- 25% ▼ -17.00%
- Reading proficiency
- 44% ▼ -5.00%
- Median HH income
- $38,905
- Composite
- 28.8/100
- National rank
- #6662
- State rank
- #320 of 472 in NJ
Livability — Crestwood Village
- Score
- 63/100
- State rank
- #422
- US rank
- #15006
Category grades
Schools grade is shown separately in the Schools card above.
Census & demographics
- Census place
- Crestwood Village, NJ
- City population
- 34,290
- Population (ZIP)
- 34,290
Population outlook (Ocean County) Hauer SSP2
- Today (2025)
- 586,991 people
- By 2030
- 581,403 · -1.0%
- By 2040
- 564,913 · -3.8%
- By 2050
- 538,149 · -8.3%
- By 2075
- 468,845 · -20.1%
- By 2100
- 350,297 · -40.3%
Race, ethnicity, and origin ACS 2023
- Neighborhood character
- Predominantly White (87%)
- Race & ethnicity
- White 87% Hispanic / Latino 5% Black 4% Two or more races 4% Asian 2%
- Hispanic origin (detail)
- Puerto Rican 2%
- Common ancestry
- Romanian 8% Scotch-Irish 2% Lithuanian 2%
- Foreign-born
- 11% · Canada, China
- Languages at home
- 88% English-only · Spanish 3% Russian/Polish/Slavic 2% Other Indo-European 2%
Political lean MEDSL · Ocean
- 2024 margin
- Solid R (+36.0) · D 31.4% · R 67.4% · Other 1.2%
- 2008→2024 swing
- -17.6pp toward R · 2008: -18.4pp · 2024: -36.0pp
- All cycles
- 2024: R+36.0 2020: R+28.7 2016: R+34.0 2012: R+17.7 2008: R+18.4
Not yet ingested
- Civics
- —
Market trends
- HPI YoY
- ▼ -347.85%
- Current HPI
- 274.4679
- Rent YoY
- —
- Metro
- —
- State GDP YoY
- ▲ 2.05%
- F500 in state
- 34
Industry mix (Fortune 500 HQ in NJ)
| Industry | F500 HQs | Revenue |
|---|---|---|
| Consumer Goods | 3 | $31B |
|
||
| Pharmaceuticals | 2 | $153B |
|
||
| Technology | 2 | $21B |
|
||
| Insurance | 2 | $20B |
|
||
| Healthcare | 2 | $19B |
|
||
| Financial Services | 1 | $70B |
|
||
Price history
+51.2% since first listed8 events — show timeline
- 2019-09-13 Pending — BRIGHT MLS
- 2019-09-11 Listing Removed — BRIGHT MLS
- 2019-09-11 Pending — BRIGHT MLS
- 2019-02-15 Pending — BRIGHT MLS
- 2019-01-14 Listed $83,900 BRIGHT MLS
- 1997-03-25 Sold (MLS) $55,000 MOMLS
- 1997-01-06 Delisted — MOMLS
- 1997-01-02 Listed $55,500 MOMLS
Cash-flow waterfall
monthlySold comps — $/sqft
last 12 mo · ≤1 miLoading sold comps…