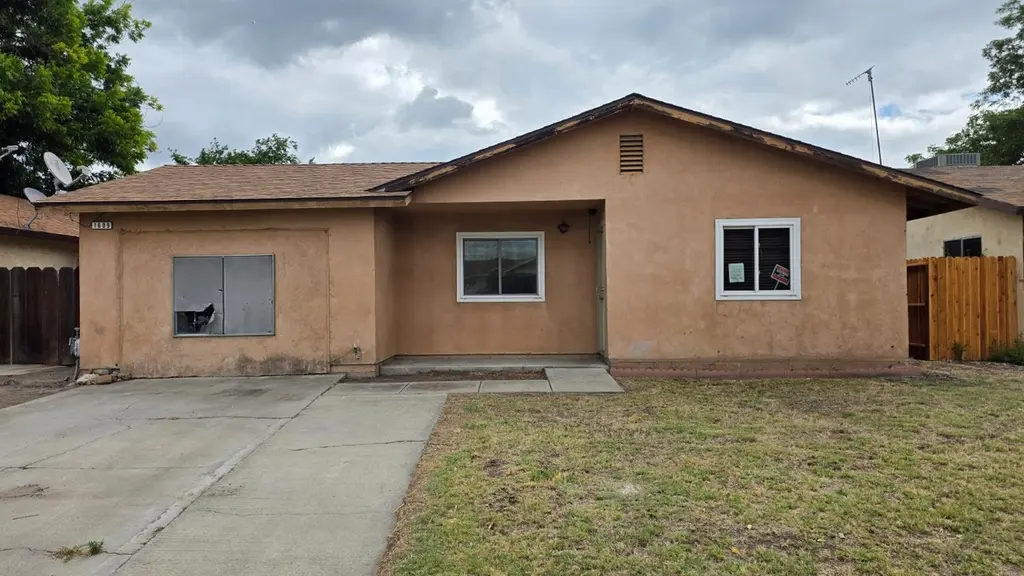
1609 Kathy · Dos Palos, CA
Flood risk 5/10 · Moderate
- FEMA flood zone
- X (unshaded)
- Chance of flooding over 30 yrs
- 0.47%
- Est. flood insurance / yr
- $507 – $1,088
Fire risk 4/10 · Minor
- Est. fire insurance / yr
- $659 – $1,223
Heat risk 7/10 · Major
- Hot days now (above 103°F)
- 7 days/yr
- Hot days in 30 yrs
- 16 days/yr
Wind risk 1/10 · Minimal
- Chance of severe wind over 30 yrs
- —
Air-quality risk 10/10 · Severe
- Unhealthy air days now
- 26 days/yr
- Unhealthy air days in 30 yrs
- 27 days/yr
Risk factors via First Street. Map © Google.
Why this score? — see what drove the D+ grade
The composite is a weighted blend of 9 inputs, each scored 0–100. Each bar is that input's sub-score; the figure is the points it added to the 100-point composite (weight × sub-score).
- ARV discount +15.0/15.0
- Cash flow +14.9/30.0
- DSCR +4.6/10.0
- 1% rule +3.7/10.0
- Livability +2.7/5.0
- Rent growth +2.5/5.0
- Condition / age +2.5/5.0
- Schools +1.5/10.0
- Appreciation +0.0/10.0
$259,900
🖨 Deal sheet 📄 Offer letter ✓ Due diligence
Listing remarks
Another Hot Deal! Dos Palos investment opportunity: a hard-to-find 1,405 sq ft home with 4 bedrooms. The property needs repairs, presenting a strong value-add project for a cash buyer. Highlights include a 4 bedrooms, large backyard and an indoor laundry room. This is an investor special, with the seller prioritizing cash buyers and a quick close.
Key facts
- Large backyard
- Indoor laundry room
- 6,738 sq ft lot
Tags
Property features AI
Exterior
- Utilities: Public utilities; Electric service currently off
- Home design: Single-family residence; One level
- Construction: Stucco exterior; Composition roof; Concrete foundation; No solar
- Exterior features: Rural setting
Interior
- Bathrooms: 2 bathrooms
- Heating & cooling: Central heat and central air conditioning; Home has heating; Home has cooling
- Interior features: Inside laundry
- Laundry & utility: Laundry located inside
Neighborhood map
What this means for you Summary
Snapshot
- This is a 4-bed/2.0-bath single-family listed at $260k.
Deal economics
- At list price, monthly cash flow is $77 ($920/yr) — positive.
- The deal already cash-flows at list — no discount required.
- To meet the 1% rule (rent ≥ 1% of price), the offer needs to be $226k (13.2% below list).
- Recommended offer: $226k (13.2% below list) — sets the bar for 1% rule.
Location & tenants
- Location reads 54/100 on livability (#909 in CA) — a working-class tenant base; expect higher turnover. Strengths: housing A+, health & safety A; Watch: employment C-, crime F, amenities F.
- Dos Palos Oro Loma Joint Unified (town): math 11% / reading 25% proficiency, ranked #479 of 517 in CA (top 93%) — low school quality limits family demand, transient renter base, plan for 1-2y turnover; 79% free/reduced lunch — lower-income household profile, screen leases tightly.
- Zoned schools: Dos Palos Elementary (539 students, 89% FRL); Bryant Middle (math 12% / reading 21%, grade F, #448 of 498 statewide, top 91%, 514 students, 89% FRL); Dos Palos High (math 12% / reading 52%, grade F, #674 of 1,170 statewide, top 59%, 665 students, 87% FRL).
- Market conditions: 38 active listings in the ZIP; 2 comparable units currently listed for rent nearby; 459 units permitted in Merced County in 2024 (0 in 5+ unit buildings).
Forward outlook
- Local home prices are declining (-3.0%/yr); year-one equity from $2k of loan paydown is wiped out by about $8k of value loss. Plan a longer hold.
- Merced County population projected at +12% by 2050 — modest demand growth; plan on rents tracking national, not racing it.
Negotiation context
- It's been on market 20 days — a 2% lower offer ($256k) is reasonable based on typical stale-listing flexibility.
- Current owner paid $30k; list at $260k implies a 766% gain — meaningful room to come down on a strong offer.
Risks & watch-outs
- Climate carrying-cost: moderate flood risk; extreme-heat days projected 7→16/yr by 2055 (HVAC capex compounding) — expect insurance premiums to compound above CPI over the hold.
Questions for the listing agent
- Is there a deadline driving the sale (1031 exchange, divorce, estate, relocation)? That informs how much negotiation room exists.
- Schools are F-rated, which usually means shorter tenancies and higher turnover. Who's the typical renter profile here, and what's been the actual vacancy rate?
- Crime grade is F in this area — have there been break-ins, vandalism, or insurance claims at this property in the last 3 years? What carrier currently insures it and at what premium?
- The area grade is low — what's the realistic commute time and amenity access for the typical tenant pool here? Any planned neighborhood developments (good or bad) we should know about?
- What's the average days-on-market for RENTAL listings here right now (not sales)? A rising rental-DOM trend means longer vacancies and softer asking-rent achievability than the comps imply.
- What's the recent tenant-quality profile in this submarket — average credit score on applications, eviction rate, late-payment / NSF rate, and stable-employment percentage? A property-management company in the area should have these aggregated.
- How much new for-sale + rental construction is in the pipeline within 1–3 miles? Heavy new supply typically softens prices + rents 12–24 months out; constrained supply supports both.
Investment metrics
- 1% rule
- 0.87% ✗
- Cap rate
- 6.65%
- Cash-on-cash
- 1.26%
- DSCR
- 1.06
- GRM
- 9.6
CMA / ARV
- ARV (on-the-fly)
- $342,912
- Comps found
- 12
Show comp detail 12 sales within ~0.75 mi
| Address | Dist | Beds/Ba | Sqft | Sold | Price | $/sf | Match |
|---|---|---|---|---|---|---|---|
| 1358 Conner Ave | 0.31mi | 4/2.0 | 1,606 (+7%) | 2mo | $350,000 | $218 | 73 |
| 1110 California Ave | 0.50mi | 3/2.0 (-1) | 1,521 (+1%) | 5mo | $445,000 | $293 | 65 |
| 2326 Santos St | 0.43mi | 3/2.0 (-1) | 1,428 (-5%) | 2mo | $310,000 | $217 | 65 |
| 849 Golden Gate Ave | 0.71mi | 4/2.0 | 1,555 (+3%) | 6mo | $362,500 | $233 | 56 |
| 1309 Center Ave | 0.50mi | 3/2.0 (-1) | 1,613 (+7%) | 6mo | $310,000 | $192 | 55 |
| 2334 Santos St | 0.43mi | 4/2.5 | 1,648 (+10%) | 10mo | $375,000 | $228 | 54 |
| 1810 Lucerne | 0.50mi | 3/2.0 (-1) | 1,320 (-12%) | 3mo | $350,000 | $265 | 49 |
| 1218 California Ave | 0.43mi | 3/2.0 (-1) | 1,313 (-13%) | 6mo | $330,000 | $251 | 48 |
| 1726 Merced St | 0.64mi | 3/2.0 (-1) | 1,359 (-10%) | 1mo | $168,000 | $124 | 48 |
| 1830 Valeria St | 0.51mi | 3/1.5 (-1) | 1,313 (-13%) | 4mo | $280,000 | $213 | 45 |
| 815 California Ave | 0.72mi | 3/2.0 (-1) | 1,416 (-6%) | 11mo | $375,000 | $265 | 42 |
| 1274 Dos Palos Ave | 0.69mi | 3/1.0 (-1) | 1,707 (+14%) | 3mo | $160,000 | $94 | 34 |
Match score weights: distance 35% · size 25% · config 20% · recency 20%. Top-matched comps best support the ARV.
Projected returns pro-forma
-3.0% appreciation · 3.0% rent growth · sell at horizon
- IRR
- -14.3%
- Equity multiple
- 0.49×
- Total profit
- $-37,254
- Equity at exit
- $38,752
- IRR
- -5.6%
- Equity multiple
- 0.64×
- Total profit
- $-26,240
- Equity at exit
- $22,471
Cash invested: $72,772 (down + closing). Projections, not guarantees.
Landlord ↔ Tenant lean methodology
- Overall (STATE)
- 18 Strongly Tenant-Friendly
- State California
- 18 Strongly Tenant-Friendly · D+13
- County
- — inherits STATE
- City
- — inherits STATE
ZIP-level market 93620
- Home prices YoY
- -22.1%
- Active inventory
- 38
- Price-to-rent
- 9.6×
Monthly cashflow live
- Estimated rent
- $2,256 medium interval (Pro) →
- Mortgage (P&I)
- −$1,363
- Tax from tax record
- −$234 /mo · $2,810/yr
- Insurance
- −$108
- HOA
- −$0
- Vacancy / Maint / Mgmt
- −$474
- Net cashflow
- $77
Break-even live
UW: 25.0% down · 7.5% · 30yr · 1.5% tax · 5.0% vac · 8.0% maint · 8.0% mgmt
Financing live
Cash to close
- Down payment
- $64,975
- Closing costs
- $7,797
- Reserves months
- —
- Total cash needed
- —
Loan-product check · same deal, 3 products live
Conventional
25% down · 7.5% · 30yr
- Down + closing
- —
- Monthly P&I
- —
- Monthly cashflow
- —
- DSCR
- —
- Eligible?
- —
Personal DTI + credit; lowest rate.
DSCR
20% down · 8.5% · 30yr
- Down + closing
- —
- Monthly P&I
- —
- Monthly cashflow
- —
- DSCR
- —
- Eligible?
- —
No personal income docs; deal must DSCR.
Hard money
10% down · 12.0% · 12mo
- Down + closing
- —
- Monthly P&I
- —
- Monthly cashflow
- —
- DSCR
- —
- Eligible?
- —
Short-term bridge; refi at stabilization.
Rent comps 2 comps
| Address | Beds | Baths | Sqft | Rent | $/sqft | DOM | Units | Dist |
|---|---|---|---|---|---|---|---|---|
| 2674 Marguerite St Dos Palos, CA | 4.0 | 2.0 | 1996 | $2,400 | $1.20 | 13d | 1 | 0.23mi |
| 2083 McTaggart Ave Dos Palos, CA | 3.0 | 2.0 | 1325 | $1,950 | $1.47 | 43d | 1 | 0.58mi |
Listing history 16 events
-
2026-06-18days on market $259,900 Active 20 DOM
-
2026-06-17days on market $259,900 Active 19 DOM
-
2026-06-16days on market $259,900 Active 18 DOM
-
2026-06-15days on market $259,900 Active 17 DOM
-
2026-06-14days on market $259,900 Active 15 DOM
-
2026-06-13days on market $259,900 Active 14 DOM
-
2026-06-10days on market $259,900 Active 12 DOM
-
2026-06-09days on market $259,900 Active 11 DOM
-
2026-06-08days on market $259,900 Active 10 DOM
-
2026-06-07days on market $259,900 Active 9 DOM
-
2026-06-05days on market $259,900 Active 6 DOM
-
2026-06-02days on market $259,900 Active 4 DOM
-
2026-06-01days on market $259,900 Active 3 DOM
-
2026-05-31days on market $259,900 Active 2 DOM
-
2026-05-30remarks 349-char remark
-
2026-05-30$259,900 Active 1 DOM
ⓘ Source: listings_history table (triggers on properties + properties_extension) + one-shot
backfill from property_details.listing_events for pre-trigger history.
Tax reassessment forecast CA · Resets to sale price
- Current annual tax
- $2,810 · $234/mo
- Projected year-2 tax
- $2,810 · $234/mo
- Expected delta
- $0/yr ($0/mo · 0.0%)
ⓘ Screening estimate from a state-policy table — verify with the county assessor before closing.
Climate risk First Street
- Flood 5/10 Major FEMA zone X (unshaded) · 47% chance over 30 yrs
- Wildfire 4/10 Moderate
- Heat 7/10 Severe 7 d/yr ≥103°F today · 16 d/yr by 30 yrs out
- Wind 1/10 Low
- Air quality 10/10 Extreme 26 unhealthy d/yr today · 27 by 30 yrs out
Nearby sold comps map
Loading sold comps map…
Walkable amenities ~0.75 mi
Loading nearby amenities…
Taxation est. · year 1
- Rental income
- $27,069
- − Mortgage interest
- −$14,558
- − Property taxes
- −$2,810
- − Insurance
- −$1,300
- − Repairs & maintenance
- −$2,166
- − Management
- −$2,166
- − Depreciation
- −$7,561
- Taxable loss
- −$3,490
- Est. tax savings @ 24.0%
- +$838
- After-tax cash flow
- $1,758/yr
For passive investors: Depreciation is non-cash, so a rental often shows a tax loss while cash-flowing — sheltering income. Rental losses are passive: they offset passive income freely, and up to $25,000/yr can offset ordinary (W-2) income if you actively participate and your MAGI is under $100k (phasing out to $0 by $150k); unused losses carry forward. On sale, claimed depreciation is recaptured at up to 25%, and gains may owe capital-gains tax (a 1031 exchange can defer both). Figures are a year-1 estimate at your 24.0% rate — not tax advice; consult a CPA.
Schools (NCES district)
- District
- Dos Palos Oro Loma Joint Unified
- NCES district ID
- 0600033
- Math proficiency
- 11% ▼ -3.00%
- Reading proficiency
- 25% ▬ 0.00%
- Median HH income
- $36,926
- Composite
- 14.95/100
- National rank
- #9365
- State rank
- #479 of 517 in CA
Livability — Dos Palos
- Score
- 54/100
- State rank
- #909
- US rank
- #24066
Category grades
Schools grade is shown separately in the Schools card above.
Census & demographics
- Census place
- Dos Palos, CA
- Population (ZIP)
- 10,173
Population outlook (Merced County) Hauer SSP2
- Today (2025)
- 285,501 people
- By 2030
- 293,437 · +2.8%
- By 2040
- 308,808 · +8.2%
- By 2050
- 321,011 · +12.4%
- By 2075
- 338,497 · +18.6%
- By 2100
- 330,493 · +15.8%
Race, ethnicity, and origin ACS 2023
- Neighborhood character
- Predominantly Hispanic (72%)
- Race & ethnicity
- Hispanic / Latino 72% White 18% Two or more races 17% Asian 2% Black 2% Native American 1%
- Hispanic origin (detail)
- Mexican 69% Puerto Rican 1%
- Common ancestry
- Russian 4% Italian 3% Lithuanian 1%
- Foreign-born
- 32% · Canada, Vietnam
- Languages at home
- 48% English-only · Spanish 47% Other Indo-European 2% Vietnamese 1%
Political lean MEDSL · Merced
- 2024 margin
- Toss-up / Even · D 46.5% · R 50.9% · Other 2.6%
- 2008→2024 swing
- -12.7pp toward R · 2008: 8.3pp · 2024: -4.4pp
- All cycles
- 2024: R+4.4 2020: D+10.6 2016: D+7.9 2012: D+5.4 2008: D+8.3
Not yet ingested
- Civics
- —
Market trends
- HPI YoY
- ▼ -78.95%
- Current HPI
- 277.4986
- Rent YoY
- —
- Metro
- —
- State GDP YoY
- ▲ 3.21%
- F500 in state
- 116
Industry mix (Fortune 500 HQ in CA)
| Industry | F500 HQs | Revenue |
|---|---|---|
| Technology | 27 | $1,492B |
|
||
| Financial Services | 3 | $174B |
|
||
| Retail | 3 | $44B |
|
||
| Insurance | 3 | $26B |
|
||
| Media / Entertainment | 2 | $115B |
|
||
| Pharmaceuticals / Biotech | 2 | $62B |
|
||
Price history
+766.3% since first listed2 events — show timeline
- 2026-05-29 Listed $259,900 FRESNOMLS
- 1998-11-16 Sold (Public Records) $30,000 Public Records
Property tax history
+7.5%/yrLatest (2025): $2,810 · -0.1% YoY. Source: county tax records.
Cash-flow waterfall
monthlySold comps — $/sqft
last 12 mo · ≤1 miLoading sold comps…