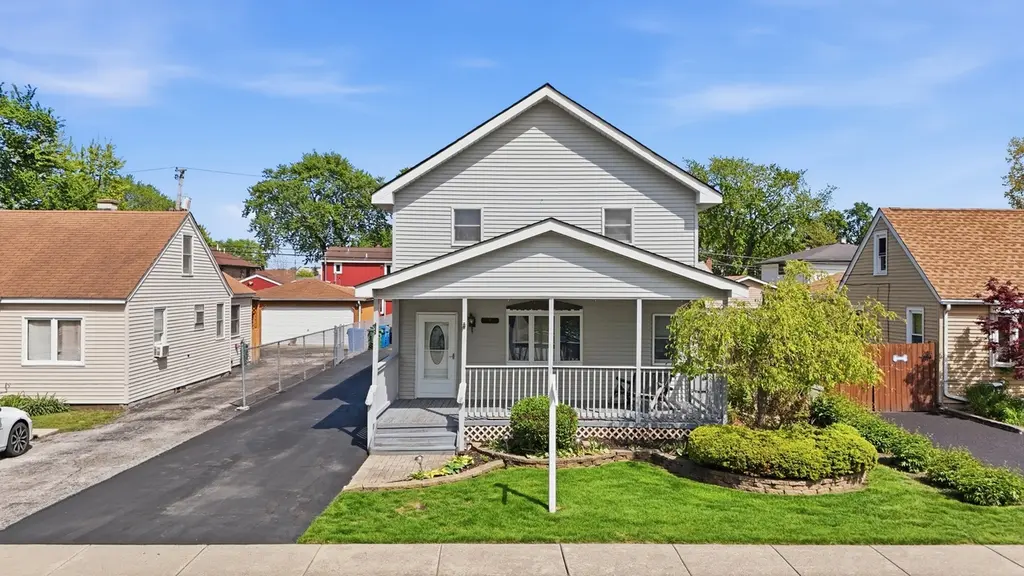
9637 Rutherford Ave · Oak Lawn, IL
Flood risk 4/10 · Minor
- FEMA flood zone
- X (unshaded)
- Chance of flooding over 30 yrs
- 0.22%
- Est. flood insurance / yr
- $473 – $860
Fire risk 1/10 · Minimal
- Est. fire insurance / yr
- $804 – $1,492
Heat risk 3/10 · Minor
- Hot days now (above 101°F)
- 7 days/yr
- Hot days in 30 yrs
- 15 days/yr
Wind risk 2/10 · Minimal
- Chance of severe wind over 30 yrs
- 0.0%
Air-quality risk 3/10 · Minor
- Unhealthy air days now
- 4 days/yr
- Unhealthy air days in 30 yrs
- 4 days/yr
Risk factors via First Street. Map © Google.
Why this score? — see what drove the D+ grade
The composite is a weighted blend of 9 inputs, each scored 0–100. Each bar is that input's sub-score; the figure is the points it added to the 100-point composite (weight × sub-score).
- Cash flow +21.2/30.0
- DSCR +6.8/10.0
- 1% rule +4.8/10.0
- Rent growth +4.6/5.0
- Livability +4.0/5.0
- Condition / age +2.5/5.0
- Schools +1.9/10.0
- ARV discount +0.2/15.0
- Appreciation +0.0/10.0
$408,000
🖨 Deal sheet 📄 Offer letter ✓ Due diligence
Listing remarks
Come check out this charming and bright sun drenched four bedroom one and a half bath home on a double lot just steps from Ernest F. Kolb elementary school. Located in the heart of Oak Lawn this spacious residence offers a perfect blend of comfort, style, and functionality. As you enter the home, you'll be greeted by a bright and airy living room with large windows that let in plenty of natural light. The adjacent kitchen is equipped with modern appliances and ample counter space, making meal prep a breeze. The home features four spacious bedrooms, each with plenty of closet space and natural light. The main bedroom is a serene retreat with plenty of space for a king size bedroom set and co
Key facts
- Ample counter space
- Sun drenched
- Modern appliances
Tags
Property features AI
Finance
- Other: Property not currently leased; Possession at closing
- Financial info: Special service area: No
- HOA & community: No master association fee required; Community features include curbs, sidewalks, street lights, and paved streets
Exterior
- Parking: Detached garage with 2 garage spaces; Asphalt driveway; Garage door opener; Two total parking spaces
- Utilities: Public water; Public sewer; 200+ amp electrical service with circuit breakers
- Home design: Detached single-family home; Two-story; Fee simple ownership; Estimated living area; Built prior to 1978 (age approx. 71–80 years)
- Construction: Vinyl siding; Asphalt roof; Concrete perimeter foundation
- Exterior features: Patio; Lot dimensions about 50 x 126; Less than 0.25 acre lot; Curbs, sidewalks, street lights, and paved streets nearby
Interior
- Kitchen: Pantry/Butler kitchen (approx. 12 x 9); Range; Microwave; Dishwasher; Refrigerator
- Bedrooms: Four bedrooms (three on second floor including master); Second-floor bedroom: 10 x 11; Second-floor bedroom: 12 x 12; Second-floor bedroom: 12 x 12; Second-floor master bedroom: 20 x 14
- Bathrooms: One full bath; One half bath
- Heating & cooling: Natural gas heating; Central air conditioning (partial)
- Interior features: Eight total rooms; Full attic; Crawl space basement; Dining area combined with family room
- Laundry & utility: Main-level laundry (approx. 10 x 9); Washer and dryer included; Gas dryer hookup; Laundry sink; Laundry located in bathroom area
Neighborhood map
What this means for you Summary
Snapshot
- This is a 4-bed/1.5-bath single-family listed at $408k.
Deal economics
- At list price, monthly cash flow is $592 ($7k/yr) — positive.
- The deal already cash-flows at list — no discount required.
- To meet the 1% rule (rent ≥ 1% of price), the offer needs to be $401k (1.8% below list).
- Recommended offer: $401k (1.8% below list) — sets the bar for 1% rule.
- Cap rate 8.0% vs local median 4.4% in Oak Lawn — top-decile yield for the area; either an underpriced asset or a hidden risk that comps aren't pricing in. Stress-test before assuming the spread holds.
Location & tenants
- Location reads 80/100 on livability (#102 in IL, #1,614 nationally) — a professional / high-income tenant draw. Strengths: commute A+, housing A+, employment A-.
- Oak Lawn Chsd 229 (suburban): math 22% / reading 21% proficiency, ranked #384 of 620 in IL (top 62%) — low school quality limits family demand, transient renter base, plan for 1-2y turnover.
- Zoned schools: Oak Lawn Comm High School (math 22% / reading 21%, grade F, #345 of 693 statewide, top 50%, 1,834 students, 0% FRL).
- Market conditions: Rents rising fast (+8.2%/yr); 188 active listings in the ZIP; 5 comparable units currently listed for rent nearby; rentals leasing fast (median 13d on market — plan ~1-2 weeks tenant-placement turnaround); solid renter incomes; 6,272 units permitted in Cook County in 2024 (4,658 in 5+ unit buildings).
- At $4,006/mo this rent would consume 57% of the median local household income ($84k/yr) (locally 827% of renters already pay >50% of income on rent) — very limited rent-growth headroom before tenants either downsize or default.
Forward outlook
- Local home prices are declining (-3.0%/yr); year-one equity from $3k of loan paydown is wiped out by about $12k of value loss. Plan a longer hold.
- At projected returns (-3.0% appreciation + 8.0% rent growth), your $114k cash investment doubles in ~9 years — after that, you're playing with house money.
Negotiation context
- Only 9 days on market — expect competitive offers; lowballing is unlikely to land.
Risks & watch-outs
- Watch-outs: built in 1946 — expect roof / HVAC / electrical / plumbing capex.
Questions for the listing agent
- Built in 1946 — when were the roof, HVAC, electrical panel, plumbing, and water heater last replaced?
- Is there a deadline driving the sale (1031 exchange, divorce, estate, relocation)? That informs how much negotiation room exists.
- The area grade is low — what's the realistic commute time and amenity access for the typical tenant pool here? Any planned neighborhood developments (good or bad) we should know about?
- What's the average days-on-market for RENTAL listings here right now (not sales)? A rising rental-DOM trend means longer vacancies and softer asking-rent achievability than the comps imply.
- What's the recent tenant-quality profile in this submarket — average credit score on applications, eviction rate, late-payment / NSF rate, and stable-employment percentage? A property-management company in the area should have these aggregated.
- How much new for-sale + rental construction is in the pipeline within 1–3 miles? Heavy new supply typically softens prices + rents 12–24 months out; constrained supply supports both.
Investment metrics
- 1% rule
- 0.98% ✗
- Cap rate
- 8.04%
- Cash-on-cash
- 6.22%
- DSCR
- 1.28
- GRM
- 8.5
CMA / ARV
- ARV (on-the-fly)
- $351,168
- Comps found
- 12
Show comp detail 12 sales within ~0.75 mi
| Address | Dist | Beds/Ba | Sqft | Sold | Price | $/sf | Match |
|---|---|---|---|---|---|---|---|
| 9606 S Natoma Ave | 0.12mi | 4/2.0 | 1,843 (-2%) | 3mo | $175,000 | $95 | 86 |
| 6913 97th St | 0.23mi | 4/3.0 | 1,850 (-2%) | 8mo | $345,000 | $186 | 73 |
| 9749 S Oak Park Ave | 0.16mi | 3/1.5 (-1) | 1,798 (-5%) | 8mo | $220,000 | $122 | 73 |
| 9824 Normandy Ave | 0.21mi | 5/2.0 (+1) | 1,920 (+2%) | 13mo | $390,000 | $203 | 69 |
| 9805 Normandy Ave | 0.20mi | 4/2.5 | 1,613 (-15%) | 6mo | $320,000 | $198 | 57 |
| 6937 Stanford Dr | 0.55mi | 4/1.0 | 1,672 (-11%) | 1mo | $350,000 | $209 | 52 |
| 9236 Pembroke Ln | 0.55mi | 4/2.5 | 2,064 (+9%) | 3mo | $369,000 | $179 | 52 |
| 6759 W 91st St | 0.71mi | 4/2.0 | 2,030 (+8%) | 3mo | $391,742 | $193 | 50 |
| 7028 Stanford Dr | 0.63mi | 4/1.5 | 1,738 (-8%) | 10mo | $299,000 | $172 | 49 |
| 9555 Merton Ave | 0.58mi | 3/3.5 (-1) | 1,750 (-7%) | 0mo | $480,000 | $274 | 48 |
| 6919 W 96th St | 0.25mi | 3/2.5 (-1) | 2,128 (+13%) | 13mo | $390,000 | $183 | 47 |
| 9228 Ridgeland Ave | 0.68mi | 3/2.0 (-1) | 2,166 (+15%) | 9mo | $385,000 | $178 | 30 |
Match score weights: distance 35% · size 25% · config 20% · recency 20%. Top-matched comps best support the ARV.
Projected returns pro-forma
-3.0% appreciation · 8.0% rent growth · sell at horizon
- IRR
- -1.6%
- Equity multiple
- 0.94×
- Total profit
- $-7,310
- Equity at exit
- $60,834
- IRR
- 12.5%
- Equity multiple
- 2.21×
- Total profit
- $138,189
- Equity at exit
- $35,276
Cash invested: $114,240 (down + closing). Projections, not guarantees.
Landlord ↔ Tenant lean methodology
- Overall (STATE)
- 43 Moderately Tenant-Leaning
- State Illinois
- 43 Moderately Tenant-Leaning · D+7
- County
- — inherits STATE
- City
- — inherits STATE
ZIP-level market 60453
- Rents YoY
- 8.2%
- Active inventory
- 188
- Price-to-rent
- 8.5×
Monthly cashflow live
- Estimated rent
- $4,006 medium interval (Pro) →
- Mortgage (P&I)
- −$2,140
- Tax from tax record
- −$263 /mo · $3,150/yr
- Insurance
- −$170
- HOA
- −$0
- Vacancy / Maint / Mgmt
- −$841
- Net cashflow
- $592
Break-even live
UW: 25.0% down · 7.5% · 30yr · 1.5% tax · 5.0% vac · 8.0% maint · 8.0% mgmt
Financing live
Cash to close
- Down payment
- $102,000
- Closing costs
- $12,240
- Reserves months
- —
- Total cash needed
- —
Loan-product check · same deal, 3 products live
Conventional
25% down · 7.5% · 30yr
- Down + closing
- —
- Monthly P&I
- —
- Monthly cashflow
- —
- DSCR
- —
- Eligible?
- —
Personal DTI + credit; lowest rate.
DSCR
20% down · 8.5% · 30yr
- Down + closing
- —
- Monthly P&I
- —
- Monthly cashflow
- —
- DSCR
- —
- Eligible?
- —
No personal income docs; deal must DSCR.
Hard money
10% down · 12.0% · 12mo
- Down + closing
- —
- Monthly P&I
- —
- Monthly cashflow
- —
- DSCR
- —
- Eligible?
- —
Short-term bridge; refi at stabilization.
Rent comps 5 comps
| Address | Beds | Baths | Sqft | Rent | $/sqft | DOM | Units | Dist |
|---|---|---|---|---|---|---|---|---|
| 9705 Oak Park Ave Oak Lawn, IL | 3.0 | 2.5 | 2050 | $4,975 | $2.43 | 1d | 1 | 0.07mi |
| 9308 Nordica Ave Oak Lawn, IL | 3.0 | 2.0 | 1349 | $960 | $0.71 | 12d | 1 | 0.61mi |
| 8912 Windsor Ln Bridgeview, IL | 4.0 | 1.0 | 1413 | $2,800 | $1.98 | 10d | 1 | 0.98mi |
| 10326 Mayfield Ave Unit 1N Oak Lawn, IL | 4.0 | 2.0 | 1300 | $2,400 | $1.85 | 16d | 1 | 1.34mi |
| 8621 Natchez Ave Burbank, IL | 3.0 | 3.0 | 2000 | $2,900 | $1.45 | 22d | 1 | 1.35mi |
Listing history 13 events
-
2026-06-18days on market $408,000 Active 9 DOM
-
2026-06-17days on market $408,000 Active 8 DOM
-
2026-06-16days on market $408,000 Active 7 DOM
-
2026-06-15days on market $408,000 Active 6 DOM
-
2026-06-13days on market $408,000 Active 4 DOM
-
2026-06-13days on market $408,000 Active 3 DOM
-
2026-06-10remarks 699-char remark
-
2026-06-10pricedays on market $408,000 Active 1 DOM
-
2026-06-03days on market $415,000 Active 30 DOM
-
2026-06-02days on market $415,000 Active 29 DOM
-
2026-06-01days on market $415,000 Active 28 DOM
-
2026-05-31days on market $415,000 Active 27 DOM
-
2026-04-09historical
ⓘ Source: listings_history table (triggers on properties + properties_extension) + one-shot
backfill from property_details.listing_events for pre-trigger history.
Tax reassessment forecast IL · Partial reset (capped growth)
- Current annual tax
- $3,150 · $263/mo
- Projected year-2 tax
- $6,206 · $517/mo
- Expected delta
- +$3,056/yr (+$255/mo · 97.0%)
ⓘ Screening estimate from a state-policy table — verify with the county assessor before closing.
Climate risk First Street
- Flood 4/10 Moderate FEMA zone X (unshaded) · 22% chance over 30 yrs
- Wildfire 1/10 Low
- Heat 3/10 Moderate 7 d/yr ≥101°F today · 15 d/yr by 30 yrs out
- Wind 2/10 Low 0% chance of damaging wind over 30 yrs
- Air quality 3/10 Moderate 4 unhealthy d/yr today · 4 by 30 yrs out
Nearby sold comps map
Loading sold comps map…
Walkable amenities ~0.75 mi
Loading nearby amenities…
Taxation est. · year 1
- Rental income
- $48,068
- − Mortgage interest
- −$22,854
- − Property taxes
- −$3,150
- − Insurance
- −$2,040
- − Repairs & maintenance
- −$3,845
- − Management
- −$3,845
- − Depreciation
- −$11,869
- Taxable income
- $463
- Est. tax owed @ 24.0%
- −$111
- After-tax cash flow
- $6,997/yr
For passive investors: Depreciation is non-cash, so a rental often shows a tax loss while cash-flowing — sheltering income. Rental losses are passive: they offset passive income freely, and up to $25,000/yr can offset ordinary (W-2) income if you actively participate and your MAGI is under $100k (phasing out to $0 by $150k); unused losses carry forward. On sale, claimed depreciation is recaptured at up to 25%, and gains may owe capital-gains tax (a 1031 exchange can defer both). Figures are a year-1 estimate at your 24.0% rate — not tax advice; consult a CPA.
Schools (NCES district)
- District
- Oak Lawn Chsd 229
- NCES district ID
- 1729220
- Math proficiency
- 22% ▼ -4.00%
- Reading proficiency
- 21% ▼ -4.00%
- Median HH income
- $52,505
- Composite
- 19.41/100
- National rank
- #8777
- State rank
- #384 of 620 in IL
Livability — Oak Lawn
- Score
- 80/100
- State rank
- #102
- US rank
- #1614
Category grades
Schools grade is shown separately in the Schools card above.
Census & demographics
- Census place
- Oak Lawn, IL
- County
- Cook County · 4,486,803 people
- City population
- 56,861
- Metro
- Chicago-Naperville-Elgin, IL-IN-WI
- Population (ZIP)
- 56,861
- Household income
- $83,911
- Rent vs Own
- Severe rent burden
- 827.0
Population outlook (Cook County) Hauer SSP2
- Today (2025)
- 5,347,519 people
- By 2030
- 5,357,703 · +0.2%
- By 2040
- 5,324,924 · -0.4%
- By 2050
- 5,230,762 · -2.2%
- By 2075
- 4,785,735 · -10.5%
- By 2100
- 4,188,836 · -21.7%
Race, ethnicity, and origin ACS 2023
- Neighborhood character
- Majority White (64%)
- Race & ethnicity
- White 64% Hispanic / Latino 24% Two or more races 9% Black 8% Asian 2%
- Hispanic origin (detail)
- Mexican 21%
- Common ancestry
- Romanian 16% Iranian 1% Armenian 1%
- Foreign-born
- 16% · Canada, Vietnam
- Languages at home
- 70% English-only · Spanish 17% Russian/Polish/Slavic 5% Arabic 4%
Political lean MEDSL · Cook
- 2024 margin
- Solid D (+42.0) · D 70.4% · R 28.4% · Other 1.2%
- 2008→2024 swing
- -11.4pp toward R · 2008: 53.4pp · 2024: 42.0pp
- All cycles
- 2024: D+42.0 2020: D+50.3 2016: D+53.0 2012: D+49.4 2008: D+53.4
Not yet ingested
- Civics
- —
Market trends
- HPI YoY
- ▼ -259.83%
- Current HPI
- 214.6977
- Rent YoY
- ▲ 8.23%
- Metro
- Chicago-Naperville-Elgin, IL-IN-WI
- State GDP YoY
- ▲ 1.59%
- F500 in state
- 60
Industry mix (Fortune 500 HQ in IL)
| Industry | F500 HQs | Revenue |
|---|---|---|
| Insurance | 4 | $201B |
|
||
| Consumer Goods | 4 | $87B |
|
||
| Industrial Machinery | 3 | $64B |
|
||
| Healthcare | 2 | $55B |
|
||
| Retail / Pharmacy | 1 | $148B |
|
||
| Agriculture / Food | 1 | $86B |
|
||
Property tax history
+4.4%/yrLatest (2023): $3,150 · +41.2% YoY. Source: county tax records.
Cash-flow waterfall
monthlySold comps — $/sqft
last 12 mo · ≤1 miLoading sold comps…