8401 N 67th Ave #97 · Glendale, AZ
Flood risk 1/10 · Minimal
- FEMA flood zone
- X (shaded)
- Chance of flooding over 30 yrs
- 0.0%
- Est. flood insurance / yr
- $507 – $1,088
Fire risk 1/10 · Minimal
- Est. fire insurance / yr
- $610 – $1,132
Heat risk 9/10 · Severe
- Hot days now (above 112°F)
- 5 days/yr
- Hot days in 30 yrs
- 14 days/yr
Wind risk 1/10 · Minimal
- Chance of severe wind over 30 yrs
- —
Air-quality risk 3/10 · Minor
- Unhealthy air days now
- 3 days/yr
- Unhealthy air days in 30 yrs
- 3 days/yr
Risk factors via First Street. Map © Google.
Why this score? — see what drove the B grade
The composite is a weighted blend of 9 inputs, each scored 0–100. Each bar is that input's sub-score; the figure is the points it added to the 100-point composite (weight × sub-score).
- Cash flow +30.0/30.0
- ARV discount +12.1/15.0
- 1% rule +10.0/10.0
- DSCR +10.0/10.0
- Livability +3.8/5.0
- Rent growth +2.9/5.0
- Condition / age +2.5/5.0
- Schools +2.3/10.0
- Appreciation +0.0/10.0
$112,500
🖨 Deal sheet (PDF) 📄 Offer letter ✓ Due diligence
Listing remarks
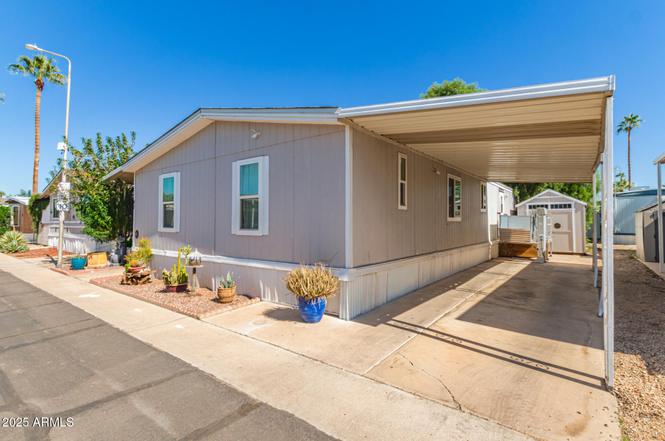
Welcome to this charming 4-bedroom manufactured home in Orange Grove Estates! Discover the bright interior, showcasing wood-look flooring, vaulted ceilings for a feeling of openness, and earthy colors. The galley-style kitchen boasts spacious cabinets, ample counter space, and built-in essentials. The main bedroom promises a good night's sleep and hosts a closet with mirrored doors and a private bathroom for added convenience. Enjoy your morning coffee in the screened-in patio and get ready for weekend grills in the backyard, complete with a mature landscape and flagstone flooring. Remember to visit this vibrant community's pool, spa & clubhouse for fun times! This gem won't last!
Key facts
- Spacious cabinets
- Galley-style kitchen
- Community pool
Tags
Property features AI
Finance
- HOA & community: Land lease: $720 per month; No association fees listed; Community pool; Community spa; Community laundry; Fitness center; Transportation services
Exterior
- Parking: 2 covered parking spaces; 2 open parking spaces; 2 carport spaces
- Utilities: Private sewer; Private water company
- Home design: Manufactured/mobile home; Leasehold ownership; City view
- Construction: Wood frame construction with painted exterior; Composition roof
- Exterior features: Shed(s); Desert backyard; Gravel/stone front and back; City-maintained road
Interior
- Kitchen: Laminate counters; Dishwasher; Disposal
- Bedrooms: Up to 4 bedrooms
- Flooring: Vinyl; Tile
- Bathrooms: 2 full bathrooms
- Heating & cooling: Electric heating; Central air; Ceiling fans
- Interior features: High-speed internet; No interior steps; Vaulted ceilings; Full bath in master bedroom; Bath lever faucets; Screened-in patio; Storage
- Laundry & utility: Inside laundry with washer/dryer hookup only
Neighborhood map
What this means for you Summary
Snapshot
- This is a 4-bed/2.0-bath manufactured listed at $112k.
Deal economics
- At list price, monthly cash flow is $854 ($10k/yr) — positive.
- The deal already cash-flows at list — no discount required.
- Meets the 1% rule at list price ($2k rent vs $112k).
- Recommended offer: $99k (12.0% below list) — sets the bar for market timing.
- Cap rate 15.4% vs local median 3.5% in Glendale — top-decile yield for the area; either an underpriced asset or a hidden risk that comps aren't pricing in. Stress-test before assuming the spread holds.
Location & tenants
- Location reads 76/100 on livability (#12 in AZ, #3,235 nationally) — a middle-class / working-renter tenant base. Strengths: commute A+, housing A+, amenities B; Watch: health & safety D+, crime F.
- Glendale Union High School District (4285) (urban): math 23% / reading 31% proficiency, ranked #130 of 249 in AZ (top 52%) — low school quality limits family demand, transient renter base, plan for 1-2y turnover.
- Zoned schools: Glendale High School (math 13% / reading 22%, grade F, #245 of 381 statewide, top 65%, 1,816 students, 76% FRL).
- Market conditions: Rents rising (+1.7%/yr); 172 active listings in the ZIP; 31 comparable units currently listed for rent nearby; rentals leasing fast (median 6d on market — plan ~1-2 weeks tenant-placement turnaround); 36,011 units permitted in Maricopa County in 2024 (12,801 in 5+ unit buildings).
- This rent runs 38% of the median local income ($65k/yr) — at the standard rent-burdened threshold; future hikes will face affordability resistance.
Forward outlook
- Local home prices are declining (-3.0%/yr); year-one equity from $778 of loan paydown is wiped out by about $3k of value loss. Plan a longer hold.
- Maricopa County population projected at +38% by 2050 — long-run rental-demand tailwind backs the buy-and-hold thesis.
- At projected returns (-3.0% appreciation + 1.7% rent growth), your $32k cash investment doubles in ~4 years — after that, you're playing with house money.
Negotiation context
- It's been on market 153 days — a 12% lower offer ($99k) is reasonable based on typical stale-listing flexibility.
- 3 sale attempts; this cycle's ask has dropped $10k (8%) from the opening price — seller is motivated, your offer sets the floor, not the list.
Risks & watch-outs
- Climate carrying-cost: extreme-heat days projected 5→14/yr by 2055 (HVAC capex compounding) — expect insurance premiums to compound above CPI over the hold.
Questions for the listing agent
- It's been on market 153 days. Have you received any prior offers? Is the seller open to a 12% concession, seller financing, or rate buy-down credit?
- Why hasn't it sold? Are there any deal-killer items the seller is aware of (foundation, flood, title, zoning, code violations)?
- Is there a deadline driving the sale (1031 exchange, divorce, estate, relocation)? That informs how much negotiation room exists.
- Crime grade is F in this area — have there been break-ins, vandalism, or insurance claims at this property in the last 3 years? What carrier currently insures it and at what premium?
- What's the average days-on-market for RENTAL listings here right now (not sales)? A rising rental-DOM trend means longer vacancies and softer asking-rent achievability than the comps imply.
- What's the recent tenant-quality profile in this submarket — average credit score on applications, eviction rate, late-payment / NSF rate, and stable-employment percentage? A property-management company in the area should have these aggregated.
- How much new for-sale + rental construction is in the pipeline within 1–3 miles? Heavy new supply typically softens prices + rents 12–24 months out; constrained supply supports both.
Investment metrics
- 1% rule
- 1.84% ✓
- Cap rate
- 15.40%
- Cash-on-cash
- 32.52%
- DSCR
- 2.45
- GRM
- 4.5
CMA / ARV
- ARV (on-the-fly)
- $125,216
- Comps found
- 12
Show comp detail 12 sales within ~0.75 mi
| Address | Dist | Beds/Ba | Sqft | Sold | Price | $/sf | Match |
|---|---|---|---|---|---|---|---|
| 8401 N 67th Ave #273 | 0.00mi | 3/2.0 (-1) | 1,456 (0%) | 24mo | $85,000 | $58 | 75 |
| 8401 N 67th Ave #91 | 0.00mi | 3/2.0 (-1) | 1,344 (-8%) | 12mo | $135,000 | $100 | 72 |
| 8401 N 67th Ave #83 | 0.00mi | 3/2.0 (-1) | 1,536 (+6%) | 23mo | $106,650 | $69 | 67 |
| 8601 N 71st Ave #89 | 0.56mi | 3/2.0 (-1) | 1,456 (0%) | 11mo | $145,000 | $100 | 59 |
| 6601 W Eva St | 0.70mi | 4/3.0 | 1,460 (+0%) | 7mo | $240,000 | $164 | 58 |
| 8601 N 71st Ave #55 | 0.56mi | 4/2.0 | 1,440 (-1%) | 18mo | $97,000 | $67 | 57 |
| 8601 N 71st Ave #17 | 0.56mi | 3/2.0 (-1) | 1,474 (+1%) | 14mo | $150,000 | $102 | 55 |
| 8601 N 71st Ave #128 | 0.56mi | 3/2.0 (-1) | 1,440 (-1%) | 20mo | $100,000 | $69 | 50 |
| 8601 N 71st Ave #56 | 0.56mi | 4/2.0 | 1,560 (+7%) | 20mo | $101,000 | $65 | 45 |
| 8595 N 71st Ave #88 | 0.50mi | 3/2.0 (-1) | 1,344 (-8%) | 18mo | $95,000 | $71 | 44 |
| 8601 N 71st Ave #123 | 0.56mi | 4/2.0 | 1,344 (-8%) | 23mo | $115,000 | $86 | 42 |
| 6538 W Eva St | 0.75mi | 3/2.0 (-1) | 1,249 (-14%) | 12mo | $245,000 | $196 | 27 |
Match score weights: distance 35% · size 25% · config 20% · recency 20%. Top-matched comps best support the ARV.
Projected returns pro-forma
-3.0% appreciation · 1.74% rent growth · sell at horizon
- IRR
- 26.2%
- Equity multiple
- 2.07×
- Total profit
- $33,579
- Equity at exit
- $16,774
- IRR
- 33.0%
- Equity multiple
- 3.83×
- Total profit
- $89,025
- Equity at exit
- $9,727
Cash invested: $31,500 (down + closing). Projections, not guarantees.
Landlord ↔ Tenant lean methodology
- Overall (STATE)
- 87 Strongly Landlord-Friendly
- State Arizona
- 87 Strongly Landlord-Friendly · R+3
- County
- — inherits STATE
- City
- — inherits STATE
ZIP-level market 85302
- Rents YoY
- 1.7%
- Active inventory
- 172
- Price-to-rent
- 4.5×
Monthly cashflow live
- Estimated rent
- $2,065 high interval (Pro) →
- Mortgage (P&I)
- −$590
- Tax est. 1.5%
- −$141 /mo · $1,688/yr
- Insurance
- −$47
- HOA
- −$0
- Vacancy / Maint / Mgmt
- −$434
- Net cashflow
- $854
Break-even live
Sensitivity live
| Price | -10% $931 | -5% $892 | +0% $854 | +5% $815 | +10% $776 |
|---|---|---|---|---|---|
| Rent | -10% $690 | -5% $772 | +0% $854 | +5% $935 | +10% $1,017 |
| Rate | -1.0pp $910 | -0.5pp $882 | base $854 | +0.5pp $824 | +1.0pp $795 |
UW: 25.0% down · 7.5% · 30yr · 1.5% tax · 5.0% vac · 8.0% maint · 8.0% mgmt
Financing live
Cash to close
- Down payment
- $28,125
- Closing costs
- $3,375
- Reserves months
- —
- Total cash needed
- —
Loan-product check · same deal, 3 products live
Conventional
25% down · 7.5% · 30yr
- Down + closing
- —
- Monthly P&I
- —
- Monthly cashflow
- —
- DSCR
- —
- Eligible?
- —
Personal DTI + credit; lowest rate.
DSCR
20% down · 8.5% · 30yr
- Down + closing
- —
- Monthly P&I
- —
- Monthly cashflow
- —
- DSCR
- —
- Eligible?
- —
No personal income docs; deal must DSCR.
Hard money
10% down · 12.0% · 12mo
- Down + closing
- —
- Monthly P&I
- —
- Monthly cashflow
- —
- DSCR
- —
- Eligible?
- —
Short-term bridge; refi at stabilization.
Rent comps 31 comps
| Address | Beds | Baths | Sqft | Rent | $/sqft | DOM | Units | Dist |
|---|---|---|---|---|---|---|---|---|
| 8772 N 67th Ave Glendale, AZ | 1.0–3.0 | 1.0–2.0 | 937 | $2,009 | $2.14 | 1d | 24 | 0.38mi |
| 6619 W Golden Ln Glendale, AZ | 4.0 | 2.0 | 1768 | $1,979 | $1.12 | 10d | 1 | 0.49mi |
| 6619 W Golden Ln Glendale, AZ | 4.0 | 2.0 | 1768 | $2,029 | $1.15 | 2d | 1 | 0.49mi |
| 8938 N 64th Ln Glendale, AZ | 3.0 | 2.0 | 1256 | $2,095 | $1.67 | 1d | 1 | 0.60mi |
| 9022 N 63rd Dr Glendale, AZ | 3.0 | 2.0 | 1401 | $2,195 | $1.57 | 13d | 1 | 0.83mi |
| 6353 W Mission Ln Glendale, AZ | 3.0 | 2.0 | 1780 | $2,200 | $1.24 | 44d | 1 | 0.88mi |
| 8622 N 59th Ave Glendale, AZ | 2.0–3.0 | 2.0 | 1232 | $1,899 | $1.54 | 1d | 6 | 0.91mi |
| 8450 N 59th Ave Glendale, AZ | 1.0–3.0 | 1.0–2.0 | 919 | $2,250 | $2.45 | 5d | 1 | 0.93mi |
| 7733 N 60th Ave Glendale, AZ | 3.0 | 2.0 | 1430 | $2,000 | $1.40 | 1d | 1 | 0.98mi |
| 6002 W Townley Ave Glendale, AZ | 3.0 | 1.5 | 1026 | $1,549 | $1.51 | 1d | 1 | 0.99mi |
| 6421 W Carol Ave Glendale, AZ | 3.0 | 2.0 | 1243 | $1,799 | $1.45 | 19d | 1 | 1.00mi |
| 7102 W Carol Ave Peoria, AZ | 3.0 | 2.0 | 1288 | $1,970 | $1.53 | 5d | 1 | 1.07mi |
| 7321 N 69th Ave Glendale, AZ | 4.0 | 2.5 | 1645 | $1,999 | $1.22 | 1d | 1 | 1.08mi |
| 9459 N 64th Dr Glendale, AZ | 3.0 | 2.0 | 1531 | $2,600 | $1.70 | 15d | 1 | 1.09mi |
| 7027 W Palo Verde Ave Peoria, AZ | 3.0 | 2.0 | 1500 | $1,999 | $1.33 | 44d | 1 | 1.09mi |
| 8713 N 58th Ln Glendale, AZ | 3.0 | 2.0 | 1373 | $1,955 | $1.42 | 1d | 1 | 1.11mi |
| 7631 N 59th Ln Glendale, AZ | 3.0 | 1.0 | 1750 | $1,980 | $1.13 | 1d | 1 | 1.11mi |
| 7332 N 70th Dr Glendale, AZ | 3.0 | 2.0 | 1262 | $1,700 | $1.35 | 1d | 1 | 1.13mi |
| 7102 W Palo Verde Ave Peoria, AZ | 3.0 | 2.0 | 1360 | $2,000 | $1.47 | 44d | 1 | 1.15mi |
| 5763 W Freeway Ln Glendale, AZ | 3.0 | 2.0 | 1567 | $2,000 | $1.28 | 3d | 1 | 1.16mi |
| 9819 N 67th Dr Peoria, AZ | 3.0 | 2.0 | 1648 | $2,500 | $1.52 | 24d | 1 | 1.16mi |
| 7519 N 59th Ln Glendale, AZ | 3.0 | 2.0 | 1856 | $2,099 | $1.13 | 24d | 1 | 1.17mi |
| 8718 N 57th Ln Glendale, AZ | 3.0 | 2.0 | 1679 | $2,135 | $1.27 | 20d | 1 | 1.19mi |
| 8114 N 57th Dr Glendale, AZ | 3.0 | 2.0 | 1490 | $2,600 | $1.74 | 3d | 1 | 1.19mi |
| 10013 N 66th Ln Glendale, AZ | 3.0 | 2.0 | 1063 | $1,999 | $1.88 | 24d | 1 | 1.29mi |
| 7063 W Palmaire Ave Glendale, AZ | 3.0 | 2.0 | 1300 | $1,900 | $1.46 | 1d | 1 | 1.29mi |
| 7009 W Brown St Peoria, AZ | 4.0 | 2.0 | 1790 | $2,195 | $1.23 | 13d | 1 | 1.36mi |
| 9914 N 73rd Ave Peoria, AZ | 3.0 | 1.5 | 1312 | $1,716 | $1.31 | 44d | 1 | 1.42mi |
| 5908 W Myrtle Ave Unit 5908 Glendale, AZ | 3.0 | 2.0 | 1053 | $1,375 | $1.31 | 1d | 1 | 1.42mi |
| 7552 W State Ave Glendale, AZ | 3.0 | 2.0 | 1875 | $2,061 | $1.10 | 24d | 1 | 1.43mi |
| 6819 N 64th Ave Glendale, AZ | 3.0 | 2.0 | 1568 | $1,500 | $0.96 | 20d | 1 | 1.45mi |
Listing history 24 events
-
2026-06-18days on market $112,500 Active 153 DOM
-
2026-06-17days on market $112,500 Active 152 DOM
-
2026-06-16days on market $112,500 Active 151 DOM
-
2026-06-15days on market $112,500 Active 150 DOM
-
2026-06-13days on market $112,500 Active 148 DOM
-
2026-06-13days on market $112,500 Active 147 DOM
-
2026-06-09days on market $112,500 Active 144 DOM
-
2026-06-08days on market $112,500 Active 143 DOM
-
2026-06-07days on market $112,500 Active 142 DOM
-
2026-06-04days on market $112,500 Active 139 DOM
-
2026-06-03days on market $112,500 Active 138 DOM
-
2026-06-02days on market $112,500 Active 137 DOM
-
2026-06-01days on market $112,500 Active 136 DOM
-
2026-05-31days on market $112,500 Active 135 DOM
-
2026-05-19price $112,500
-
2026-04-17price $117,500
-
2026-04-03price $119,990
-
2026-01-16$122,000 Active
-
2026-01-16historical
-
2026-01-10price $122,000
-
2025-10-21$125,000 Active
-
2025-09-27historical
-
2025-07-15price $139,000
-
2025-04-03$150,000 Active
ⓘ Source: listings_history table (triggers on properties + properties_extension) + one-shot
backfill from property_details.listing_events for pre-trigger history.
Climate risk First Street
- Flood 1/10 Low FEMA zone X (shaded) · 0% chance over 30 yrs
- Wildfire 1/10 Low
- Heat 9/10 Extreme 5 d/yr ≥112°F today · 14 d/yr by 30 yrs out
- Wind 1/10 Low
- Air quality 3/10 Moderate 3 unhealthy d/yr today · 3 by 30 yrs out
Nearby sold comps map
Loading sold comps map…
Walkable amenities ~0.75 mi
Loading nearby amenities…
Taxation est. · year 1
- Rental income
- $24,775
- − Mortgage interest
- −$6,302
- − Property taxes
- −$1,688
- − Insurance
- −$562
- − Repairs & maintenance
- −$1,982
- − Management
- −$1,982
- − Depreciation
- −$3,273
- Taxable income
- $8,986
- Est. tax owed @ 24.0%
- −$2,157
- After-tax cash flow
- $8,086/yr
For passive investors: Depreciation is non-cash, so a rental often shows a tax loss while cash-flowing — sheltering income. Rental losses are passive: they offset passive income freely, and up to $25,000/yr can offset ordinary (W-2) income if you actively participate and your MAGI is under $100k (phasing out to $0 by $150k); unused losses carry forward. On sale, claimed depreciation is recaptured at up to 25%, and gains may owe capital-gains tax (a 1031 exchange can defer both). Figures are a year-1 estimate at your 24.0% rate — not tax advice; consult a CPA.
Schools (NCES district)
- District
- Glendale Union High School District (4285)
- NCES district ID
- 0403450
- Math proficiency
- 23% ▼ -38.00%
- Reading proficiency
- 31% ▼ -19.00%
- Median HH income
- $40,846
- Composite
- 22.81/100
- National rank
- #8020
- State rank
- #130 of 249 in AZ
Livability — Glendale
- Score
- 76/100
- State rank
- #12
- US rank
- #3235
Category grades
Schools grade is shown separately in the Schools card above.
Census & demographics
- Census place
- Glendale, AZ
- County
- Maricopa County · 4,537,380 people
- City population
- 294,586
- Metro
- Phoenix-Mesa-Chandler, AZ
- Population (ZIP)
- 40,612
- Household income
- $65,132
- Rent vs Own
- Severe rent burden
- 2090.0
Population outlook (Maricopa County) Hauer SSP2
- Today (2025)
- 4,979,203 people
- By 2030
- 5,378,229 · +8.0%
- By 2040
- 6,156,598 · +23.6%
- By 2050
- 6,872,376 · +38.0%
- By 2075
- 8,401,270 · +68.7%
- By 2100
- 9,247,439 · +85.7%
Race, ethnicity, and origin ACS 2023
- Neighborhood character
- Diverse neighborhood (Simpson 0.67)
- Race & ethnicity
- White 45% Hispanic / Latino 35% Two or more races 19% Black 9% Asian 5% Native American 2%
- Hispanic origin (detail)
- Mexican 26% Cuban 2%
- Common ancestry
- Lithuanian 2% Portuguese 2% Romanian 1%
- Foreign-born
- 15% · Canada, Vietnam, China
- Languages at home
- 71% English-only · Spanish 20% Arabic 2% Vietnamese 1%
Political lean MEDSL · Maricopa
- 2024 margin
- Toss-up / Even · D 47.7% · R 51.2% · Other 1.1%
- 2008→2024 swing
- +7.1pp toward D · 2008: -10.6pp · 2024: -3.5pp
- All cycles
- 2024: R+3.5 2020: D+2.2 2016: R+3.5 2012: R+12.0 2008: R+10.6
Not yet ingested
- Civics
- —
Market trends
- HPI YoY
- ▼ -342.03%
- Current HPI
- 335.9575
- Rent YoY
- ▲ 1.74%
- Metro
- Phoenix-Mesa-Chandler, AZ
- State GDP YoY
- ▲ 4.54%
- F500 in state
- 20
Industry mix (Fortune 500 HQ in AZ)
| Industry | F500 HQs | Revenue |
|---|---|---|
| Technology | 2 | $13B |
|
||
| Mining / Metals | 1 | $23B |
|
||
| Environmental Services | 1 | $16B |
|
||
| Metals / Steel | 1 | $14B |
|
||
| Technology Distribution | 1 | $9B |
|
||
| Homebuilding | 1 | $8B |
|
||
Price history
-25.0% since first listed10 events — show timeline
- 2026-05-19 Price Changed $112,500 ARMLS
- 2026-04-17 Price Changed $117,500 ARMLS
- 2026-04-03 Price Changed $119,990 ARMLS
- 2026-01-16 Listing Removed — ARMLS
- 2026-01-16 Listed $122,000 ARMLS
- 2026-01-10 Price Changed $122,000 ARMLS
- 2025-10-21 Listed $125,000 ARMLS
- 2025-09-27 Listing Removed — ARMLS
- 2025-07-15 Price Changed $139,000 ARMLS
- 2025-04-03 Listed $150,000 ARMLS
Cash-flow waterfall
monthlySold comps — $/sqft
last 12 mo · ≤1 miLoading sold comps…