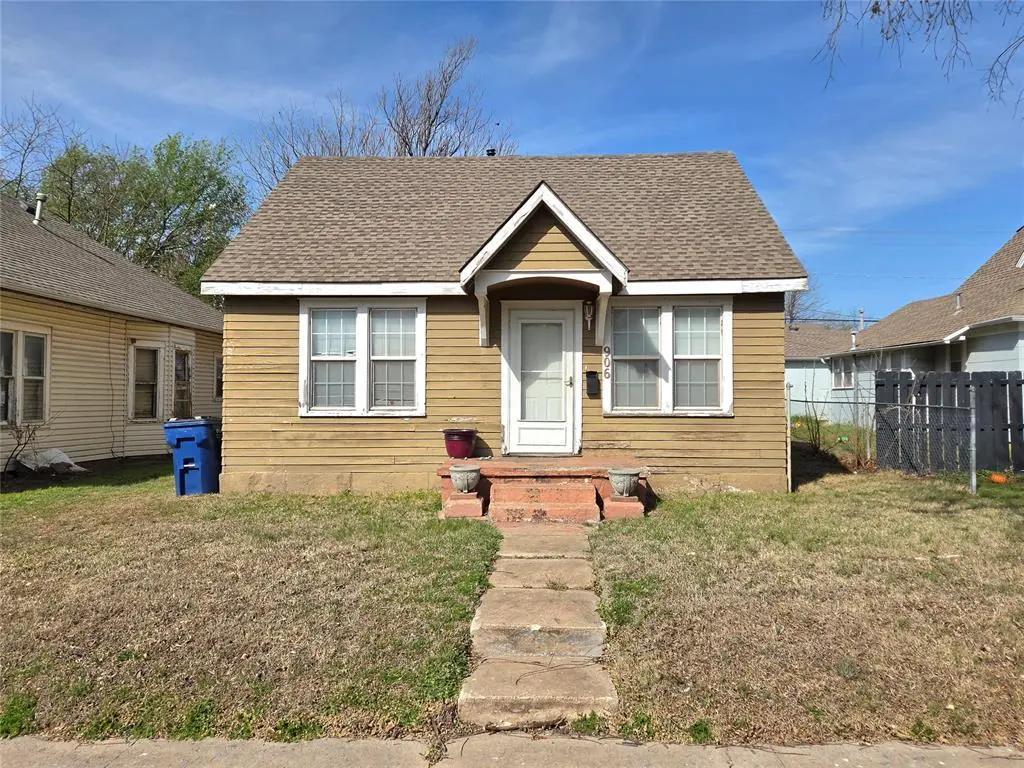
906 S Rock Island Ave · El Reno, OK
Flood risk 1/10 · Minimal
- FEMA flood zone
- X (unshaded)
- Chance of flooding over 30 yrs
- 0.0%
- Est. flood insurance / yr
- $507 – $1,088
Fire risk 1/10 · Minimal
- Est. fire insurance / yr
- $2,463 – $4,575
Heat risk 6/10 · Moderate
- Hot days now (above 107°F)
- 7 days/yr
- Hot days in 30 yrs
- 19 days/yr
Wind risk 2/10 · Minimal
- Chance of severe wind over 30 yrs
- 2.0%
Air-quality risk 2/10 · Minimal
- Unhealthy air days now
- 1 days/yr
- Unhealthy air days in 30 yrs
- 2 days/yr
Risk factors via First Street. Map © Google.
Why this score? — see what drove the C grade
The composite is a weighted blend of 9 inputs, each scored 0–100. Each bar is that input's sub-score; the figure is the points it added to the 100-point composite (weight × sub-score).
- Cash flow +23.8/30.0
- ARV discount +11.9/15.0
- DSCR +7.7/10.0
- 1% rule +5.7/10.0
- Rent growth +3.5/5.0
- Livability +3.4/5.0
- Condition / age +2.5/5.0
- Schools +1.2/10.0
- Appreciation +0.0/10.0
$116,500
🖨 Deal sheet (PDF) 📄 Offer letter ✓ Due diligence
Listing remarks MLS
MANY updates in 2008--carpet, ceiling fans, paint, light fixtures, kitchen sinks, faucets,toilet, vent lite fan in bath, front & backdoors, dishwasher, counter-tops this house is MOVE IN READY! and LIKE new!!
Key facts
- Proximity to schools
- Proximity to dining
- Inside utility room
Tags
Property features AI
Finance
- Financial info: Listing offered As-Is; acceptable financing: Cash or Conventional; Not assumable
- HOA & community: No mandatory association dues
Exterior
- Parking: 1-car garage
- Utilities: Electricity available; Natural gas available; Public utilities
- Home design: Single-family residence; One-level property; Existing property
- Construction: Frame construction; Composition roof (replaced/updated in 2013); Conventional foundation
- Exterior features: No notable exterior features listed; Interior lot
Interior
- Kitchen: Built-in electric range; Dishwasher; Microwave
- Bedrooms: 2 bedrooms (both with ceiling fans)
- Bathrooms: 1 full bathroom
- Interior features: Ceiling fans in living room and both bedrooms; Fireplace in living room; Disposal
Neighborhood map
What this means for you Summary
Snapshot
- This is a 2-bed/1.0-bath single-family listed at $116k.
Deal economics
- At list price, monthly cash flow is $224 ($3k/yr) — positive.
- The deal already cash-flows at list — no discount required.
- Meets the 1% rule at list price ($1k rent vs $116k).
- Recommended offer: $110k (6.0% below list) — sets the bar for market timing.
- Cap rate 8.6% vs local median 4.8% in El Reno — top-decile yield for the area; either an underpriced asset or a hidden risk that comps aren't pricing in. Stress-test before assuming the spread holds.
Location & tenants
- Location reads 67/100 on livability (#95 in OK) — a middle-class / working-renter tenant base. Strengths: cost of living A+, housing A+, crime B+; Watch: health & safety C-, amenities F, commute F.
- El Reno (town): math 12% / reading 15% proficiency, ranked #232 of 270 in OK (top 86%) — low school quality limits family demand, transient renter base, plan for 1-2y turnover; 68% free/reduced lunch — lower-income household profile, screen leases tightly.
- Zoned schools: Rose Witcher Es (387 students, 0% FRL); Etta Dale Jhs (math 7% / reading 13%, grade F, #277 of 345 statewide, top 83%, 444 students, 0% FRL); El Reno Hs (math 16% / reading 19%, grade F, #307 of 447 statewide, top 69%, 980 students, 0% FRL) — zoned schools average 0% FRL vs 68% district-wide (68 pts lower); this property's tenant base skews higher-income than the district average.
- Market conditions: Rents rising fast (+4.2%/yr); 281 active listings in the ZIP; 14 comparable units currently listed for rent nearby; rentals leasing fast (median 6d on market — plan ~1-2 weeks tenant-placement turnaround); 260 units permitted in Canadian County in 2024 (0 in 5+ unit buildings).
Forward outlook
- Local home prices are declining (-3.0%/yr); year-one equity from $805 of loan paydown is wiped out by about $3k of value loss. Plan a longer hold.
- Canadian County population projected at +64% by 2050 — long-run rental-demand tailwind backs the buy-and-hold thesis.
Negotiation context
- It's been on market 83 days — a 6% lower offer ($110k) is reasonable based on typical stale-listing flexibility.
- 5 sale attempts since 18y ago with the ask held roughly flat each time — persistent listings suggest the price (not the market) is what's stuck; bring a comps-based counter.
- Current owner paid $70k; list at $116k implies a 66% gain — meaningful room to come down on a strong offer.
Risks & watch-outs
- Watch-outs: built in 1950 — expect roof / HVAC / electrical / plumbing capex.
- Climate carrying-cost: extreme-heat days projected 7→19/yr by 2055 (HVAC capex compounding) — expect insurance premiums to compound above CPI over the hold.
Questions for the listing agent
- It's been on market 83 days. Have you received any prior offers? Is the seller open to a 6% concession, seller financing, or rate buy-down credit?
- Built in 1950 — when were the roof, HVAC, electrical panel, plumbing, and water heater last replaced?
- Why hasn't it sold? Are there any deal-killer items the seller is aware of (foundation, flood, title, zoning, code violations)?
- Is there a deadline driving the sale (1031 exchange, divorce, estate, relocation)? That informs how much negotiation room exists.
- Schools are F-rated, which usually means shorter tenancies and higher turnover. Who's the typical renter profile here, and what's been the actual vacancy rate?
- What's the average days-on-market for RENTAL listings here right now (not sales)? A rising rental-DOM trend means longer vacancies and softer asking-rent achievability than the comps imply.
- What's the recent tenant-quality profile in this submarket — average credit score on applications, eviction rate, late-payment / NSF rate, and stable-employment percentage? A property-management company in the area should have these aggregated.
- How much new for-sale + rental construction is in the pipeline within 1–3 miles? Heavy new supply typically softens prices + rents 12–24 months out; constrained supply supports both.
Investment metrics
- 1% rule
- 1.07% ✓
- Cap rate
- 8.61%
- Cash-on-cash
- 8.26%
- DSCR
- 1.37
- GRM
- 7.8
CMA / ARV
- ARV (on-the-fly)
- $129,276
- Comps found
- 12
Show comp detail 12 sales within ~0.75 mi
| Address | Dist | Beds/Ba | Sqft | Sold | Price | $/sf | Match |
|---|---|---|---|---|---|---|---|
| 818 E Watts St | 0.52mi | 2/1.0 | 1,024 (-0%) | 1mo | $125,000 | $122 | 75 |
| 314 S Roberts Ave | 0.48mi | 3/1.0 (+1) | 1,028 (+0%) | 2mo | $141,000 | $137 | 71 |
| 1012 S Ellison Ave | 0.50mi | 2/1.0 | 1,090 (+6%) | 2mo | $114,000 | $105 | 64 |
| 605 S Reno Ave | 0.55mi | 2/1.0 | 1,093 (+6%) | 1mo | $149,900 | $137 | 62 |
| 324 Hal Dr | 0.62mi | 2/1.0 | 1,000 (-2%) | 6mo | $118,000 | $118 | 62 |
| 717 S Miles Ave | 0.32mi | 2/1.0 | 912 (-11%) | 8mo | $114,900 | $126 | 60 |
| 818 W Watts St | 0.61mi | 2/2.0 | 1,026 (0%) | 9mo | $128,438 | $125 | 60 |
| 1008 E Woodson St | 0.73mi | 3/1.0 (+1) | 999 (-3%) | 1mo | $75,500 | $76 | 56 |
| 1606 S Choctaw Ave | 0.46mi | 3/1.0 (+1) | 936 (-9%) | 10mo | $65,000 | $69 | 51 |
| 1805 S Jensen Ave | 0.69mi | 2/1.0 | 912 (-11%) | 5mo | $129,900 | $142 | 45 |
| 1305 S Reno Ave | 0.74mi | 3/1.0 (+1) | 1,136 (+11%) | 5mo | $165,000 | $145 | 38 |
| 313 Hal Dr | 0.67mi | 3/1.0 (+1) | 1,165 (+14%) | 7mo | $150,000 | $129 | 35 |
Match score weights: distance 35% · size 25% · config 20% · recency 20%. Top-matched comps best support the ARV.
Projected returns pro-forma
-3.0% appreciation · 4.19% rent growth · sell at horizon
- IRR
- -2.5%
- Equity multiple
- 0.91×
- Total profit
- $-3,084
- Equity at exit
- $17,371
- IRR
- 8.4%
- Equity multiple
- 1.67×
- Total profit
- $22,017
- Equity at exit
- $10,073
Cash invested: $32,620 (down + closing). Projections, not guarantees.
Landlord ↔ Tenant lean methodology
- Overall (STATE)
- 83 Strongly Landlord-Friendly
- State Oklahoma
- 83 Strongly Landlord-Friendly · R+20
- County
- — inherits STATE
- City
- — inherits STATE
ZIP-level market 73036
- Home prices YoY
- -3.3%
- Rents YoY
- 4.2%
- Active inventory
- 281
- Price-to-rent
- 7.8×
Monthly cashflow live
- Estimated rent
- $1,244 high interval (Pro) →
- Mortgage (P&I)
- −$611
- Tax from tax record
- −$98 /mo · $1,182/yr
- Insurance
- −$49
- HOA
- −$0
- Vacancy / Maint / Mgmt
- −$261
- Net cashflow
- $224
Break-even live
Sensitivity live
| Price | -10% $290 | -5% $257 | +0% $224 | +5% $192 | +10% $159 |
|---|---|---|---|---|---|
| Rent | -10% $126 | -5% $175 | +0% $224 | +5% $274 | +10% $323 |
| Rate | -1.0pp $283 | -0.5pp $254 | base $224 | +0.5pp $194 | +1.0pp $164 |
UW: 25.0% down · 7.5% · 30yr · 1.5% tax · 5.0% vac · 8.0% maint · 8.0% mgmt
Financing live
Cash to close
- Down payment
- $29,125
- Closing costs
- $3,495
- Reserves months
- —
- Total cash needed
- —
Loan-product check · same deal, 3 products live
Conventional
25% down · 7.5% · 30yr
- Down + closing
- —
- Monthly P&I
- —
- Monthly cashflow
- —
- DSCR
- —
- Eligible?
- —
Personal DTI + credit; lowest rate.
DSCR
20% down · 8.5% · 30yr
- Down + closing
- —
- Monthly P&I
- —
- Monthly cashflow
- —
- DSCR
- —
- Eligible?
- —
No personal income docs; deal must DSCR.
Hard money
10% down · 12.0% · 12mo
- Down + closing
- —
- Monthly P&I
- —
- Monthly cashflow
- —
- DSCR
- —
- Eligible?
- —
Short-term bridge; refi at stabilization.
Rent comps 14 comps
| Address | Beds | Baths | Sqft | Rent | $/sqft | DOM | Units | Dist |
|---|---|---|---|---|---|---|---|---|
| 819 S Wilson Ave Unit 819 El Reno, OK | 3.0 | 2.0 | 1200 | $1,325 | $1.10 | 3d | 1 | 0.32mi |
| 819 S Wilson Ave El Reno, OK | 3.0 | 2.0 | 1200 | $1,325 | $1.10 | 5d | 1 | 0.32mi |
| 1100 W Wade St Unit 218 El Reno, OK | 1.0 | 1.0 | 800 | $800 | $1.00 | 16d | 1 | 0.79mi |
| 1020 W Hayes St El Reno, OK | 2.0 | 2.0 | 865 | $1,250 | $1.45 | 3d | 1 | 0.84mi |
| 1320 E Cavanaugh St El Reno, OK | 3.0 | 2.0 | 1222 | $1,400 | $1.15 | 12d | 1 | 0.85mi |
| 607 N Evans Ave El Reno, OK | 2.0 | 1.0 | 1032 | $1,025 | $0.99 | 3d | 1 | 0.85mi |
| 1915 S Jensen Ave El Reno, OK | 3.0 | 1.5 | 1402 | $1,400 | $1.00 | 3d | 1 | 0.86mi |
| 702 Amity Ln El Reno, OK | 2.0 | 2.0 | 1487 | $1,550 | $1.04 | 3d | 1 | 1.08mi |
| 1518 W London St Apt 3 El Reno, OK | 2.0 | 1.0 | 750 | $795 | $1.06 | 25d | 1 | 1.12mi |
| 1543 Pavy Pkwy El Reno, OK | 3.0 | 2.0 | 1200 | $1,295 | $1.08 | 3d | 1 | 1.23mi |
| 2001 S Country Club Rd El Reno, OK | 2.0 | 1.0 | 768 | $850 | $1.11 | 22d | 1 | 1.25mi |
| 1541 Pavy Pkwy El Reno, OK | 3.0 | 2.0 | 1200 | $1,295 | $1.08 | 3d | 1 | 1.28mi |
| 1541 Pavy Pkwy El Reno, OK | 3.0 | 2.0 | 1200 | $1,295 | $1.08 | 5d | 1 | 1.28mi |
| 814 SW 25th St El Reno, OK | 3.0 | 2.0 | 1411 | $1,375 | $0.97 | 20d | 1 | 1.32mi |
Listing history 30 events
-
2026-06-21days on market $116,500 Active 83 DOM
-
2026-06-18days on market $116,500 Active 80 DOM
-
2026-06-17days on market $116,500 Active 79 DOM
-
2026-06-16days on market $116,500 Active 78 DOM
-
2026-06-15days on market $116,500 Active 77 DOM
-
2026-06-13days on market $116,500 Active 75 DOM
-
2026-06-13days on market $116,500 Active 74 DOM
-
2026-06-09days on market $116,500 Active 71 DOM
-
2026-06-08days on market $116,500 Active 70 DOM
-
2026-06-07days on market $116,500 Active 69 DOM
-
2026-06-05days on market $116,500 Active 66 DOM
-
2026-06-03days on market $116,500 Active 65 DOM
-
2026-06-02days on market $116,500 Active 64 DOM
-
2026-06-01days on market $116,500 Active 63 DOM
-
2026-05-31days on market $116,500 Active 62 DOM
-
2026-04-14price $116,500
-
2026-03-30$118,000 Active
-
2013-02-13soldstatus $70,000
-
2012-12-20soldstatus $70,000
-
2012-12-17soldstatus $70,000 212-char remark
Show marketing remark (212 chars)
MANY updates in 2008--carpet, ceiling fans, paint, light fixtures, kitchen sinks, faucets,toilet, vent lite fan in bath, front & backdoors, dishwasher, counter-tops this house is MOVE IN READY! and LIKE new!!
-
2011-12-07historical
Show marketing remark (212 chars)
MANY updates in 2008--carpet, ceiling fans, paint, light fixtures, kitchen sinks, faucets,toilet, vent lite fan in bath, front & backdoors, dishwasher, counter-tops this house is MOVE IN READY! and LIKE new!!
-
2011-12-07$69,900 212-char remark
Show marketing remark (212 chars)
MANY updates in 2008--carpet, ceiling fans, paint, light fixtures, kitchen sinks, faucets,toilet, vent lite fan in bath, front & backdoors, dishwasher, counter-tops this house is MOVE IN READY! and LIKE new!!
-
2011-07-29$72,000
-
2010-02-17soldstatus $70,000
-
2010-02-12soldstatus $69,900
-
2009-10-01$69,900
-
2009-02-02historical
-
2008-08-01$76,900
-
1998-02-05soldstatus $15,000
-
1997-07-30soldstatus $15,000
ⓘ Source: listings_history table (triggers on properties + properties_extension) + one-shot
backfill from property_details.listing_events for pre-trigger history.
Tax reassessment forecast OK · Resets to sale price
- Current annual tax
- $1,182 · $98/mo
- Projected year-2 tax
- $1,182 · $98/mo
- Expected delta
- $0/yr ($0/mo · 0.0%)
ⓘ Screening estimate from a state-policy table — verify with the county assessor before closing.
Climate risk First Street
- Flood 1/10 Low FEMA zone X (unshaded) · 0% chance over 30 yrs
- Wildfire 1/10 Low
- Heat 6/10 Major 7 d/yr ≥107°F today · 19 d/yr by 30 yrs out
- Wind 2/10 Low 2% chance of damaging wind over 30 yrs
- Air quality 2/10 Low 1 unhealthy d/yr today · 2 by 30 yrs out
Nearby sold comps map
Loading sold comps map…
Walkable amenities ~0.75 mi
Loading nearby amenities…
Taxation est. · year 1
- Rental income
- $14,923
- − Mortgage interest
- −$6,526
- − Property taxes
- −$1,182
- − Insurance
- −$582
- − Repairs & maintenance
- −$1,194
- − Management
- −$1,194
- − Depreciation
- −$3,389
- Taxable income
- $856
- Est. tax owed @ 24.0%
- −$206
- After-tax cash flow
- $2,488/yr
For passive investors: Depreciation is non-cash, so a rental often shows a tax loss while cash-flowing — sheltering income. Rental losses are passive: they offset passive income freely, and up to $25,000/yr can offset ordinary (W-2) income if you actively participate and your MAGI is under $100k (phasing out to $0 by $150k); unused losses carry forward. On sale, claimed depreciation is recaptured at up to 25%, and gains may owe capital-gains tax (a 1031 exchange can defer both). Figures are a year-1 estimate at your 24.0% rate — not tax advice; consult a CPA.
Schools (NCES district)
- District
- El Reno
- NCES district ID
- 4010650
- Math proficiency
- 12% ▼ -15.00%
- Reading proficiency
- 15% ▼ -9.00%
- Median HH income
- $44,689
- Composite
- 12.01/100
- National rank
- #9664
- State rank
- #232 of 270 in OK
Livability — El Reno
- Score
- 67/100
- State rank
- #95
- US rank
- #10933
Category grades
Schools grade is shown separately in the Schools card above.
Census & demographics
- Census place
- El Reno, OK
- County
- Canadian County · 154,341 people
- City population
- 21,387
- Metro
- Oklahoma City, OK
- Population (ZIP)
- 21,387
- Household income
- $59,915
- Rent vs Own
- Severe rent burden
- 580.0
Population outlook (Canadian County) Hauer SSP2
- Today (2025)
- 174,062 people
- By 2030
- 195,170 · +12.1%
- By 2040
- 239,293 · +37.5%
- By 2050
- 285,457 · +64.0%
- By 2075
- 403,766 · +132.0%
- By 2100
- 498,766 · +186.5%
Race, ethnicity, and origin ACS 2023
- Neighborhood character
- Predominantly White (65%)
- Race & ethnicity
- White 65% Hispanic / Latino 17% Two or more races 8% Native American 8% Black 6%
- Hispanic origin (detail)
- Mexican 14%
- Common ancestry
- Slovak 2% Serbian 2% Romanian 1%
- Foreign-born
- 5% · Canada
- Languages at home
- 89% English-only · Spanish 10%
Political lean MEDSL · Canadian
- 2024 margin
- Solid R (+40.4) · D 28.8% · R 69.2% · Other 2.0%
- 2008→2024 swing
- +11.9pp toward D · 2008: -52.2pp · 2024: -40.4pp
- All cycles
- 2024: R+40.4 2020: R+43.3 2016: R+51.2 2012: R+54.4 2008: R+52.2
Not yet ingested
- Civics
- —
Market trends
- HPI YoY
- ▼ -11.37%
- Current HPI
- 334.5896
- Rent YoY
- ▲ 4.19%
- Metro
- Oklahoma City, OK
- State GDP YoY
- ▲ 1.55%
- F500 in state
- 6
Industry mix (Fortune 500 HQ in OK)
| Industry | F500 HQs | Revenue |
|---|---|---|
| Energy | 3 | $48B |
|
||
Price history
+676.7% since first listed15 events — show timeline
- 2026-04-14 Price Changed $116,500 MLSOK
- 2026-03-30 Listed $118,000 MLSOK
- 2013-02-13 Sold (Public Records) $70,000 Public Records
- 2012-12-20 Sold (Public Records) $70,000 Public Records
- 2012-12-17 Sold (MLS) $70,000 MLSOK
- 2011-12-07 Listed $69,900 MLSOK
- 2011-12-07 Listing Removed — MLSOK
- 2011-07-29 Listed $72,000 MLSOK
- 2010-02-17 Sold (Public Records) $70,000 Public Records
- 2010-02-12 Sold (MLS) $69,900 MLSOK
- 2009-10-01 Listed $69,900 MLSOK
- 2009-02-02 Listing Removed — MLSOK
- 2008-08-01 Listed $76,900 MLSOK
- 1998-02-05 Sold (Public Records) $15,000 Public Records
- 1997-07-30 Sold (Public Records) $15,000 Public Records
Property tax history
+2.2%/yrLatest (2025): $1,182 · +6.0% YoY. Source: county tax records.
Cash-flow waterfall
monthlySold comps — $/sqft
last 12 mo · ≤1 miLoading sold comps…