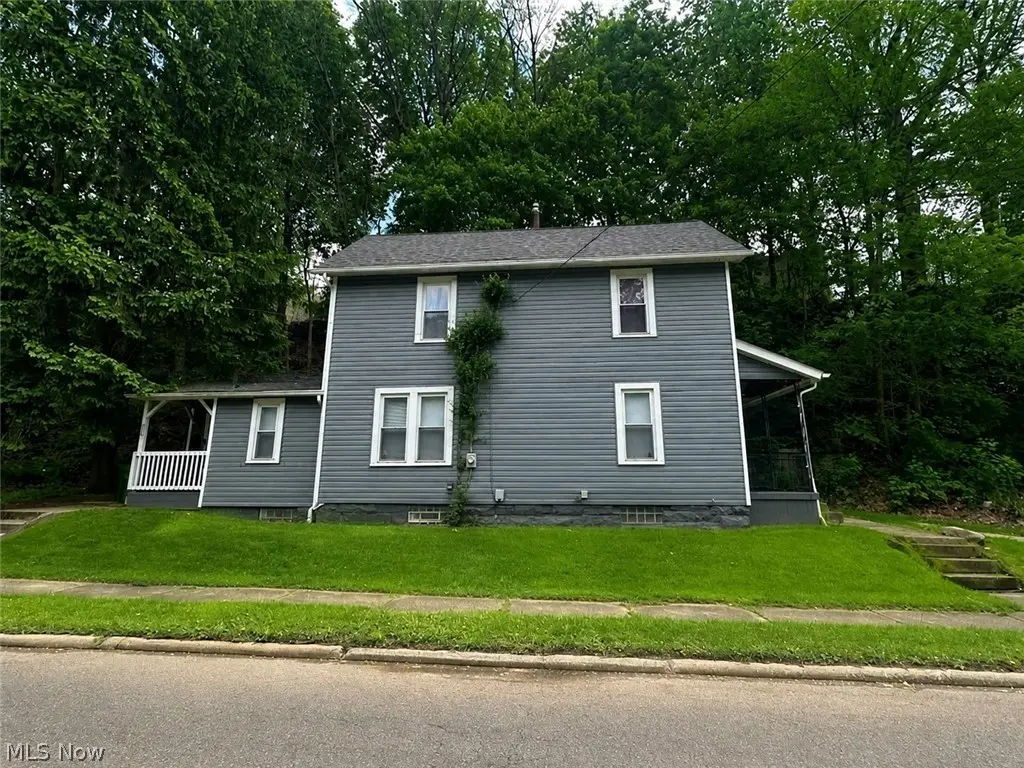
539 Tremont Ave SE · Massillon, OH
Flood risk 10/10 · Severe
- FEMA flood zone
- X (unshaded)
- Chance of flooding over 30 yrs
- 0.99%
- Est. flood insurance / yr
- $473 – $860
Fire risk 1/10 · Minimal
- Est. fire insurance / yr
- $713 – $1,323
Heat risk 3/10 · Minor
- Hot days now (above 96°F)
- 7 days/yr
- Hot days in 30 yrs
- 17 days/yr
Wind risk 1/10 · Minimal
- Chance of severe wind over 30 yrs
- —
Air-quality risk 2/10 · Minimal
- Unhealthy air days now
- 0 days/yr
- Unhealthy air days in 30 yrs
- 1 days/yr
Risk factors via First Street. Map © Google.
Why this score? — see what drove the B+ grade
The composite is a weighted blend of 9 inputs, each scored 0–100. Each bar is that input's sub-score; the figure is the points it added to the 100-point composite (weight × sub-score).
- Cash flow +29.0/30.0
- ARV discount +15.0/15.0
- DSCR +10.0/10.0
- 1% rule +7.6/10.0
- Rent growth +4.0/5.0
- Schools +4.0/10.0
- Livability +3.7/5.0
- Condition / age +2.5/5.0
- Appreciation +0.0/10.0
$92,500
🖨 Deal sheet 📄 Offer letter ✓ Due diligence
Listing remarks MLS
Opportunity to make improvements and gain equity! House needs repairs and updates. Most recently used as a rental property. Priced to sell!!
Key facts
- Bright living space
- Functional kitchen
- Spacious yard
Tags
Property features AI
Finance
- Financial info: Annual taxes reported (2024): $994
Exterior
- Parking: Parking pad
- Utilities: Public water service; Public sewer service
- Home design: Two-story home; Vinyl siding exterior; Asphalt/fiberglass roof
- Construction: Built (year per public records); Vinyl siding construction; Asphalt/Fiberglass roof
- Exterior features: Public water; Public sewer; Small lot (approximately 0.066 acres)
Interior
- Bathrooms: One full bathroom (main level)
- Heating & cooling: Gas heating
- Interior features: Finished full basement; Total of 6 rooms
Neighborhood map
What this means for you Summary
Snapshot
- This is a 2-bed/1.0-bath single-family listed at $92k.
Deal economics
- At list price, monthly cash flow is $262 ($3k/yr) — positive.
- The deal already cash-flows at list — no discount required.
- Meets the 1% rule at list price ($1k rent vs $92k).
- Recommended offer: $90k (3.0% below list) — sets the bar for market timing.
- Cap rate 10.4% vs local median 3.9% in Massillon — top-decile yield for the area; either an underpriced asset or a hidden risk that comps aren't pricing in. Stress-test before assuming the spread holds.
Location & tenants
- Location reads 74/100 on livability (#306 in OH, #4,928 nationally) — a middle-class / working-renter tenant base. Strengths: cost of living A+, housing A+, health & safety A-; Watch: employment C-, amenities F, commute F.
- Massillon City (urban): math 43% / reading 52% proficiency, ranked #487 of 656 in OH (top 74%) — families likely to look elsewhere, expect single-tenant / working-renter base with shorter leases; 60% free/reduced lunch — lower-income household profile, screen leases tightly.
- Market conditions: Rents rising fast (+6.0%/yr); 208 active listings in the ZIP; 11 comparable units currently listed for rent nearby; rentals at typical pace (median 21d on market — plan ~3-4 weeks tenant-placement turnaround); 528 units permitted in Stark County in 2024 (84 in 5+ unit buildings).
Forward outlook
- Local home prices are declining (-3.0%/yr); year-one equity from $640 of loan paydown is wiped out by about $3k of value loss. Plan a longer hold.
- Stark County population projected to shrink 8% by 2050 — rents likely to lag national; underwrite the cash flow, not the appreciation.
- At projected returns (-3.0% appreciation + 6.0% rent growth), your $26k cash investment doubles in ~8 years — after that, you're playing with house money.
Negotiation context
- It's been on market 51 days — a 3% lower offer ($90k) is reasonable based on typical stale-listing flexibility.
- 2 sale attempts since 3y ago with the ask held roughly flat each time — persistent listings suggest the price (not the market) is what's stuck; bring a comps-based counter.
- Current owner paid $20k; list at $92k implies a 362% gain — meaningful room to come down on a strong offer.
Risks & watch-outs
- Watch-outs: flood insurance adds $56/mo; built in 1891 — expect roof / HVAC / electrical / plumbing capex.
- Climate carrying-cost: severe flood risk — expect insurance premiums to compound above CPI over the hold.
Questions for the listing agent
- It's been on market 51 days. Have you received any prior offers? Is the seller open to a 3% concession, seller financing, or rate buy-down credit?
- Built in 1891 — when were the roof, HVAC, electrical panel, plumbing, and water heater last replaced?
- What's the actual annual flood-insurance premium (NFIP or private), and is the property in a SFHA with mandatory coverage?
- Is there a deadline driving the sale (1031 exchange, divorce, estate, relocation)? That informs how much negotiation room exists.
- Schools are B-rated — typically a magnet for longer-tenancy family renters. What's the average tenant stay here, and is there a school-zone premium baked into asking?
- What's the average days-on-market for RENTAL listings here right now (not sales)? A rising rental-DOM trend means longer vacancies and softer asking-rent achievability than the comps imply.
- What's the recent tenant-quality profile in this submarket — average credit score on applications, eviction rate, late-payment / NSF rate, and stable-employment percentage? A property-management company in the area should have these aggregated.
- How much new for-sale + rental construction is in the pipeline within 1–3 miles? Heavy new supply typically softens prices + rents 12–24 months out; constrained supply supports both.
Investment metrics
- 1% rule
- 1.26% ✓
- Cap rate
- 10.41%
- Cash-on-cash
- 14.70%
- DSCR
- 1.65
- GRM
- 6.6
CMA / ARV
- ARV (median comp)
- $123,449
- List price
- $92,500
- Delta
- -25.07%
- Verdict
- UNDERPRICED
- Comps
- 20 within 1.0 mi
Show comp detail 12 sales within ~0.75 mi
| Address | Dist | Beds/Ba | Sqft | Sold | Price | $/sf | Match |
|---|---|---|---|---|---|---|---|
| 217 2nd St NE | 0.46mi | 3/1.0 (+1) | 1,308 (-0%) | 1mo | $140,000 | $107 | 72 |
| 711 North Ave NE | 0.33mi | 3/1.0 (+1) | 1,362 (+4%) | 4mo | $144,500 | $106 | 70 |
| 418 9th St NE | 0.50mi | 3/1.0 (+1) | 1,248 (-5%) | 0mo | $110,000 | $88 | 63 |
| 404 Pike Ave SW | 0.74mi | 3/1.0 (+1) | 1,310 (-0%) | 0mo | $62,000 | $47 | 60 |
| 818 Wyoming Pl NE | 0.65mi | 2/1.0 | 1,248 (-5%) | 4mo | $135,000 | $108 | 59 |
| 202 Rose Ave SE | 0.26mi | 3/2.0 (+1) | 1,177 (-10%) | 4mo | $123,000 | $105 | 58 |
| 842 Seneca St NE | 0.69mi | 2/2.0 | 1,378 (+5%) | 0mo | $173,650 | $126 | 55 |
| 1221 North Ave NE | 0.48mi | 3/1.5 (+1) | 1,450 (+10%) | 2mo | $115,000 | $79 | 51 |
| 121 Chestnut Ave NE | 0.54mi | 3/1.0 (+1) | 1,456 (+11%) | 1mo | $83,000 | $57 | 51 |
| 323 Cherry Rd NE | 0.57mi | 3/1.0 (+1) | 1,188 (-10%) | 2mo | $139,000 | $117 | 51 |
| 834 Walnut Rd SE | 0.41mi | 3/2.0 (+1) | 1,148 (-12%) | 4mo | $160,000 | $139 | 48 |
| 741 1st St SE | 0.57mi | 3/1.0 (+1) | 1,144 (-13%) | 0mo | $43,050 | $38 | 47 |
Match score weights: distance 35% · size 25% · config 20% · recency 20%. Top-matched comps best support the ARV.
Projected returns pro-forma
-3.0% appreciation · 6.04% rent growth · sell at horizon
- IRR
- 5.2%
- Equity multiple
- 1.21×
- Total profit
- $5,393
- Equity at exit
- $13,792
- IRR
- 17.3%
- Equity multiple
- 2.64×
- Total profit
- $42,378
- Equity at exit
- $7,998
Cash invested: $25,900 (down + closing). Projections, not guarantees.
Landlord ↔ Tenant lean methodology
- Overall (STATE)
- 73 Landlord-Friendly
- State Ohio
- 73 Landlord-Friendly · R+6
- County
- — inherits STATE
- City
- — inherits STATE
ZIP-level market 44646
- Rents YoY
- 6.0%
- Active inventory
- 208
- Price-to-rent
- 6.6×
Monthly cashflow live
- Estimated rent
- $1,169 high interval (Pro) →
- Mortgage (P&I)
- −$485
- Tax from tax record
- −$83 /mo · $994/yr
- Insurance
- −$39
- Flood insurance flood zone
- −$56 /mo · $666/yr
- HOA
- −$0
- Vacancy / Maint / Mgmt
- −$246
- Net cashflow
- $262
Break-even live
UW: 25.0% down · 7.5% · 30yr · 1.5% tax · 5.0% vac · 8.0% maint · 8.0% mgmt
Financing live
Cash to close
- Down payment
- $23,125
- Closing costs
- $2,775
- Reserves months
- —
- Total cash needed
- —
Loan-product check · same deal, 3 products live
Conventional
25% down · 7.5% · 30yr
- Down + closing
- —
- Monthly P&I
- —
- Monthly cashflow
- —
- DSCR
- —
- Eligible?
- —
Personal DTI + credit; lowest rate.
DSCR
20% down · 8.5% · 30yr
- Down + closing
- —
- Monthly P&I
- —
- Monthly cashflow
- —
- DSCR
- —
- Eligible?
- —
No personal income docs; deal must DSCR.
Hard money
10% down · 12.0% · 12mo
- Down + closing
- —
- Monthly P&I
- —
- Monthly cashflow
- —
- DSCR
- —
- Eligible?
- —
Short-term bridge; refi at stabilization.
Rent comps 11 comps
| Address | Beds | Baths | Sqft | Rent | $/sqft | DOM | Units | Dist |
|---|---|---|---|---|---|---|---|---|
| 450 South Ave SE Massillon, OH | 2.0 | 1.5 | 1270 | $1,236 | $0.97 | 13d | 1 | 0.08mi |
| 111 Maple Ave SE Massillon, OH | 3.0 | 1.0 | 1300 | $1,050 | $0.81 | 13d | 1 | 0.56mi |
| 1715 Connecticut Ave SE Massillon, OH | 3.0 | 1.0 | 1048 | $1,200 | $1.15 | 44d | 1 | 0.58mi |
| 2200 Harsh Ave SE Massillon, OH | 1.0–2.0 | 1.0–1.5 | 811 | $1,299 | $1.60 | 13d | 1 | 1.09mi |
| 2220 Harsh Ave SE Unit 2220-HR Massillon, OH | 2.0 | 1.5 | 1080 | $1,299 | $1.20 | 21d | 1 | 1.11mi |
| 2220 Harsh Ave SE Unit 2220-HR Massillon, OH | 2.0 | 1.5 | 1080 | $1,199 | $1.11 | 44d | 1 | 1.11mi |
| 1704 13th St SE Massillon, OH | 3.0 | 1.0 | 1248 | $1,300 | $1.04 | 21d | 1 | 1.18mi |
| 1512 Forest Ave SE Massillon, OH | 3.0 | 1.0 | 1013 | $1,050 | $1.04 | 13d | 1 | 1.31mi |
| 311 Gail Ave NE Unit 325 Massillon, OH | 2.0 | 2.0 | 1082 | $1,095 | $1.01 | 13d | 1 | 1.32mi |
| 371 25th St SE Massillon, OH | 3.0 | 2.0 | 1300 | $1,325 | $1.02 | 44d | 1 | 1.34mi |
| 177 25th St SE Massillon, OH | 3.0 | 1.0 | 1260 | $1,200 | $0.95 | 21d | 1 | 1.35mi |
Listing history 21 events
-
2026-06-18days on market $92,500 Active 51 DOM
-
2026-06-17days on market $92,500 Active 50 DOM
-
2026-06-16days on market $92,500 Active 49 DOM
-
2026-06-15days on market $92,500 Active 48 DOM
-
2026-06-14days on market $92,500 Active 46 DOM
-
2026-06-13days on market $92,500 Active 45 DOM
-
2026-06-10days on market $92,500 Active 43 DOM
-
2026-06-09days on market $92,500 Active 42 DOM
-
2026-06-08days on market $92,500 Active 41 DOM
-
2026-06-07days on market $92,500 Active 40 DOM
-
2026-06-02days on market $92,500 Active 35 DOM
-
2026-06-01days on market $92,500 Active 34 DOM
-
2026-05-31days on market $92,500 Active 33 DOM
-
2026-05-30days on market $92,500 Active 32 DOM
-
2026-04-28$92,500 Active 411-char remark
-
2023-03-01soldstatus $20,000 Closed 140-char remark
Show marketing remark (140 chars)
Opportunity to make improvements and gain equity! House needs repairs and updates. Most recently used as a rental property. Priced to sell!!
-
2023-02-15status Pending 140-char remark
Show marketing remark (140 chars)
Opportunity to make improvements and gain equity! House needs repairs and updates. Most recently used as a rental property. Priced to sell!!
-
2023-02-12historical Contingent 140-char remark
Show marketing remark (140 chars)
Opportunity to make improvements and gain equity! House needs repairs and updates. Most recently used as a rental property. Priced to sell!!
-
2023-01-26price $34,900 140-char remark
Show marketing remark (140 chars)
Opportunity to make improvements and gain equity! House needs repairs and updates. Most recently used as a rental property. Priced to sell!!
-
2023-01-06$45,900 Active 140-char remark
Show marketing remark (140 chars)
Opportunity to make improvements and gain equity! House needs repairs and updates. Most recently used as a rental property. Priced to sell!!
-
1996-07-11soldstatus $10,000
ⓘ Source: listings_history table (triggers on properties + properties_extension) + one-shot
backfill from property_details.listing_events for pre-trigger history.
Tax reassessment forecast OH · Partial reset (capped growth)
- Current annual tax
- $994 · $83/mo
- Projected year-2 tax
- $1,218 · $102/mo
- Expected delta
- +$225/yr (+$19/mo · 22.6%)
ⓘ Screening estimate from a state-policy table — verify with the county assessor before closing.
Climate risk First Street
- Flood 10/10 Extreme FEMA zone X (unshaded) · 99% chance over 30 yrs
- Wildfire 1/10 Low
- Heat 3/10 Moderate 7 d/yr ≥96°F today · 17 d/yr by 30 yrs out
- Wind 1/10 Low
- Air quality 2/10 Low 0 unhealthy d/yr today · 1 by 30 yrs out
Nearby sold comps map
Loading sold comps map…
Walkable amenities ~0.75 mi
Loading nearby amenities…
Taxation est. · year 1
- Rental income
- $14,030
- − Mortgage interest
- −$5,181
- − Property taxes
- −$994
- − Insurance
- −$1,129
- − Repairs & maintenance
- −$1,122
- − Management
- −$1,122
- − Depreciation
- −$2,691
- Taxable income
- $1,790
- Est. tax owed @ 24.0%
- −$430
- After-tax cash flow
- $2,710/yr
For passive investors: Depreciation is non-cash, so a rental often shows a tax loss while cash-flowing — sheltering income. Rental losses are passive: they offset passive income freely, and up to $25,000/yr can offset ordinary (W-2) income if you actively participate and your MAGI is under $100k (phasing out to $0 by $150k); unused losses carry forward. On sale, claimed depreciation is recaptured at up to 25%, and gains may owe capital-gains tax (a 1031 exchange can defer both). Figures are a year-1 estimate at your 24.0% rate — not tax advice; consult a CPA.
Schools (NCES district)
- District
- Massillon City
- NCES district ID
- 3904435
- Math proficiency
- 43% ▼ -14.00%
- Reading proficiency
- 52% ▼ -11.00%
- Median HH income
- $38,094
- Composite
- 39.54/100
- National rank
- #3941
- State rank
- #487 of 656 in OH
Livability — Massillon
- Score
- 74/100
- State rank
- #306
- US rank
- #4928
Category grades
Schools grade is shown separately in the Schools card above.
Census & demographics
- Census place
- Massillon, OH
- County
- Stark County · 272,865 people
- City population
- 65,858
- Metro
- Canton-Massillon, OH
- Population (ZIP)
- 47,741
- Household income
- $69,179
- Rent vs Own
- Severe rent burden
- 1011.0
Population outlook (Stark County) Hauer SSP2
- Today (2025)
- 373,708 people
- By 2030
- 371,245 · -0.7%
- By 2040
- 361,331 · -3.3%
- By 2050
- 345,290 · -7.6%
- By 2075
- 302,669 · -19.0%
- By 2100
- 238,870 · -36.1%
Race, ethnicity, and origin ACS 2023
- Neighborhood character
- Predominantly White (86%)
- Race & ethnicity
- White 86% Black 7% Two or more races 5% Hispanic / Latino 3% Asian 1%
- Common ancestry
- Lithuanian 3% Romanian 2% Scandinavian 2%
- Foreign-born
- 2% · Canada, China
- Languages at home
- 97% English-only · Spanish 1% Other Indo-European 1%
Political lean MEDSL · Stark
- 2024 margin
- Strong R (+21.9) · D 38.6% · R 60.5%
- 2008→2024 swing
- -27.4pp toward R · 2008: 5.5pp · 2024: -21.9pp
- All cycles
- 2024: R+21.9 2020: R+18.5 2016: R+17.4 2012: R+0.4 2008: D+5.5
Not yet ingested
- Civics
- —
Market trends
- HPI YoY
- ▼ -190.31%
- Current HPI
- 217.8955
- Rent YoY
- ▲ 6.04%
- Metro
- Canton-Massillon, OH
- State GDP YoY
- ▲ 1.98%
- F500 in state
- 48
Industry mix (Fortune 500 HQ in OH)
| Industry | F500 HQs | Revenue |
|---|---|---|
| Insurance | 3 | $145B |
|
||
| Industrial Machinery | 3 | $49B |
|
||
| Financial Services | 3 | $24B |
|
||
| Consumer Goods | 2 | $93B |
|
||
| Aerospace / Defense | 2 | $47B |
|
||
| Utilities | 2 | $33B |
|
||
Price history
+825.0% since first listed7 events — show timeline
- 2026-04-28 Listed $92,500 MLSNOW
- 2023-03-01 Sold (MLS) $20,000 MLSNOW
- 2023-02-15 Pending — MLSNOW
- 2023-02-12 Contingent — MLSNOW
- 2023-01-26 Price Changed $34,900 MLSNOW
- 2023-01-06 Listed $45,900 MLSNOW
- 1996-07-11 Sold (Public Records) $10,000 Public Records
Property tax history
+6.5%/yrLatest (2024): $994 · +129.0% YoY. Source: county tax records.
Cash-flow waterfall
monthlySold comps — $/sqft
last 12 mo · ≤1 miLoading sold comps…