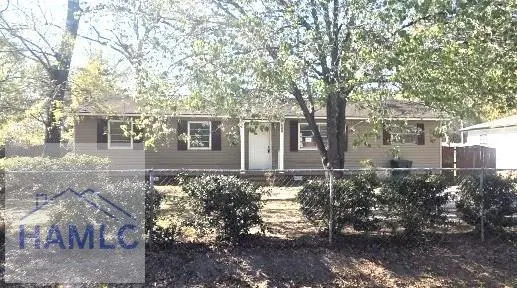
649 Eagan Rd · Hinesville, GA
Flood risk 1/10 · Minimal
- FEMA flood zone
- X (unshaded)
- Chance of flooding over 30 yrs
- 0.0%
- Est. flood insurance / yr
- $507 – $1,088
Fire risk 4/10 · Minor
- Est. fire insurance / yr
- $963 – $1,789
Heat risk 9/10 · Severe
- Hot days now (above 111°F)
- 7 days/yr
- Hot days in 30 yrs
- 18 days/yr
Wind risk 8/10 · Major
- Chance of severe wind over 30 yrs
- 99.0%
Air-quality risk 2/10 · Minimal
- Unhealthy air days now
- 2 days/yr
- Unhealthy air days in 30 yrs
- 2 days/yr
Risk factors via First Street. Map © Google.
Why this score? — see what drove the B+ grade
The composite is a weighted blend of 9 inputs, each scored 0–100. Each bar is that input's sub-score; the figure is the points it added to the 100-point composite (weight × sub-score).
- Cash flow +30.0/30.0
- ARV discount +15.0/15.0
- DSCR +10.0/10.0
- 1% rule +9.9/10.0
- Rent growth +3.9/5.0
- Livability +3.7/5.0
- Condition / age +2.5/5.0
- Schools +2.0/10.0
- Appreciation +0.0/10.0
$115,000
🖨 Deal sheet 📄 Offer letter ✓ Due diligence
Listing remarks
Easy to View, Fenced yard front and back yard. ALL offers must be submitted at www. vrmproperties.com. Agents must register as a User, enter the property address, and click on “Start Offer”. This property may qualify for Seller Financing (Vendee). If theProperty was built before 1978, lead-based paint Potentially Exists. IMPORTANT: If the Seller selects your offer, the Sales Contract will be generated using the data entered into the website. To avoid delays in executing the Sales Contract, please enter data as you want it to appear on the Sales Contract, SOLD AS IS. Pre-Approval Letter and EM made out to Closing Attorney
Key facts
- Fenced yard back
- Fenced yard front
- 0.25 acre lot
Tags
Neighborhood map
What this means for you Summary
Snapshot
- This is a 3-bed/1.0-bath single-family listed at $115k.
Deal economics
- At list price, monthly cash flow is $532 ($6k/yr) — positive.
- The deal already cash-flows at list — no discount required.
- Meets the 1% rule at list price ($2k rent vs $115k).
- Cap rate 11.8% vs local median 5.2% in Hinesville — top-decile yield for the area; either an underpriced asset or a hidden risk that comps aren't pricing in. Stress-test before assuming the spread holds.
Location & tenants
- Location reads 73/100 on livability (#51 in GA) — a middle-class / working-renter tenant base. Strengths: cost of living A+, housing A+, health & safety A+; Watch: schools D+, commute D+, crime F.
- Liberty County (urban): math 19% / reading 28% proficiency, ranked #133 of 174 in GA (top 76%) — low school quality limits family demand, transient renter base, plan for 1-2y turnover.
- Market conditions: Rents rising fast (+5.4%/yr); 612 active listings in the ZIP; 27 comparable units currently listed for rent nearby; rentals lingering (median 44d on market — plan ~5-8 weeks vacancy on turnover, expect pricing pressure); 100% of comp listings sitting > 30 days — soft ceiling on asking rent; 471 units permitted in Liberty County in 2024 (0 in 5+ unit buildings).
- This rent runs 34% of the median local income ($60k/yr) — at the standard rent-burdened threshold; future hikes will face affordability resistance.
Forward outlook
- Local home prices are declining (-3.0%/yr); year-one equity from $795 of loan paydown is wiped out by about $3k of value loss. Plan a longer hold.
- Liberty County population projected to shrink 8% by 2050 — rents likely to lag national; underwrite the cash flow, not the appreciation.
- At projected returns (-3.0% appreciation + 5.4% rent growth), your $32k cash investment doubles in ~6 years — after that, you're playing with house money.
Negotiation context
- Only 13 days on market — expect competitive offers; lowballing is unlikely to land.
Risks & watch-outs
- Climate carrying-cost: severe wind risk, 99% chance of damaging wind over 30y; extreme-heat days projected 7→18/yr by 2055 (HVAC capex compounding) — expect insurance premiums to compound above CPI over the hold.
Questions for the listing agent
- Built in 1977 — when were the roof, HVAC, electrical panel, plumbing, and water heater last replaced?
- Is there a deadline driving the sale (1031 exchange, divorce, estate, relocation)? That informs how much negotiation room exists.
- Schools are D-rated, which usually means shorter tenancies and higher turnover. Who's the typical renter profile here, and what's been the actual vacancy rate?
- Crime grade is F in this area — have there been break-ins, vandalism, or insurance claims at this property in the last 3 years? What carrier currently insures it and at what premium?
- What's the average days-on-market for RENTAL listings here right now (not sales)? A rising rental-DOM trend means longer vacancies and softer asking-rent achievability than the comps imply.
- What's the recent tenant-quality profile in this submarket — average credit score on applications, eviction rate, late-payment / NSF rate, and stable-employment percentage? A property-management company in the area should have these aggregated.
- How much new for-sale + rental construction is in the pipeline within 1–3 miles? Heavy new supply typically softens prices + rents 12–24 months out; constrained supply supports both.
Investment metrics
- 1% rule
- 1.49% ✓
- Cap rate
- 11.84%
- Cash-on-cash
- 19.82%
- DSCR
- 1.88
- GRM
- 5.6
CMA / ARV
- ARV (on-the-fly)
- $205,920
- Comps found
- 12
Show comp detail 12 sales within ~0.75 mi
| Address | Dist | Beds/Ba | Sqft | Sold | Price | $/sf | Match |
|---|---|---|---|---|---|---|---|
| 657 Maxwell St | 0.06mi | 3/1.5 | 1,260 (+1%) | 0mo | $135,000 | $107 | 93 |
| 248 Garden Cir | 0.35mi | 3/1.0 | 1,302 (+4%) | 4mo | $214,500 | $165 | 73 |
| 614 2nd St | 0.25mi | 3/1.0 | 1,400 (+12%) | 6mo | $225,000 | $161 | 63 |
| 236 Garden Cir | 0.39mi | 3/1.5 | 1,208 (-3%) | 18mo | $199,900 | $165 | 59 |
| 662 Mahoney Rd | 0.48mi | 3/2.0 | 1,196 (-4%) | 11mo | $99,000 | $83 | 57 |
| 641 2nd St | 0.23mi | 3/2.0 | 1,100 (-12%) | 11mo | $204,500 | $186 | 57 |
| 621 2nd St | 0.22mi | 3/2.0 | 1,100 (-12%) | 12mo | $209,000 | $190 | 56 |
| 480 Dykes St | 0.52mi | 3/1.0 | 1,423 (+14%) | 1mo | $210,000 | $148 | 52 |
| 455 Elm St | 0.53mi | 3/1.5 | 1,161 (-7%) | 16mo | $220,000 | $189 | 49 |
| 620 Trevor St | 0.65mi | 3/2.0 | 1,364 (+9%) | 11mo | $175,000 | $128 | 41 |
| 22 Palm Dr | 0.68mi | 3/2.0 | 1,330 (+7%) | 16mo | $250,000 | $188 | 40 |
| 746 Robin Hood Dr | 0.75mi | 3/2.0 | 1,366 (+10%) | 19mo | $235,000 | $172 | 30 |
Match score weights: distance 35% · size 25% · config 20% · recency 20%. Top-matched comps best support the ARV.
Projected returns pro-forma
-3.0% appreciation · 5.41% rent growth · sell at horizon
- IRR
- 14.7%
- Equity multiple
- 1.61×
- Total profit
- $19,520
- Equity at exit
- $17,147
- IRR
- 25.2%
- Equity multiple
- 3.46×
- Total profit
- $79,083
- Equity at exit
- $9,943
Cash invested: $32,200 (down + closing). Projections, not guarantees.
Landlord ↔ Tenant lean methodology
- Overall (STATE)
- 90 Strongly Landlord-Friendly
- State Georgia
- 90 Strongly Landlord-Friendly · R+3
- County
- — inherits STATE
- City
- — inherits STATE
ZIP-level market 31313
- Home prices YoY
- -27.1%
- Rents YoY
- 5.4%
- Active inventory
- 612
- Price-to-rent
- 5.6×
Monthly cashflow live
- Estimated rent
- $1,710 high interval (Pro) →
- Mortgage (P&I)
- −$603
- Tax from tax record
- −$168 /mo · $2,020/yr
- Insurance
- −$48
- HOA
- −$0
- Vacancy / Maint / Mgmt
- −$359
- Net cashflow
- $532
Break-even live
UW: 25.0% down · 7.5% · 30yr · 1.5% tax · 5.0% vac · 8.0% maint · 8.0% mgmt
Financing live
Cash to close
- Down payment
- $28,750
- Closing costs
- $3,450
- Reserves months
- —
- Total cash needed
- —
Loan-product check · same deal, 3 products live
Conventional
25% down · 7.5% · 30yr
- Down + closing
- —
- Monthly P&I
- —
- Monthly cashflow
- —
- DSCR
- —
- Eligible?
- —
Personal DTI + credit; lowest rate.
DSCR
20% down · 8.5% · 30yr
- Down + closing
- —
- Monthly P&I
- —
- Monthly cashflow
- —
- DSCR
- —
- Eligible?
- —
No personal income docs; deal must DSCR.
Hard money
10% down · 12.0% · 12mo
- Down + closing
- —
- Monthly P&I
- —
- Monthly cashflow
- —
- DSCR
- —
- Eligible?
- —
Short-term bridge; refi at stabilization.
Rent comps 27 comps
| Address | Beds | Baths | Sqft | Rent | $/sqft | DOM | Units | Dist |
|---|---|---|---|---|---|---|---|---|
| 635 Maxwell St Hinesville, GA | 3.0 | 1.0 | 950 | $1,700 | $1.79 | 43d | 1 | 0.11mi |
| 727 S Main St Hinesville, GA | 2.0–3.0 | 1.5 | 1286 | $1,450 | $1.13 | 43d | 3 | 0.18mi |
| 220 Garden Cir Hinesville, GA | 3.0 | 1.5 | 1323 | $1,650 | $1.25 | 43d | 1 | 0.31mi |
| 250 Garden Cir Hinesville, GA | 3.0 | 2.0 | 1140 | $1,750 | $1.54 | 43d | 1 | 0.33mi |
| 662 Mahoney Rd Hinesville, GA | 3.0 | 2.0 | 1196 | $1,795 | $1.50 | 43d | 1 | 0.47mi |
| 814 Lesa St Hinesville, GA | 2.0 | 1.5 | 1152 | $950 | $0.82 | 43d | 1 | 0.63mi |
| 134 Pointe South Dr Hinesville, GA | 2.0 | 1.0 | 840 | $1,195 | $1.42 | 43d | 1 | 0.71mi |
| 131 Pointe South Dr Hinesville, GA | 2.0 | 1.0 | 960 | $1,950 | $2.03 | 43d | 1 | 0.74mi |
| 732 Fleming Rd Hinesville, GA | 3.0 | 1.5 | 1348 | $1,400 | $1.04 | 43d | 1 | 0.80mi |
| 710 Little John Dr Hinesville, GA | 3.0 | 2.0 | 1459 | $1,700 | $1.17 | 43d | 1 | 0.85mi |
| 910 Brett Dr Hinesville, GA | 2.0–3.0 | 2.0 | 957 | $1,600 | $1.67 | 43d | 4 | 0.92mi |
| 910 Brett Dr Hinesville, GA | 2.0–3.0 | 2.0 | 957 | $1,600 | $1.67 | 44d | 3 | 0.92mi |
| 905 King Air Ct Hinesville, GA | 3.0 | 2.0 | 1407 | $1,750 | $1.24 | 43d | 1 | 0.93mi |
| 916 Mandarin Dr Hinesville, GA | 3.0 | 2.0 | 1433 | $1,550 | $1.08 | 43d | 1 | 0.95mi |
| 912 Pineland Ave Hinesville, GA | 3.0 | 2.5 | 1428 | $1,648 | $1.15 | 43d | 1 | 1.01mi |
| 1012 White Cir Hinesville, GA | 3.0 | 1.0 | 1050 | $1,300 | $1.24 | 43d | 1 | 1.01mi |
| 205 Bagley Ave Unit B Hinesville, GA | 3.0 | 2.0 | 1071 | $1,850 | $1.73 | 43d | 1 | 1.06mi |
| 613 Franklin St Hinesville, GA | 3.0 | 2.0 | 1464 | $1,750 | $1.20 | 43d | 1 | 1.10mi |
| 712 Mill Creek Cir Hinesville, GA | 4.0 | 2.0 | 1456 | $1,900 | $1.30 | 43d | 1 | 1.13mi |
| 108 Cherokee Cir Hinesville, GA | 3.0 | 2.0 | 1208 | $1,275 | $1.06 | 43d | 1 | 1.18mi |
| 172 Cherokee Cir Hinesville, GA | 3.0 | 2.0 | 1290 | $1,550 | $1.20 | 43d | 1 | 1.24mi |
| 1303 Veterans Pkwy Hinesville, GA | 1.0–3.0 | 1.0–2.0 | 1048 | $1,750 | $1.67 | 43d | 8 | 1.42mi |
| 255 Glenn Bryant Rd Hinesville, GA | 3.0 | 1.0 | 1075 | $1,700 | $1.58 | 43d | 1 | 1.43mi |
| 822 Lost Grove Ln Hinesville, GA | 3.0 | 2.0 | 1080 | $1,650 | $1.53 | 44d | 1 | 1.43mi |
| 350 Beverly St #124 Hinesville, GA | 3.0 | 2.0 | 1228 | $1,400 | $1.14 | 43d | 1 | 1.44mi |
| 1100 Pineland Ave Hinesville, GA | 2.0 | 2.5 | 1412 | $1,575 | $1.12 | 43d | 2 | 1.45mi |
| 286 Whitetail Cir Hinesville, GA | 3.0 | 2.0 | 1274 | $1,600 | $1.26 | 43d | 1 | 1.48mi |
Listing history 2 events
-
2026-04-21status Pending
-
2026-04-07$115,000 Active
ⓘ Source: listings_history table (triggers on properties + properties_extension) + one-shot
backfill from property_details.listing_events for pre-trigger history.
Tax reassessment forecast GA · Resets to sale price
- Current annual tax
- $2,020 · $168/mo
- Projected year-2 tax
- $2,020 · $168/mo
- Expected delta
- $0/yr ($0/mo · 0.0%)
ⓘ Screening estimate from a state-policy table — verify with the county assessor before closing.
Climate risk First Street
- Flood 1/10 Low FEMA zone X (unshaded) · 0% chance over 30 yrs
- Wildfire 4/10 Moderate
- Heat 9/10 Extreme 7 d/yr ≥111°F today · 18 d/yr by 30 yrs out
- Wind 8/10 Severe 99% chance of damaging wind over 30 yrs
- Air quality 2/10 Low 2 unhealthy d/yr today · 2 by 30 yrs out
Nearby sold comps map
Loading sold comps map…
Walkable amenities ~0.75 mi
Loading nearby amenities…
Taxation est. · year 1
- Rental income
- $20,522
- − Mortgage interest
- −$6,442
- − Property taxes
- −$2,020
- − Insurance
- −$575
- − Repairs & maintenance
- −$1,642
- − Management
- −$1,642
- − Depreciation
- −$3,345
- Taxable income
- $4,857
- Est. tax owed @ 24.0%
- −$1,166
- After-tax cash flow
- $5,215/yr
For passive investors: Depreciation is non-cash, so a rental often shows a tax loss while cash-flowing — sheltering income. Rental losses are passive: they offset passive income freely, and up to $25,000/yr can offset ordinary (W-2) income if you actively participate and your MAGI is under $100k (phasing out to $0 by $150k); unused losses carry forward. On sale, claimed depreciation is recaptured at up to 25%, and gains may owe capital-gains tax (a 1031 exchange can defer both). Figures are a year-1 estimate at your 24.0% rate — not tax advice; consult a CPA.
Schools (NCES district)
- District
- Liberty County
- NCES district ID
- 1303300
- Math proficiency
- 19% ▼ -16.00%
- Reading proficiency
- 28% ▼ -13.00%
- Median HH income
- $43,911
- Composite
- 20.2/100
- National rank
- #8630
- State rank
- #133 of 174 in GA
Livability — Hinesville
- Score
- 73/100
- State rank
- #51
- US rank
- #5200
Category grades
Schools grade is shown separately in the Schools card above.
Census & demographics
- Census place
- Hinesville, GA
- County
- Liberty County · 58,565 people
- City population
- 42,838
- Metro
- Hinesville, GA
- Population (ZIP)
- 42,838
- Household income
- $60,233
- Rent vs Own
- Severe rent burden
- 1693.0
Population outlook (Liberty County) Hauer SSP2
- Today (2025)
- 58,689 people
- By 2030
- 57,670 · -1.7%
- By 2040
- 55,750 · -5.0%
- By 2050
- 54,155 · -7.7%
- By 2075
- 58,947 · +0.4%
- By 2100
- 66,919 · +14.0%
Race, ethnicity, and origin ACS 2023
- Neighborhood character
- Diverse neighborhood (Simpson 0.67)
- Race & ethnicity
- Black 47% White 31% Hispanic / Latino 13% Two or more races 11% Asian 2%
- Hispanic origin (detail)
- Mexican 4% Puerto Rican 7%
- Common ancestry
- Slovak 1% Italian 1% Lithuanian 1%
- Foreign-born
- 7% · Canada, South Korea
- Languages at home
- 86% English-only · Spanish 7% Other Indo-European 2% German/W. Germanic 1%
Political lean MEDSL · Liberty
- 2024 margin
- D (+17.4) · D 58.5% · R 41.0%
- 2008→2024 swing
- -10.9pp toward R · 2008: 28.4pp · 2024: 17.4pp
- All cycles
- 2024: D+17.4 2020: D+24.1 2016: D+21.2 2012: D+30.2 2008: D+28.4
Not yet ingested
- Civics
- —
Market trends
- HPI YoY
- ▼ -77.50%
- Current HPI
- 208.0927
- Rent YoY
- ▲ 5.41%
- Metro
- Hinesville, GA
- State GDP YoY
- ▲ 2.66%
- F500 in state
- 28
Industry mix (Fortune 500 HQ in GA)
| Industry | F500 HQs | Revenue |
|---|---|---|
| Paper / Packaging | 2 | $29B |
|
||
| Retail | 1 | $160B |
|
||
| Transportation / Logistics | 1 | $91B |
|
||
| Airlines | 1 | $62B |
|
||
| Consumer Goods | 1 | $47B |
|
||
| Utilities | 1 | $25B |
|
||
Price history
2 events — show timeline
- 2026-04-21 Pending — HABR
- 2026-04-07 Listed $115,000 HABR
Property tax history
+3.7%/yrLatest (2025): $2,020 · +3.1% YoY. Source: county tax records.
Cash-flow waterfall
monthlySold comps — $/sqft
last 12 mo · ≤1 miLoading sold comps…