 🏗️ New Construction
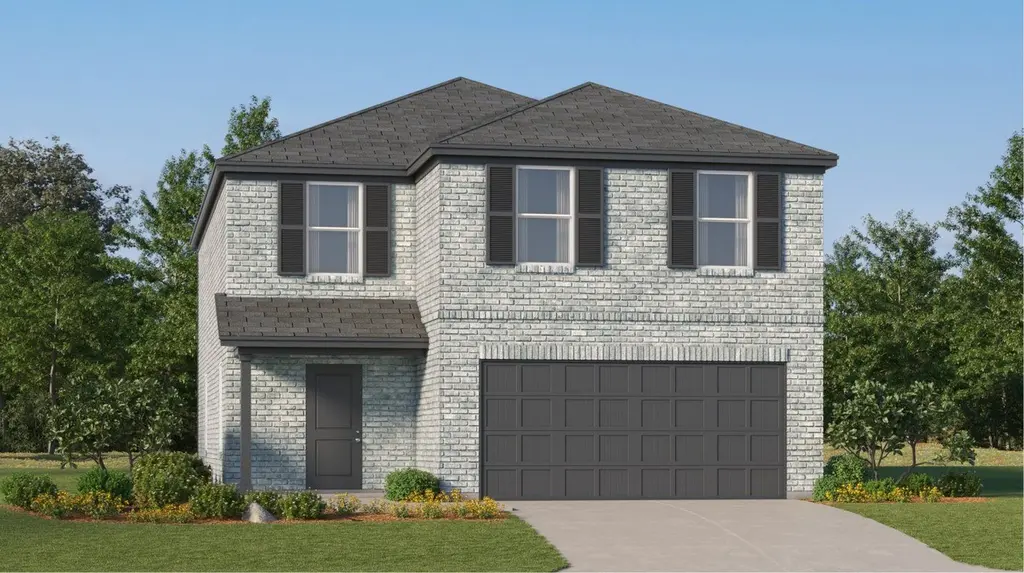
Barlow Plan · Baytown, TX
Flood risk 1/10 · Minimal
- FEMA flood zone
- X (unshaded)
- Chance of flooding over 30 yrs
- 0.0%
- Est. flood insurance / yr
- $507 – $1,088
Fire risk 3/10 · Minor
- Est. fire insurance / yr
- $1,222 – $2,270
Heat risk 9/10 · Severe
- Hot days now (above 110°F)
- 7 days/yr
- Hot days in 30 yrs
- 26 days/yr
Wind risk 9/10 · Severe
- Chance of severe wind over 30 yrs
- 99.0%
Air-quality risk 2/10 · Minimal
- Unhealthy air days now
- 1 days/yr
- Unhealthy air days in 30 yrs
- 2 days/yr
Risk factors via First Street. Map © Google.
Why this score? — see what drove the F grade
The composite is a weighted blend of 9 inputs, each scored 0–100. Each bar is that input's sub-score; the figure is the points it added to the 100-point composite (weight × sub-score).
- ARV discount +7.5/15.0
- Cash flow +5.9/30.0
- Livability +3.5/5.0
- Schools +3.2/10.0
- Rent growth +2.9/5.0
- Condition / age +2.5/5.0
- 1% rule +1.3/10.0
- DSCR +0.3/10.0
- Appreciation +0.0/10.0
$294,990
🖨 Deal sheet (PDF) 📄 Offer letter ✓ Due diligence
Listing remarks MLS
This new two-story home is host to an open-concept floorplan on the first level combining the kitchen, dining area and family room for effortless entertaining and multitasking. A versatile game room is located upstairs near four bedrooms, including the luxe owner's suite with a spa-inspired bathroom and generous walk-in closet.
Key facts
- 2 garage spots
- Listed 358 days
Neighborhood map
What this means for you Summary
Snapshot
- This is a 4-bed/2.5-bath single-family listed at $295k.
Deal economics
- At list price, monthly cash flow is $-721 ($-9k/yr) — negative.
- To cash-flow at today's rent, offer at most $268k (9.2% below list).
- To meet the 1% rule (rent ≥ 1% of price), the offer needs to be $234k (20.6% below list).
- Recommended offer: $234k (20.6% below list) — sets the bar for 1% rule.
Location & tenants
- Location reads 69/100 on livability (#412 in TX) — a middle-class / working-renter tenant base. Strengths: cost of living A+, housing A+; Watch: employment D+, crime F, amenities F.
- Goose Creek CISD (urban): math 37% / reading 36% proficiency, ranked #473 of 826 in TX (top 57%) — families likely to look elsewhere, expect single-tenant / working-renter base with shorter leases; 61% free/reduced lunch — lower-income household profile, screen leases tightly.
- Zoned schools: Banuelos El (math 33% / reading 34%, grade F, #2,174 of 4,322 statewide, top 51%, 765 students, 79% FRL); Highlands J H (math 46% / reading 37%, grade F, #595 of 1,662 statewide, top 37%, 994 students, 82% FRL); Goose Creek Memorial (math 28% / reading 45%, grade F, #924 of 1,632 statewide, top 57%, 2,223 students, 70% FRL) — zoned schools average 77% FRL vs 61% district-wide (15 pts higher); higher-poverty schools than district average — tighter screening recommended.
- Market conditions: Rents rising (+1.5%/yr); 624 active listings in the ZIP; 11 comparable units currently listed for rent nearby; rentals at typical pace (median 20d on market — plan ~3-4 weeks tenant-placement turnaround); 29,883 units permitted in Harris County in 2024 (8,621 in 5+ unit buildings).
- This rent runs 38% of the median local income ($74k/yr) — at the standard rent-burdened threshold; future hikes will face affordability resistance.
Forward outlook
- Local home prices are declining (-3.0%/yr); year-one equity from $3k of loan paydown is wiped out by about $11k of value loss. Plan a longer hold.
- Harris County population projected at +47% by 2050 — long-run rental-demand tailwind backs the buy-and-hold thesis.
Negotiation context
- It's been on market 358 days — a 12% lower offer ($260k) is reasonable based on typical stale-listing flexibility.
Risks & watch-outs
- Climate carrying-cost: severe wind risk, 99% chance of damaging wind over 30y; extreme-heat days projected 7→26/yr by 2055 (HVAC capex compounding) — expect insurance premiums to compound above CPI over the hold.
Questions for the listing agent
- What do current leases actually rent for vs. the listed asking? Can we see a recent rent roll and the last 12 months of T-12 income?
- It's been on market 358 days. Have you received any prior offers? Is the seller open to a 21% concession, seller financing, or rate buy-down credit?
- Why hasn't it sold? Are there any deal-killer items the seller is aware of (foundation, flood, title, zoning, code violations)?
- Is there a deadline driving the sale (1031 exchange, divorce, estate, relocation)? That informs how much negotiation room exists.
- Schools are D-rated, which usually means shorter tenancies and higher turnover. Who's the typical renter profile here, and what's been the actual vacancy rate?
- Crime grade is F in this area — have there been break-ins, vandalism, or insurance claims at this property in the last 3 years? What carrier currently insures it and at what premium?
- The area grade is low — what's the realistic commute time and amenity access for the typical tenant pool here? Any planned neighborhood developments (good or bad) we should know about?
- What's the average days-on-market for RENTAL listings here right now (not sales)? A rising rental-DOM trend means longer vacancies and softer asking-rent achievability than the comps imply.
- What's the recent tenant-quality profile in this submarket — average credit score on applications, eviction rate, late-payment / NSF rate, and stable-employment percentage? A property-management company in the area should have these aggregated.
- How much new for-sale + rental construction is in the pipeline within 1–3 miles? Heavy new supply typically softens prices + rents 12–24 months out; constrained supply supports both.
Investment metrics
- 1% rule
- 0.63% ✗
- Cap rate
- 3.97%
- Cash-on-cash
- -8.31%
- DSCR
- 0.63
- GRM
- 13.2
CMA / ARV
- ARV (median comp)
- $372,118
- List price
- $294,990
- Delta
- -20.73%
- Verdict
- UNDERPRICED
- Comps
- 20 within 1.0 mi
Show comp detail 12 sales within ~0.75 mi
| Address | Dist | Beds/Ba | Sqft | Sold | Price | $/sf | Match |
|---|---|---|---|---|---|---|---|
| 9231 Lowan Terrace Dr | 0.01mi | 4/2.5 | 2,039 (-10%) | 1mo | $286,990 | $141 | 83 |
| 9215 Lowan Terrace Dr | 0.11mi | 4/2.5 | 2,039 (-10%) | 1mo | $286,990 | $141 | 78 |
| 9515 Dazzling Tentacle Dr | 0.01mi | 4/2.5 | 1,968 (-13%) | 1mo | $299,990 | $152 | 78 |
| 9315 Golden Dorado Ln | 0.15mi | 4/2.0 | 2,060 (-9%) | 2mo | $308,990 | $150 | 75 |
| 9322 Golden Dorado Dr | 0.18mi | 4/2.0 | 2,060 (-9%) | 1mo | $324,990 | $158 | 75 |
| 9315 Zander Dr | 0.20mi | 4/2.0 | 2,060 (-9%) | 1mo | $324,990 | $158 | 73 |
| 5307 Yellow Perch Dr | 0.25mi | 4/2.0 | 2,060 (-9%) | 1mo | $316,990 | $154 | 71 |
| 5407 Peacock Bass Dr | 0.26mi | 4/2.0 | 2,060 (-9%) | 2mo | $312,990 | $152 | 70 |
| 5506 Sailfish Dr | 0.16mi | 4/3.0 | 2,548 (+13%) | 1mo | $397,990 | $156 | 68 |
| 9319 Zander Dr | 0.22mi | 3/2.0 (-1) | 1,949 (-14%) | 1mo | $319,990 | $164 | 59 |
| 9606 Sterling Arbor Dr | 0.58mi | 4/2.0 | 2,019 (-10%) | 1mo | $310,000 | $154 | 53 |
| 9623 Sterling Arbor Dr | 0.62mi | 4/2.0 | 1,956 (-13%) | 1mo | $292,500 | $150 | 46 |
Match score weights: distance 35% · size 25% · config 20% · recency 20%. Top-matched comps best support the ARV.
Projected returns pro-forma
-3.0% appreciation · 1.48% rent growth · sell at horizon
- IRR
- -32.6%
- Equity multiple
- -0.05×
- Total profit
- $-109,741
- Equity at exit
- $55,484
- IRR
- -48.3%
- Equity multiple
- -0.62×
- Total profit
- $-168,626
- Equity at exit
- $32,174
Cash invested: $104,193 (down + closing). Projections, not guarantees.
Landlord ↔ Tenant lean methodology
- Overall (STATE)
- 87 Strongly Landlord-Friendly
- State Texas
- 87 Strongly Landlord-Friendly · R+5
- County
- — inherits STATE
- City
- — inherits STATE
ZIP-level market 77521
- Rents YoY
- 1.5%
- Active inventory
- 624
- Price-to-rent
- 10.5×
Monthly cashflow live
- Estimated rent
- $2,342 high interval (Pro) →
- Mortgage (P&I)
- −$1,951
- Tax est. 1.5%
- −$465 /mo · $5,582/yr
- Insurance
- −$155
- HOA
- −$0
- Vacancy / Maint / Mgmt
- −$492
- Net cashflow
- $-721
Break-even live
Sensitivity live
| Price | -10% $-464 | -5% $-593 | +0% $-721 | +5% $-850 | +10% $-979 |
|---|---|---|---|---|---|
| Rent | -10% $-906 | -5% $-814 | +0% $-721 | +5% $-629 | +10% $-536 |
| Rate | -1.0pp $-534 | -0.5pp $-627 | base $-721 | +0.5pp $-818 | +1.0pp $-916 |
UW: 25.0% down · 7.5% · 30yr · 1.5% tax · 5.0% vac · 8.0% maint · 8.0% mgmt
Financing live
Cash to close
- Down payment
- $93,030
- Closing costs
- $11,164
- Reserves months
- —
- Total cash needed
- —
Loan-product check · same deal, 3 products live
Conventional
25% down · 7.5% · 30yr
- Down + closing
- —
- Monthly P&I
- —
- Monthly cashflow
- —
- DSCR
- —
- Eligible?
- —
Personal DTI + credit; lowest rate.
DSCR
20% down · 8.5% · 30yr
- Down + closing
- —
- Monthly P&I
- —
- Monthly cashflow
- —
- DSCR
- —
- Eligible?
- —
No personal income docs; deal must DSCR.
Hard money
10% down · 12.0% · 12mo
- Down + closing
- —
- Monthly P&I
- —
- Monthly cashflow
- —
- DSCR
- —
- Eligible?
- —
Short-term bridge; refi at stabilization.
Rent comps 11 comps
| Address | Beds | Baths | Sqft | Rent | $/sqft | DOM | Units | Dist |
|---|---|---|---|---|---|---|---|---|
| 4606 Wild Flora Way Baytown, TX | 4.0 | 2.0 | 2279 | $2,366 | $1.04 | 14d | 1 | 0.50mi |
| 4510 Red Yucca Dr Baytown, TX | 5.0 | 3.0 | 2779 | $2,650 | $0.95 | 3d | 1 | 0.57mi |
| 6019 Standpiper Loop Baytown, TX | 4.0 | 2.0 | 1656 | $2,265 | $1.37 | 0d | 1 | 0.70mi |
| 9502 Brookside Point Dr Baytown, TX | 4.0 | 3.0 | 2119 | $2,800 | $1.32 | 45d | 1 | 0.81mi |
| 8814 Bar Harbor Dr Baytown, TX | 4.0 | 2.0 | 1683 | $1,896 | $1.13 | 26d | 1 | 0.86mi |
| 6102 Bayou Birch Ln Baytown, TX | 4.0 | 2.5 | 2709 | $2,750 | $1.02 | 26d | 1 | 0.89mi |
| 8110 Berkely Ct Baytown, TX | 4.0 | 2.0 | 1828 | $1,946 | $1.06 | 7d | 1 | 0.90mi |
| 5426 Cinnamon Lake Dr Baytown, TX | 4.0 | 2.5 | 2240 | $2,200 | $0.98 | 45d | 1 | 0.94mi |
| 8002 Sesame St Baytown, TX | 3.0 | 2.0 | 1819 | $2,100 | $1.15 | 19d | 1 | 1.08mi |
| 8026 Rosemary Dr Baytown, TX | 4.0 | 2.5 | 2390 | $2,150 | $0.90 | 45d | 1 | 1.13mi |
| 4306 Apple Ln Baytown, TX | 4.0 | 3.5 | 2713 | $2,376 | $0.88 | 0d | 1 | 1.27mi |
Listing history 14 events
-
2026-06-21days on market $294,990 Active 358 DOM
-
2026-06-18days on market $294,990 Active 355 DOM
-
2026-06-17days on market $294,990 Active 354 DOM
-
2026-06-16days on market $294,990 Active 353 DOM
-
2026-06-15days on market $294,990 Active 352 DOM
-
2026-06-13days on market $294,990 Active 350 DOM
-
2026-06-09days on market $294,990 Active 346 DOM
-
2026-06-07days on market $294,990 Active 344 DOM
-
2026-06-04days on market $294,990 Active 341 DOM
-
2026-06-03days on market $294,990 Active 340 DOM
-
2026-06-02days on market $294,990 Active 339 DOM
-
2026-06-01days on market $294,990 Active 338 DOM
-
2026-05-31days on market $294,990 Active 337 DOM
-
2025-06-28$294,990 Active 329-char remark
Show marketing remark (329 chars)
This new two-story home is host to an open-concept floorplan on the first level combining the kitchen, dining area and family room for effortless entertaining and multitasking. A versatile game room is located upstairs near four bedrooms, including the luxe owner's suite with a spa-inspired bathroom and generous walk-in closet.
ⓘ Source: listings_history table (triggers on properties + properties_extension) + one-shot
backfill from property_details.listing_events for pre-trigger history.
Climate risk First Street
- Flood 1/10 Low FEMA zone X (unshaded) · 0% chance over 30 yrs
- Wildfire 3/10 Moderate
- Heat 9/10 Extreme 7 d/yr ≥110°F today · 26 d/yr by 30 yrs out
- Wind 9/10 Extreme 99% chance of damaging wind over 30 yrs
- Air quality 2/10 Low 1 unhealthy d/yr today · 2 by 30 yrs out
Nearby sold comps map
Loading sold comps map…
Walkable amenities ~0.75 mi
Loading nearby amenities…
Taxation est. · year 1
- Rental income
- $28,104
- − Mortgage interest
- −$20,844
- − Property taxes
- −$5,582
- − Insurance
- −$1,861
- − Repairs & maintenance
- −$2,248
- − Management
- −$2,248
- − Depreciation
- −$10,825
- Taxable loss
- −$15,504
- Est. tax savings @ 24.0%
- +$3,721
- After-tax cash flow
- $-4,936/yr
For passive investors: Depreciation is non-cash, so a rental often shows a tax loss while cash-flowing — sheltering income. Rental losses are passive: they offset passive income freely, and up to $25,000/yr can offset ordinary (W-2) income if you actively participate and your MAGI is under $100k (phasing out to $0 by $150k); unused losses carry forward. On sale, claimed depreciation is recaptured at up to 25%, and gains may owe capital-gains tax (a 1031 exchange can defer both). Figures are a year-1 estimate at your 24.0% rate — not tax advice; consult a CPA.
Schools (NCES district)
- District
- Goose Creek CISD
- NCES district ID
- 4821150
- Math proficiency
- 37% ▼ -11.00%
- Reading proficiency
- 36% ▼ -4.00%
- Median HH income
- $52,468
- Composite
- 31.84/100
- National rank
- #5877
- State rank
- #473 of 826 in TX
Livability — Baytown
- Score
- 69/100
- State rank
- #412
- US rank
- #8494
Category grades
Schools grade is shown separately in the Schools card above.
Census & demographics
- County
- Harris County · 4,702,590 people
- City population
- 135,579
- Metro
- Houston-The Woodlands-Sugar Land, TX
- Population (ZIP)
- 69,038
- Household income
- $73,629
- Rent vs Own
- Severe rent burden
- 2121.0
Population outlook (Harris County) Hauer SSP2
- Today (2025)
- 5,571,493 people
- By 2030
- 6,089,821 · +9.3%
- By 2040
- 7,142,806 · +28.2%
- By 2050
- 8,185,864 · +46.9%
- By 2075
- 10,574,329 · +89.8%
- By 2100
- 12,109,958 · +117.4%
Race, ethnicity, and origin ACS 2023
- Neighborhood character
- Diverse neighborhood (Simpson 0.64)
- Race & ethnicity
- Hispanic / Latino 50% White 28% Two or more races 18% Black 17% Asian 3%
- Hispanic origin (detail)
- Mexican 42% Puerto Rican 2%
- Common ancestry
- Lithuanian 2% Slovak 1%
- Foreign-born
- 20% · Canada, Vietnam
- Languages at home
- 59% English-only · Spanish 36% French/Haitian/Cajun 1% Other Asian/Pacific 1%
Political lean MEDSL · Harris
- 2024 margin
- Lean D (+5.5) · D 52.0% · R 46.4% · Other 1.6%
- 2008→2024 swing
- +3.9pp toward D · 2008: 1.6pp · 2024: 5.5pp
- All cycles
- 2024: D+5.5 2020: D+13.3 2016: D+12.4 2012: D+0.1 2008: D+1.6
Not yet ingested
- Civics
- —
Market trends
- HPI YoY
- ▼ -154.80%
- Current HPI
- 246.1892
- Rent YoY
- ▲ 1.48%
- Metro
- Houston-The Woodlands-Sugar Land, TX
- State GDP YoY
- ▲ 3.95%
- F500 in state
- 110
Industry mix (Fortune 500 HQ in TX)
| Industry | F500 HQs | Revenue |
|---|---|---|
| Energy | 16 | $1,198B |
|
||
| Technology | 5 | $198B |
|
||
| Engineering / Construction | 4 | $72B |
|
||
| Energy Services | 3 | $60B |
|
||
| Utilities | 3 | $41B |
|
||
| Healthcare | 2 | $330B |
|
||
Price history
1 event — show timeline
- 2025-06-28 Listed $294,990 Zillow
Cash-flow waterfall
monthlySold comps — $/sqft
last 12 mo · ≤1 miLoading sold comps…