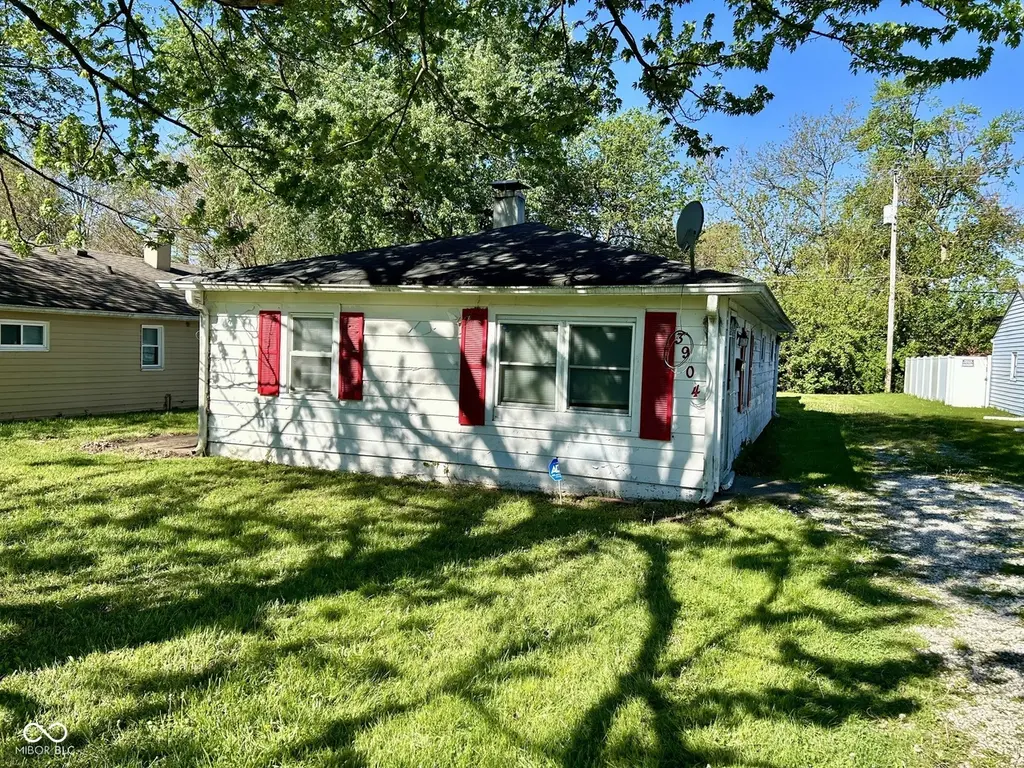
3904 N Graham Ave · Indianapolis city (balance), IN
Flood risk 1/10 · Minimal
- FEMA flood zone
- X (unshaded)
- Chance of flooding over 30 yrs
- 0.0%
- Est. flood insurance / yr
- $507 – $1,088
Fire risk 1/10 · Minimal
- Est. fire insurance / yr
- $717 – $1,331
Heat risk 3/10 · Minor
- Hot days now (above 101°F)
- 7 days/yr
- Hot days in 30 yrs
- 18 days/yr
Wind risk 2/10 · Minimal
- Chance of severe wind over 30 yrs
- 0.0%
Air-quality risk 4/10 · Minor
- Unhealthy air days now
- 5 days/yr
- Unhealthy air days in 30 yrs
- 7 days/yr
Risk factors via First Street. Map © Google.
Why this score? — see what drove the B- grade
The composite is a weighted blend of 9 inputs, each scored 0–100. Each bar is that input's sub-score; the figure is the points it added to the 100-point composite (weight × sub-score).
- Cash flow +24.6/30.0
- ARV discount +15.0/15.0
- DSCR +7.9/10.0
- 1% rule +7.0/10.0
- Rent growth +4.2/5.0
- Livability +2.5/5.0
- Condition / age +2.5/5.0
- Schools +1.4/10.0
- Appreciation +0.0/10.0
$109,900
🖨 Deal sheet 📄 Offer letter ✓ Due diligence
Listing remarks MLS
HUD HOME SOLD IN AS-IS CONDITION. CASE NUMBER: 151-782166. INS STATUS: UI 203K ELIGIBLE. REPL BATHROOM FLOORING AND CARPET THROUGHOUT; REPAIR WALLS AND SIDING; THERE IS AN UNDERGROUND TANKER ON THIS PROPERTY; EVD OF LBP
Key facts
- Newer hvac system
- 7,405 sq ft lot
- 2 garage spots
Tags
Neighborhood map
What this means for you Summary
Snapshot
- This is a 3-bed/1.0-bath single-family listed at $110k.
Deal economics
- At list price, monthly cash flow is $227 ($3k/yr) — positive.
- The deal already cash-flows at list — no discount required.
- Meets the 1% rule at list price ($1k rent vs $110k).
- Cap rate 8.8% vs local median 4.4% in Indianapolis city (balance) — top-decile yield for the area; either an underpriced asset or a hidden risk that comps aren't pricing in. Stress-test before assuming the spread holds.
Location & tenants
- Location reads: area grade B — affects rentability + tenant quality, not the cash-flow math above.
- Indianapolis Public Schools (urban): math 14% / reading 20% proficiency, ranked #286 of 301 in IN (top 95%) — low school quality limits family demand, transient renter base, plan for 1-2y turnover; 77% free/reduced lunch — lower-income household profile, screen leases tightly.
- Market conditions: Rents rising fast (+6.8%/yr); 151 active listings in the ZIP; 40 comparable units currently listed for rent nearby; rentals at typical pace (median 24d on market — plan ~3-4 weeks tenant-placement turnaround); 42% of comp listings sitting > 30 days — soft ceiling on asking rent; 1,906 units permitted in Marion County in 2024 (621 in 5+ unit buildings).
- This rent runs 31% of the median local income ($50k/yr) — at the standard rent-burdened threshold; future hikes will face affordability resistance.
Forward outlook
- Local home prices are declining (-3.0%/yr); year-one equity from $760 of loan paydown is wiped out by about $3k of value loss. Plan a longer hold.
- Marion County population projected at +18% by 2050 — long-run rental-demand tailwind backs the buy-and-hold thesis.
- At projected returns (-3.0% appreciation + 6.8% rent growth), your $31k cash investment doubles in ~8 years — after that, you're playing with house money.
Negotiation context
- Only 2 days on market — expect competitive offers; lowballing is unlikely to land.
- 3 sale attempts since 22y ago with the ask held roughly flat each time — persistent listings suggest the price (not the market) is what's stuck; bring a comps-based counter.
- Current owner paid $18k; list at $110k implies a 511% gain — meaningful room to come down on a strong offer.
Risks & watch-outs
- Watch-outs: built in 1956 — expect roof / HVAC / electrical / plumbing capex.
Questions for the listing agent
- Built in 1956 — when were the roof, HVAC, electrical panel, plumbing, and water heater last replaced?
- Is there a deadline driving the sale (1031 exchange, divorce, estate, relocation)? That informs how much negotiation room exists.
- What's the average days-on-market for RENTAL listings here right now (not sales)? A rising rental-DOM trend means longer vacancies and softer asking-rent achievability than the comps imply.
- What's the recent tenant-quality profile in this submarket — average credit score on applications, eviction rate, late-payment / NSF rate, and stable-employment percentage? A property-management company in the area should have these aggregated.
- How much new for-sale + rental construction is in the pipeline within 1–3 miles? Heavy new supply typically softens prices + rents 12–24 months out; constrained supply supports both.
Investment metrics
- 1% rule
- 1.20% ✓
- Cap rate
- 8.77%
- Cash-on-cash
- 8.84%
- DSCR
- 1.39
- GRM
- 6.9
CMA / ARV
- ARV (on-the-fly)
- $137,160
- Comps found
- 12
Show comp detail 12 sales within ~0.75 mi
| Address | Dist | Beds/Ba | Sqft | Sold | Price | $/sf | Match |
|---|---|---|---|---|---|---|---|
| 3904 N Graham Ave | 0.00mi | 3/1.0 | 1,080 (0%) | 1mo | $107,000 | $99 | 99 |
| 3536 N Priscilla Ct | 0.41mi | 3/1.0 | 1,102 (+2%) | 5mo | $133,500 | $121 | 73 |
| 3607 N Graham Ave | 0.38mi | 3/1.0 | 1,102 (+2%) | 8mo | $116,000 | $105 | 72 |
| 5601 Glencoe St | 0.23mi | 3/1.0 | 1,152 (+7%) | 9mo | $173,000 | $150 | 71 |
| 3715 N Irvington Ave | 0.43mi | 4/1.0 (+1) | 1,104 (+2%) | 5mo | $120,000 | $109 | 67 |
| 3946 N Layman Ave | 0.23mi | 3/1.5 | 1,200 (+11%) | 6mo | $115,000 | $96 | 64 |
| 5660 E 34th St | 0.63mi | 3/1.5 | 1,104 (+2%) | 4mo | $115,000 | $104 | 61 |
| 3811 N Sheridan Ave | 0.55mi | 3/1.0 | 1,142 (+6%) | 4mo | $185,000 | $162 | 61 |
| 4002 N Catherwood Ave | 0.39mi | 4/1.0 (+1) | 984 (-9%) | 2mo | $125,000 | $127 | 61 |
| 4101 N Arlington Ave | 0.38mi | 3/1.0 | 944 (-13%) | 6mo | $145,000 | $154 | 56 |
| 3945 N Ridgeview Dr | 0.68mi | 3/2.0 | 1,176 (+9%) | 9mo | $177,900 | $151 | 42 |
| 3536 N Hawthorne Ln | 0.64mi | 3/2.0 | 925 (-14%) | 6mo | $149,900 | $162 | 37 |
Match score weights: distance 35% · size 25% · config 20% · recency 20%. Top-matched comps best support the ARV.
Projected returns pro-forma
-3.0% appreciation · 6.76% rent growth · sell at horizon
- IRR
- 1.5%
- Equity multiple
- 1.06×
- Total profit
- $1,869
- Equity at exit
- $16,386
- IRR
- 14.7%
- Equity multiple
- 2.41×
- Total profit
- $43,417
- Equity at exit
- $9,502
Cash invested: $30,772 (down + closing). Projections, not guarantees.
Landlord ↔ Tenant lean methodology
- Overall (STATE)
- 90 Strongly Landlord-Friendly
- State Indiana
- 90 Strongly Landlord-Friendly · R+11
- County
- — inherits STATE
- City
- — inherits STATE
ZIP-level market 46226
- Rents YoY
- 6.8%
- Active inventory
- 151
- Price-to-rent
- 6.9×
Monthly cashflow live
- Estimated rent
- $1,320 high interval (Pro) →
- Mortgage (P&I)
- −$576
- Tax from tax record
- −$194 /mo · $2,322/yr
- Insurance
- −$46
- HOA
- −$0
- Vacancy / Maint / Mgmt
- −$277
- Net cashflow
- $227
Break-even live
UW: 25.0% down · 7.5% · 30yr · 1.5% tax · 5.0% vac · 8.0% maint · 8.0% mgmt
Financing live
Cash to close
- Down payment
- $27,475
- Closing costs
- $3,297
- Reserves months
- —
- Total cash needed
- —
Loan-product check · same deal, 3 products live
Conventional
25% down · 7.5% · 30yr
- Down + closing
- —
- Monthly P&I
- —
- Monthly cashflow
- —
- DSCR
- —
- Eligible?
- —
Personal DTI + credit; lowest rate.
DSCR
20% down · 8.5% · 30yr
- Down + closing
- —
- Monthly P&I
- —
- Monthly cashflow
- —
- DSCR
- —
- Eligible?
- —
No personal income docs; deal must DSCR.
Hard money
10% down · 12.0% · 12mo
- Down + closing
- —
- Monthly P&I
- —
- Monthly cashflow
- —
- DSCR
- —
- Eligible?
- —
Short-term bridge; refi at stabilization.
Rent comps 40 comps
| Address | Beds | Baths | Sqft | Rent | $/sqft | DOM | Units | Dist |
|---|---|---|---|---|---|---|---|---|
| 3836 Priscilla Ave Indianapolis, IN | 3.0 | 1.5 | 1040 | $1,275 | $1.23 | 1d | 1 | 0.11mi |
| 5602 Glencoe St Indianapolis, IN | 3.0 | 1.0 | 1000 | $1,749 | $1.75 | 17d | 1 | 0.24mi |
| 3718 N Audubon Rd Indianapolis, IN | 3.0 | 1.0 | 875 | $1,300 | $1.49 | 23d | 1 | 0.25mi |
| 3912 N Webster Ave Indianapolis, IN | 4.0 | 1.0 | 1274 | $1,350 | $1.06 | 21d | 1 | 0.32mi |
| 3636 N Whittier Pl Indianapolis, IN | 3.0 | 1.0 | 912 | $995 | $1.09 | 7d | 1 | 0.46mi |
| 3815 N Grand Ave Unit 3815 Indianapolis, IN | 2.0 | 1.0 | 965 | $1,250 | $1.30 | 4d | 1 | 0.62mi |
| 3516 N Hawthorne Ln Indianapolis, IN | 3.0 | 1.0 | 925 | $1,225 | $1.32 | 4d | 1 | 0.68mi |
| 4404 Park Forest Ct Indianapolis, IN | 2.0 | 1.0 | 928 | $1,180 | $1.27 | 21d | 2 | 0.75mi |
| 4411 Park Forest Ct Indianapolis, IN | 2.0 | 1.0 | 928 | $1,180 | $1.27 | 43d | 1 | 0.76mi |
| 4430 Park Forest Ct Indianapolis, IN | 2.0 | 1.0 | 928 | $1,180 | $1.27 | 43d | 1 | 0.77mi |
| 3639 N Emerson Ave Indianapolis, IN | 4.0 | 1.0 | 1000 | $1,450 | $1.45 | 21d | 1 | 0.78mi |
| 4438 Park Forest Ct Indianapolis, IN | 2.0 | 1.0 | 928 | $1,180 | $1.27 | 43d | 1 | 0.80mi |
| 4437 Park Forest Ct Indianapolis, IN | 2.0 | 1.0 | 928 | $1,180 | $1.27 | 43d | 1 | 0.80mi |
| 4445 Park Forest Ct Indianapolis, IN | 2.0 | 1.0 | 928 | $1,180 | $1.27 | 2d | 1 | 0.81mi |
| 5865 E 46th St Indianapolis, IN | 3.0 | 2.0 | 1400 | $1,500 | $1.07 | 43d | 1 | 0.84mi |
| 4521 Park Forest Ct Indianapolis, IN | 2.0 | 1.0 | 700 | $1,180 | $1.69 | 3d | 1 | 0.85mi |
| 4504 Park Forest Ct Indianapolis, IN | 2.0 | 1.0 | 928 | $1,180 | $1.27 | 2d | 1 | 0.85mi |
| 4555 N Arlington Ave Indianapolis, IN | 1.0–3.0 | 1.0–1.5 | 880 | $1,379 | $1.57 | 3d | 30 | 0.88mi |
| 3319 N Hawthorne Ln Indianapolis, IN | 3.0 | 1.0 | 1084 | $1,100 | $1.01 | 23d | 1 | 0.91mi |
| 4537 Park Forest Ct Indianapolis, IN | 2.0 | 1.0 | 928 | $1,180 | $1.27 | 43d | 1 | 0.92mi |
| 4545 Park Forest Ct Indianapolis, IN | 2.0 | 1.0 | 928 | $1,180 | $1.27 | 43d | 1 | 0.92mi |
| 4405 Park Forest Ct Indianapolis, IN | 2.0 | 1.0 | 928 | $1,180 | $1.27 | 23d | 1 | 0.95mi |
| 3301 Mardenna Ave Indianapolis, IN | 3.0 | 1.0 | 925 | $1,200 | $1.30 | 43d | 1 | 0.98mi |
| 4511 N Kenmore Rd Indianapolis, IN | 4.0 | 2.0 | 1200 | $2,095 | $1.75 | 4d | 1 | 1.05mi |
| 3316 N Emerson Ave Indianapolis, IN | 3.0 | 1.0 | 912 | $1,100 | $1.21 | 23d | 1 | 1.06mi |
| 3070 N Layman Ave #1 Indianapolis, IN | 3.0 | 2.0 | 1480 | $1,700 | $1.15 | 43d | 1 | 1.07mi |
| 4307 N Edmondson Ave Indianapolis, IN | 3.0 | 1.0 | 900 | $1,299 | $1.44 | 1d | 1 | 1.13mi |
| 6563 E 46th St Indianapolis, IN | 3.0 | 1.5 | 1185 | $1,250 | $1.05 | 4d | 1 | 1.14mi |
| 3734 Manor Ct Indianapolis, IN | 3.0 | 1.0 | 1414 | $1,399 | $0.99 | 7d | 1 | 1.17mi |
| 3900 N Shadeland Ave Indianapolis, IN | 1.0–2.0 | 1.0 | 1070 | $1,075 | $1.00 | 2d | 6 | 1.23mi |
| 6005 Dickson Rd Unit 4 Indianapolis, IN | 2.0 | 1.0 | 873 | $725 | $0.83 | 43d | 1 | 1.25mi |
| 6015 Dickson Rd #1 Indianapolis, IN | 2.0 | 1.0 | 825 | $950 | $1.15 | 43d | 1 | 1.26mi |
| 4839 N Kenmore Rd Indianapolis, IN | 3.0 | 2.0 | 1215 | $1,533 | $1.26 | 21d | 1 | 1.27mi |
| 6049 Dickson Rd Apt 4 Indianapolis, IN | 2.0 | 1.0 | 750 | $950 | $1.27 | 43d | 1 | 1.28mi |
| 3332 Wallace Ave Indianapolis, IN | 3.0 | 1.0 | 936 | $1,600 | $1.71 | 23d | 1 | 1.28mi |
| 6048 Dickson Rd #3 Indianapolis, IN | 2.0 | 1.0 | 725 | $900 | $1.24 | 43d | 1 | 1.31mi |
| 6108 Dickson Rd Unit 3 Indianapolis, IN | 2.0 | 1.0 | 750 | $900 | $1.20 | 43d | 1 | 1.32mi |
| 6118 Dickson Rd Apt 3 Indianapolis, IN | 2.0 | 1.0 | 750 | $950 | $1.27 | 43d | 1 | 1.33mi |
| 6051 Laurel Hall Dr Apt 4 Indianapolis, IN | 2.0 | 1.0 | 750 | $950 | $1.27 | 43d | 1 | 1.36mi |
| 6111 Laurel Hall Dr #3 Indianapolis, IN | 2.0 | 1.0 | 725 | $950 | $1.31 | 43d | 1 | 1.37mi |
Listing history 7 events
-
2026-04-22status Pending
-
2026-04-20$109,900 Active
-
2009-10-19historical 225-char remark
Show marketing remark (225 chars)
HUD HOME SOLD IN AS-IS CONDITION. CASE NUMBER: 151-782166. INS STATUS: UI 203K ELIGIBLE. REPL BATHROOM FLOORING AND CARPET THROUGHOUT; REPAIR WALLS AND SIDING; THERE IS AN UNDERGROUND TANKER ON THIS PROPERTY; EVD OF LBP
-
2009-10-09soldstatus $18,000 225-char remark
Show marketing remark (225 chars)
HUD HOME SOLD IN AS-IS CONDITION. CASE NUMBER: 151-782166. INS STATUS: UI 203K ELIGIBLE. REPL BATHROOM FLOORING AND CARPET THROUGHOUT; REPAIR WALLS AND SIDING; THERE IS AN UNDERGROUND TANKER ON THIS PROPERTY; EVD OF LBP
-
2009-07-31$18,000 225-char remark
Show marketing remark (225 chars)
HUD HOME SOLD IN AS-IS CONDITION. CASE NUMBER: 151-782166. INS STATUS: UI 203K ELIGIBLE. REPL BATHROOM FLOORING AND CARPET THROUGHOUT; REPAIR WALLS AND SIDING; THERE IS AN UNDERGROUND TANKER ON THIS PROPERTY; EVD OF LBP
-
2005-03-30soldstatus $73,000 264-char remark
Show marketing remark (264 chars)
New Roof, New Windows, 3 bedroom home with large family room, washer and dryer hookup. Fresh Paint, New Carpet, New Vinyl, Newer Kitchen and Bath. Close to shopping and highway. Seller is motivated, show and sell tod ay. Ask about 'Seller Paid' closing cost's.
-
2004-11-10$74,900 264-char remark
Show marketing remark (264 chars)
New Roof, New Windows, 3 bedroom home with large family room, washer and dryer hookup. Fresh Paint, New Carpet, New Vinyl, Newer Kitchen and Bath. Close to shopping and highway. Seller is motivated, show and sell tod ay. Ask about 'Seller Paid' closing cost's.
ⓘ Source: listings_history table (triggers on properties + properties_extension) + one-shot
backfill from property_details.listing_events for pre-trigger history.
Tax reassessment forecast IN · Partial reset (capped growth)
- Current annual tax
- $2,322 · $194/mo
- Projected year-2 tax
- $2,322 · $194/mo
- Expected delta
- $0/yr ($0/mo · 0.0%)
ⓘ Screening estimate from a state-policy table — verify with the county assessor before closing.
Climate risk First Street
- Flood 1/10 Low FEMA zone X (unshaded) · 0% chance over 30 yrs
- Wildfire 1/10 Low
- Heat 3/10 Moderate 7 d/yr ≥101°F today · 18 d/yr by 30 yrs out
- Wind 2/10 Low 0% chance of damaging wind over 30 yrs
- Air quality 4/10 Moderate 5 unhealthy d/yr today · 7 by 30 yrs out
Nearby sold comps map
Loading sold comps map…
Walkable amenities ~0.75 mi
Loading nearby amenities…
Taxation est. · year 1
- Rental income
- $15,834
- − Mortgage interest
- −$6,156
- − Property taxes
- −$2,322
- − Insurance
- −$550
- − Repairs & maintenance
- −$1,267
- − Management
- −$1,267
- − Depreciation
- −$3,197
- Taxable income
- $1,076
- Est. tax owed @ 24.0%
- −$258
- After-tax cash flow
- $2,463/yr
For passive investors: Depreciation is non-cash, so a rental often shows a tax loss while cash-flowing — sheltering income. Rental losses are passive: they offset passive income freely, and up to $25,000/yr can offset ordinary (W-2) income if you actively participate and your MAGI is under $100k (phasing out to $0 by $150k); unused losses carry forward. On sale, claimed depreciation is recaptured at up to 25%, and gains may owe capital-gains tax (a 1031 exchange can defer both). Figures are a year-1 estimate at your 24.0% rate — not tax advice; consult a CPA.
Schools (NCES district)
- District
- Indianapolis Public Schools
- NCES district ID
- 1804770
- Math proficiency
- 14% ▼ -7.00%
- Reading proficiency
- 20% ▼ -3.00%
- Median HH income
- $32,034
- Composite
- 13.69/100
- National rank
- #9499
- State rank
- #286 of 301 in IN
Livability — Indianapolis city (balance)
No livability data for this city. (Only ~50 U.S. cities are tracked.)
Census & demographics
- Census place
- Indianapolis city (balance), IN
- County
- Marion County · 998,460 people
- City population
- 881,119
- Metro
- Indianapolis-Carmel-Anderson, IN
- Population (ZIP)
- 47,099
- Household income
- $50,325
- Rent vs Own
- Severe rent burden
- 2742.0
Population outlook (Marion County) Hauer SSP2
- Today (2025)
- 1,025,572 people
- By 2030
- 1,065,727 · +3.9%
- By 2040
- 1,141,577 · +11.3%
- By 2050
- 1,208,920 · +17.9%
- By 2075
- 1,367,288 · +33.3%
- By 2100
- 1,438,201 · +40.2%
Race, ethnicity, and origin ACS 2023
- Neighborhood character
- Diverse neighborhood (Simpson 0.62)
- Race & ethnicity
- Black 53% White 25% Hispanic / Latino 17% Two or more races 9% Asian 2%
- Hispanic origin (detail)
- Mexican 11%
- Common ancestry
- Lithuanian 1% Italian 1% Romanian 1%
- Foreign-born
- 11% · Canada
- Languages at home
- 86% English-only · Spanish 10% French/Haitian/Cajun 1% Other Asian/Pacific 1%
Political lean MEDSL · Marion
- 2024 margin
- Strong D (+27.7) · D 63.0% · R 35.3% · Other 1.7%
- 2008→2024 swing
- -0.7pp no change · 2008: 28.4pp · 2024: 27.7pp
- All cycles
- 2024: D+27.7 2020: D+29.1 2016: D+22.8 2012: D+22.2 2008: D+28.4
Not yet ingested
- Civics
- —
Market trends
- HPI YoY
- ▼ -218.85%
- Current HPI
- 239.43
- Rent YoY
- ▲ 6.76%
- Metro
- Indianapolis-Carmel-Anderson, IN
- State GDP YoY
- ▲ 2.90%
- F500 in state
- 18
Industry mix (Fortune 500 HQ in IN)
| Industry | F500 HQs | Revenue |
|---|---|---|
| Industrial Machinery | 2 | $37B |
|
||
| Healthcare | 1 | $177B |
|
||
| Pharmaceuticals | 1 | $45B |
|
||
| Metals / Steel | 1 | $18B |
|
||
| Agriculture | 1 | $17B |
|
||
| Packaging | 1 | $12B |
|
||
Price history
+46.7% since first listed7 events — show timeline
- 2026-04-22 Pending — MIBOR as Distributed by MLS Grid
- 2026-04-20 Listed $109,900 MIBOR as Distributed by MLS Grid
- 2009-10-19 Listing Removed — MIBOR as Distributed by MLS Grid
- 2009-10-09 Sold (MLS) $18,000 MIBOR as Distributed by MLS Grid
- 2009-07-31 Listed $18,000 MIBOR as Distributed by MLS Grid
- 2005-03-30 Sold (MLS) $73,000 MIBOR as Distributed by MLS Grid
- 2004-11-10 Listed $74,900 MIBOR as Distributed by MLS Grid
Property tax history
+6.3%/yrLatest (2025): $2,322 · +11.9% YoY. Source: county tax records.
Cash-flow waterfall
monthlySold comps — $/sqft
last 12 mo · ≤1 miLoading sold comps…