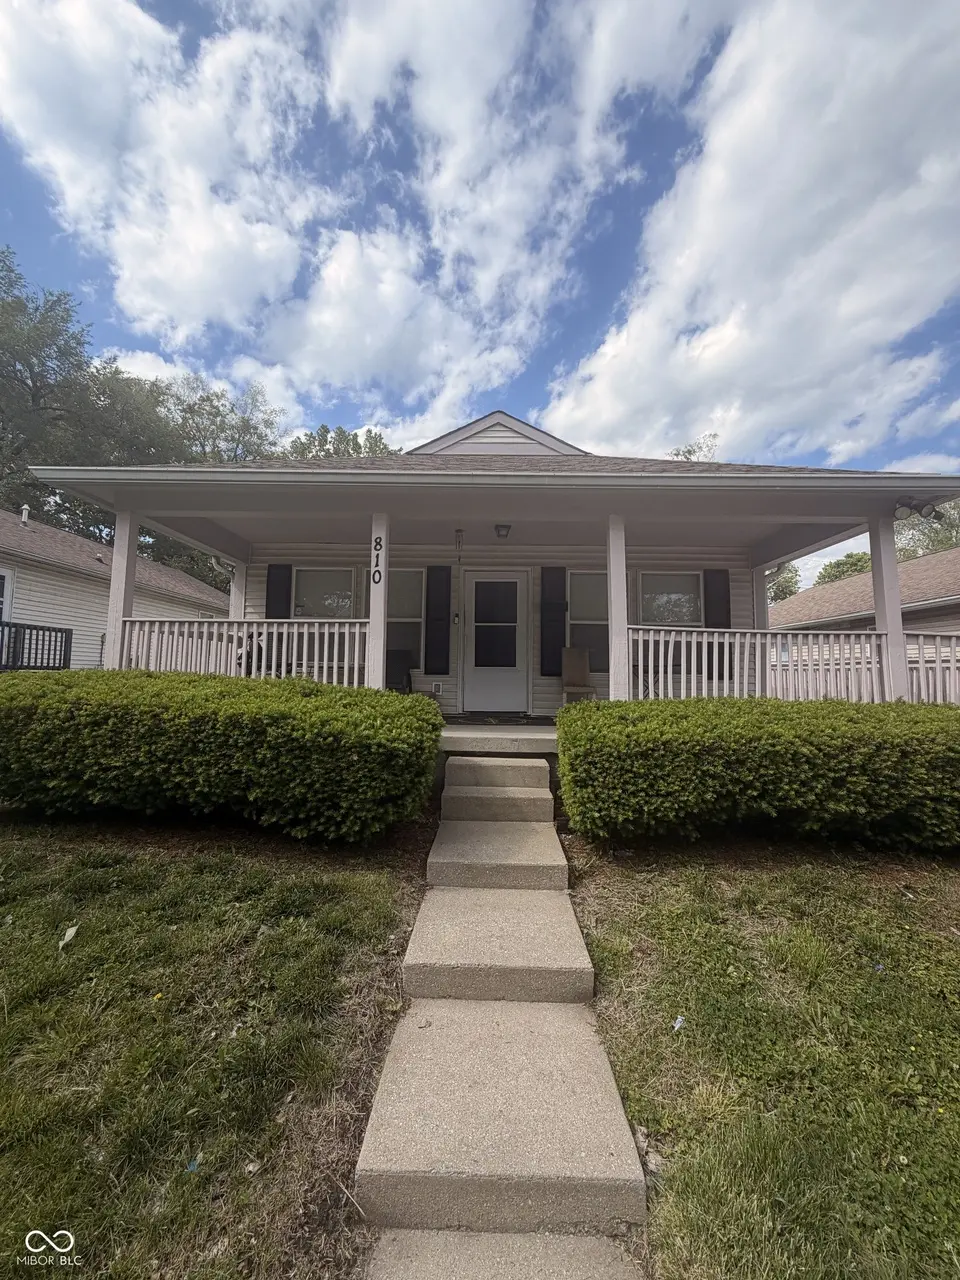
810 W 26th St · Indianapolis city (balance), IN
Flood risk 7/10 · Major
- FEMA flood zone
- X (unshaded)
- Chance of flooding over 30 yrs
- 0.76%
- Est. flood insurance / yr
- $507 – $1,088
Fire risk 1/10 · Minimal
- Est. fire insurance / yr
- $717 – $1,331
Heat risk 4/10 · Minor
- Hot days now (above 101°F)
- 7 days/yr
- Hot days in 30 yrs
- 19 days/yr
Wind risk 2/10 · Minimal
- Chance of severe wind over 30 yrs
- 0.0%
Air-quality risk 4/10 · Minor
- Unhealthy air days now
- 5 days/yr
- Unhealthy air days in 30 yrs
- 7 days/yr
Risk factors via First Street. Map © Google.
Why this score? — see what drove the C+ grade
The composite is a weighted blend of 9 inputs, each scored 0–100. Each bar is that input's sub-score; the figure is the points it added to the 100-point composite (weight × sub-score).
- Cash flow +23.0/30.0
- ARV discount +15.0/15.0
- 1% rule +7.9/10.0
- DSCR +7.4/10.0
- Rent growth +4.1/5.0
- Livability +2.5/5.0
- Condition / age +2.5/5.0
- Schools +1.4/10.0
- Appreciation +0.0/10.0
$110,000
🖨 Deal sheet 📄 Offer letter ✓ Due diligence
Listing remarks MLS
Welcome to this cozy bungalo-style home at 810 West 26th Street, Indianapolis, IN. With 3 bedrooms, 1 bathroom, and 1040 square feet of living space on a 5619 square foot lot, this property offers a relaxed vibe. It's all about location with this home. With its close proximity to downtown and entertainment. You won't want to miss the opportunity to be minutes from Lucas oil and the Indianapolis Zoo.
Key facts
- 5,619 sq ft lot
- Built 2002
Property features AI
Exterior
- Utilities: Public water; Municipal sewer
- Home design: Single-family residence; One story
- Construction: Vinyl siding; Crawl space foundation
- Exterior features: Lot less than 1/4 acre; Lot size approximately 0.13 acres
Interior
- Kitchen: No appliances included
- Bedrooms: 3 bedrooms on the main level (each approximately 10x10)
- Bathrooms: 1 full bathroom
- Heating & cooling: Natural gas heating; Central air conditioning
- Interior features: Handicap accessible interior
- Laundry & utility: No laundry appliances listed
Neighborhood map
What this means for you Summary
Snapshot
- This is a 3-bed/1.0-bath single-family listed at $110k.
Deal economics
- At list price, monthly cash flow is $128 ($2k/yr) — positive.
- The deal already cash-flows at list — no discount required.
- Meets the 1% rule at list price ($1k rent vs $110k).
- Cap rate 8.4% vs local median 4.4% in Indianapolis city (balance) — top-decile yield for the area; either an underpriced asset or a hidden risk that comps aren't pricing in. Stress-test before assuming the spread holds.
Location & tenants
- Location reads: area grade C — affects rentability + tenant quality, not the cash-flow math above.
- Indianapolis Public Schools (urban): math 14% / reading 20% proficiency, ranked #286 of 301 in IN (top 95%) — low school quality limits family demand, transient renter base, plan for 1-2y turnover; 77% free/reduced lunch — lower-income household profile, screen leases tightly.
- Market conditions: Rents rising fast (+6.4%/yr); 279 active listings in the ZIP; 40 comparable units currently listed for rent nearby; rentals at typical pace (median 24d on market — plan ~3-4 weeks tenant-placement turnaround); 48% of comp listings sitting > 30 days — soft ceiling on asking rent; 1,906 units permitted in Marion County in 2024 (621 in 5+ unit buildings).
Forward outlook
- Local home prices are declining (-3.0%/yr); year-one equity from $761 of loan paydown is wiped out by about $3k of value loss. Plan a longer hold.
- Marion County population projected at +18% by 2050 — long-run rental-demand tailwind backs the buy-and-hold thesis.
- At projected returns (-3.0% appreciation + 6.4% rent growth), your $31k cash investment doubles in ~10 years — after that, you're playing with house money.
Negotiation context
- Only 1 days on market — expect competitive offers; lowballing is unlikely to land.
- 5 sale attempts since 9y ago with the ask held roughly flat each time — persistent listings suggest the price (not the market) is what's stuck; bring a comps-based counter.
Risks & watch-outs
- Watch-outs: property tax is 3.3% of price; flood insurance adds $66/mo.
- Climate carrying-cost: major flood risk — expect insurance premiums to compound above CPI over the hold.
Questions for the listing agent
- Property tax is high relative to price — has the assessment been appealed recently, and will the sale trigger a re-assessment?
- What's the actual annual flood-insurance premium (NFIP or private), and is the property in a SFHA with mandatory coverage?
- Is there a deadline driving the sale (1031 exchange, divorce, estate, relocation)? That informs how much negotiation room exists.
- What's the average days-on-market for RENTAL listings here right now (not sales)? A rising rental-DOM trend means longer vacancies and softer asking-rent achievability than the comps imply.
- What's the recent tenant-quality profile in this submarket — average credit score on applications, eviction rate, late-payment / NSF rate, and stable-employment percentage? A property-management company in the area should have these aggregated.
- How much new for-sale + rental construction is in the pipeline within 1–3 miles? Heavy new supply typically softens prices + rents 12–24 months out; constrained supply supports both.
Investment metrics
- 1% rule
- 1.29% ✓
- Cap rate
- 8.41%
- Cash-on-cash
- 7.58%
- DSCR
- 1.34
- GRM
- 6.5
CMA / ARV
- ARV (on-the-fly)
- $143,520
- Comps found
- 12
Show comp detail 12 sales within ~0.75 mi
| Address | Dist | Beds/Ba | Sqft | Sold | Price | $/sf | Match |
|---|---|---|---|---|---|---|---|
| 837 W 25th St | 0.10mi | 3/1.0 | 1,080 (+4%) | 4mo | $160,000 | $148 | 86 |
| 1006 Edgemont Ave | 0.28mi | 3/1.0 | 954 (-8%) | 3mo | $75,000 | $79 | 71 |
| 538 W 28th St | 0.31mi | 2/1.0 (-1) | 1,100 (+6%) | 4mo | $110,000 | $100 | 67 |
| 1309 W 26th St | 0.62mi | 3/2.0 | 1,050 (+1%) | 1mo | $210,000 | $200 | 65 |
| 2949 Shriver Ave | 0.59mi | 3/1.0 | 1,080 (+4%) | 2mo | $138,000 | $128 | 64 |
| 3017 Ethel Ave | 0.54mi | 3/1.5 | 1,079 (+4%) | 7mo | $90,000 | $83 | 61 |
| 953 W 25th St | 0.21mi | 3/2.0 | 1,180 (+14%) | 4mo | $160,000 | $136 | 61 |
| 721 W 32nd St | 0.63mi | 3/2.0 | 1,108 (+6%) | 3mo | $174,900 | $158 | 54 |
| 1206 W 25th St | 0.51mi | 3/1.0 | 1,152 (+11%) | 7mo | $72,750 | $63 | 52 |
| 1330 W Pruitt St | 0.74mi | 3/1.0 | 1,088 (+5%) | 8mo | $150,000 | $138 | 51 |
| 1303 W 25th St | 0.64mi | 3/2.0 | 1,156 (+11%) | 2mo | $211,000 | $183 | 46 |
| 330 Congress Ave | 0.75mi | 3/2.0 | 1,156 (+11%) | 3mo | $210,000 | $182 | 40 |
Match score weights: distance 35% · size 25% · config 20% · recency 20%. Top-matched comps best support the ARV.
Projected returns pro-forma
-3.0% appreciation · 6.43% rent growth · sell at horizon
- IRR
- -3.7%
- Equity multiple
- 0.86×
- Total profit
- $-4,447
- Equity at exit
- $16,401
- IRR
- 10.3%
- Equity multiple
- 1.96×
- Total profit
- $29,569
- Equity at exit
- $9,511
Cash invested: $30,800 (down + closing). Projections, not guarantees.
Landlord ↔ Tenant lean methodology
- Overall (STATE)
- 90 Strongly Landlord-Friendly
- State Indiana
- 90 Strongly Landlord-Friendly · R+11
- County
- — inherits STATE
- City
- — inherits STATE
ZIP-level market 46208
- Rents YoY
- 6.4%
- Active inventory
- 279
- Price-to-rent
- 6.5×
Monthly cashflow live
- Estimated rent
- $1,417 high interval (Pro) →
- Mortgage (P&I)
- −$577
- Tax from tax record
- −$302 /mo · $3,627/yr
- Insurance
- −$46
- Flood insurance flood zone
- −$66 /mo · $798/yr
- HOA
- −$0
- Vacancy / Maint / Mgmt
- −$298
- Net cashflow
- $128
Break-even live
UW: 25.0% down · 7.5% · 30yr · 1.5% tax · 5.0% vac · 8.0% maint · 8.0% mgmt
Financing live
Cash to close
- Down payment
- $27,500
- Closing costs
- $3,300
- Reserves months
- —
- Total cash needed
- —
Loan-product check · same deal, 3 products live
Conventional
25% down · 7.5% · 30yr
- Down + closing
- —
- Monthly P&I
- —
- Monthly cashflow
- —
- DSCR
- —
- Eligible?
- —
Personal DTI + credit; lowest rate.
DSCR
20% down · 8.5% · 30yr
- Down + closing
- —
- Monthly P&I
- —
- Monthly cashflow
- —
- DSCR
- —
- Eligible?
- —
No personal income docs; deal must DSCR.
Hard money
10% down · 12.0% · 12mo
- Down + closing
- —
- Monthly P&I
- —
- Monthly cashflow
- —
- DSCR
- —
- Eligible?
- —
Short-term bridge; refi at stabilization.
Rent comps 40 comps
| Address | Beds | Baths | Sqft | Rent | $/sqft | DOM | Units | Dist |
|---|---|---|---|---|---|---|---|---|
| 906 Burdsal Pkwy Indianapolis, IN | 2.0 | 1.0 | 936 | $1,295 | $1.38 | 23d | 1 | 0.22mi |
| 908 Burdsal Pkwy Marion, IN | 2.0 | 1.0 | 936 | $1,300 | $1.39 | 23d | 1 | 0.22mi |
| 970 Edgemont Ave Indianapolis, IN | 2.0 | 1.0 | 740 | $845 | $1.14 | 4d | 1 | 0.23mi |
| 824 W 29th St Indianapolis, IN | 3.0 | 2.0 | 1200 | $1,595 | $1.33 | 43d | 1 | 0.28mi |
| 826 W 29th St Indianapolis, IN | 3.0 | 2.0 | 1200 | $1,595 | $1.33 | 43d | 1 | 0.31mi |
| 560 Udell St Indianapolis, IN | 3.0 | 1.5 | 1176 | $1,190 | $1.01 | 23d | 1 | 0.32mi |
| 516 W 28th St Indianapolis, IN | 2.0 | 1.0 | 1005 | $1,100 | $1.09 | 23d | 1 | 0.34mi |
| 445 W 25th St Indianapolis, IN | 4.0 | 2.0 | 1500 | $1,900 | $1.27 | 43d | 1 | 0.37mi |
| 538 W 29th St Indianapolis, IN | 3.0 | 1.0 | 1132 | $1,349 | $1.19 | 23d | 1 | 0.39mi |
| 648 W 30th St Indianapolis, IN | 3.0 | 2.0 | 1300 | $1,500 | $1.15 | 23d | 1 | 0.45mi |
| 2235 Doctor Martin Luther King Junior St Indianapolis, IN | 3.0 | 1.5 | 948 | $1,700 | $1.79 | 43d | 1 | 0.46mi |
| 3017 Ethel Ave Indianapolis, IN | 3.0 | 1.5 | 1079 | $1,400 | $1.30 | 23d | 1 | 0.54mi |
| 1244 Edgemont Ave Indianapolis, IN | 2.0 | 1.0 | 1092 | $1,275 | $1.17 | 43d | 1 | 0.57mi |
| 1227 W 29th St Indianapolis, IN | 3.0 | 1.5 | 1056 | $1,250 | $1.18 | 23d | 1 | 0.58mi |
| 1054 W 31st St Unit A Indianapolis, IN | 2.0 | 1.0 | 1200 | $1,500 | $1.25 | 43d | 1 | 0.59mi |
| 926 W 32nd St Indianapolis, IN | 3.0 | 2.0 | 1050 | $1,295 | $1.23 | 7d | 1 | 0.65mi |
| 2808 N Capitol Ave Indianapolis, IN | 2.0 | 1.0 | 900 | $975 | $1.08 | 23d | 1 | 0.68mi |
| 3217 Rader St Indianapolis, IN | 3.0 | 1.0 | 1200 | $1,299 | $1.08 | 43d | 1 | 0.70mi |
| 2318 N Capitol Ave Indianapolis, IN | 3.0 | 1.0 | 1440 | $1,050 | $0.73 | 43d | 1 | 0.73mi |
| 3031 Boulevard Pl Indianapolis, IN | 3.0 | 1.5 | 1395 | $1,450 | $1.04 | 17d | 1 | 0.73mi |
| 1133 W 21st St Indianapolis, IN | 3.0 | 2.0 | 1296 | $1,495 | $1.15 | 23d | 1 | 0.74mi |
| 1135 W 21st St Indianapolis, IN | 3.0 | 2.0 | 1296 | $1,495 | $1.15 | 23d | 1 | 0.75mi |
| 1367 W Pruitt St Indianapolis, IN | 3.0 | 1.0 | 1088 | $1,450 | $1.33 | 43d | 1 | 0.79mi |
| 2248 N Harding St Indianapolis, IN | 2.0 | 1.0 | 1100 | $899 | $0.82 | 23d | 1 | 0.81mi |
| 118 W 23rd St Indianapolis, IN | 3.0 | 1.5 | 1456 | $1,300 | $0.89 | 10d | 1 | 0.83mi |
| 55 W Fall Creek Parkway South Dr Unit C Indianapolis, IN | 2.0 | 1.0 | 1000 | $1,035 | $1.03 | 43d | 1 | 0.83mi |
| 1261 W 32nd St Indianapolis, IN | 2.0 | 1.0 | 832 | $975 | $1.17 | 43d | 1 | 0.85mi |
| 1415 W Pruitt St Indianapolis, IN | 3.0 | 1.0 | 1001 | $1,249 | $1.25 | 23d | 1 | 0.86mi |
| 1519 W 28th St Indianapolis, IN | 2.0 | 1.0 | 816 | $895 | $1.10 | 43d | 1 | 0.87mi |
| 1920 Sugar Grove Ave Indianapolis, IN | 3.0 | 1.5 | 1378 | $1,175 | $0.85 | 2d | 1 | 0.93mi |
| 1039 W 36th St Indianapolis, IN | 2.0 | 1.0 | 864 | $995 | $1.15 | 43d | 1 | 0.95mi |
| 2625 N Meridian St Indianapolis, IN | 1.0–2.0 | 1.0–2.0 | 850 | $2,150 | $2.53 | 7d | 8 | 0.98mi |
| 2437 N Pennsylvania St Indianapolis, IN | 3.0 | 2.0 | 1400 | $1,650 | $1.18 | 23d | 1 | 1.01mi |
| 1228 W 18th St Indianapolis, IN | 2.0 | 1.0 | 1050 | $1,200 | $1.14 | 43d | 1 | 1.03mi |
| 1470 W 32nd St Indianapolis, IN | 2.0 | 1.0 | 700 | $1,000 | $1.43 | 43d | 1 | 1.04mi |
| 2131 N Meridian St Indianapolis, IN | 2.0 | 1.0 | 994 | $1,455 | $1.46 | 43d | 1 | 1.05mi |
| 3440 N Harding St Indianapolis, IN | 2.0 | 1.0 | 754 | $1,325 | $1.76 | 43d | 1 | 1.08mi |
| 3440 N Harding St Indianapolis, IN | 2.0 | 1.0 | 754 | $1,275 | $1.69 | 19d | 1 | 1.08mi |
| 2805 N Talbott St Indianapolis, IN | 3.0 | 2.0 | 1296 | $1,800 | $1.39 | 43d | 1 | 1.09mi |
| 2809 N Talbott St Indianapolis, IN | 3.0 | 2.0 | 1250 | $1,750 | $1.40 | 43d | 1 | 1.09mi |
Listing history 15 events
-
2026-05-16status Pending
-
2026-05-15$110,000 Active
-
2023-12-21soldstatus $150,500 Closed 402-char remark
Show marketing remark (402 chars)
Welcome to this cozy bungalo-style home at 810 West 26th Street, Indianapolis, IN. With 3 bedrooms, 1 bathroom, and 1040 square feet of living space on a 5619 square foot lot, this property offers a relaxed vibe. It's all about location with this home. With its close proximity to downtown and entertainment. You won't want to miss the opportunity to be minutes from Lucas oil and the Indianapolis Zoo.
-
2023-12-19status Pending 402-char remark
Show marketing remark (402 chars)
Welcome to this cozy bungalo-style home at 810 West 26th Street, Indianapolis, IN. With 3 bedrooms, 1 bathroom, and 1040 square feet of living space on a 5619 square foot lot, this property offers a relaxed vibe. It's all about location with this home. With its close proximity to downtown and entertainment. You won't want to miss the opportunity to be minutes from Lucas oil and the Indianapolis Zoo.
-
2023-12-06$150,000 Active 402-char remark
Show marketing remark (402 chars)
Welcome to this cozy bungalo-style home at 810 West 26th Street, Indianapolis, IN. With 3 bedrooms, 1 bathroom, and 1040 square feet of living space on a 5619 square foot lot, this property offers a relaxed vibe. It's all about location with this home. With its close proximity to downtown and entertainment. You won't want to miss the opportunity to be minutes from Lucas oil and the Indianapolis Zoo.
-
2021-09-13soldstatus $120,000 Closed 384-char remark
Show marketing remark (384 chars)
This house is ready to become your dream home! Come check out this beautiful recently renovated home today. The kitchen has new appliances and cabinetry that really make the kitchen standout not to mention the fresh paint and flooring throughout the entire home. The full bath and the half bath have also been updated. Come have a look at this amazing house, you will be glad you did!
-
2021-08-09status Pending 384-char remark
Show marketing remark (384 chars)
This house is ready to become your dream home! Come check out this beautiful recently renovated home today. The kitchen has new appliances and cabinetry that really make the kitchen standout not to mention the fresh paint and flooring throughout the entire home. The full bath and the half bath have also been updated. Come have a look at this amazing house, you will be glad you did!
-
2021-07-27price $125,000 384-char remark
Show marketing remark (384 chars)
This house is ready to become your dream home! Come check out this beautiful recently renovated home today. The kitchen has new appliances and cabinetry that really make the kitchen standout not to mention the fresh paint and flooring throughout the entire home. The full bath and the half bath have also been updated. Come have a look at this amazing house, you will be glad you did!
-
2021-07-14$130,000 Active 384-char remark
Show marketing remark (384 chars)
This house is ready to become your dream home! Come check out this beautiful recently renovated home today. The kitchen has new appliances and cabinetry that really make the kitchen standout not to mention the fresh paint and flooring throughout the entire home. The full bath and the half bath have also been updated. Come have a look at this amazing house, you will be glad you did!
-
2021-06-09soldstatus $62,500 Closed
-
2021-06-04historical
-
2021-06-03$62,500
-
2017-08-01soldstatus $20,000 Sold
-
2017-07-14status Pending
-
2017-07-13$20,000 Active
ⓘ Source: listings_history table (triggers on properties + properties_extension) + one-shot
backfill from property_details.listing_events for pre-trigger history.
Tax reassessment forecast IN · Partial reset (capped growth)
- Current annual tax
- $3,627 · $302/mo
- Projected year-2 tax
- $3,627 · $302/mo
- Expected delta
- $0/yr ($0/mo · 0.0%)
ⓘ Screening estimate from a state-policy table — verify with the county assessor before closing.
Climate risk First Street
- Flood 7/10 Severe FEMA zone X (unshaded) · 76% chance over 30 yrs
- Wildfire 1/10 Low
- Heat 4/10 Moderate 7 d/yr ≥101°F today · 19 d/yr by 30 yrs out
- Wind 2/10 Low 0% chance of damaging wind over 30 yrs
- Air quality 4/10 Moderate 5 unhealthy d/yr today · 7 by 30 yrs out
Nearby sold comps map
Loading sold comps map…
Walkable amenities ~0.75 mi
Loading nearby amenities…
Taxation est. · year 1
- Rental income
- $17,004
- − Mortgage interest
- −$6,162
- − Property taxes
- −$3,627
- − Insurance
- −$1,348
- − Repairs & maintenance
- −$1,360
- − Management
- −$1,360
- − Depreciation
- −$3,200
- Taxable loss
- −$53
- Est. tax savings @ 24.0%
- +$13
- After-tax cash flow
- $1,549/yr
For passive investors: Depreciation is non-cash, so a rental often shows a tax loss while cash-flowing — sheltering income. Rental losses are passive: they offset passive income freely, and up to $25,000/yr can offset ordinary (W-2) income if you actively participate and your MAGI is under $100k (phasing out to $0 by $150k); unused losses carry forward. On sale, claimed depreciation is recaptured at up to 25%, and gains may owe capital-gains tax (a 1031 exchange can defer both). Figures are a year-1 estimate at your 24.0% rate — not tax advice; consult a CPA.
Schools (NCES district)
- District
- Indianapolis Public Schools
- NCES district ID
- 1804770
- Math proficiency
- 14% ▼ -7.00%
- Reading proficiency
- 20% ▼ -3.00%
- Median HH income
- $32,034
- Composite
- 13.69/100
- National rank
- #9499
- State rank
- #286 of 301 in IN
Livability — Indianapolis city (balance)
No livability data for this city. (Only ~50 U.S. cities are tracked.)
Census & demographics
- Census place
- Indianapolis city (balance), IN
- County
- Marion County · 998,460 people
- City population
- 881,119
- Metro
- Indianapolis-Carmel-Anderson, IN
- Population (ZIP)
- 22,379
- Household income
- $60,062
- Rent vs Own
- Severe rent burden
- 978.0
Population outlook (Marion County) Hauer SSP2
- Today (2025)
- 1,025,572 people
- By 2030
- 1,065,727 · +3.9%
- By 2040
- 1,141,577 · +11.3%
- By 2050
- 1,208,920 · +17.9%
- By 2075
- 1,367,288 · +33.3%
- By 2100
- 1,438,201 · +40.2%
Race, ethnicity, and origin ACS 2023
- Neighborhood character
- Diverse neighborhood (Simpson 0.62)
- Race & ethnicity
- White 46% Black 40% Hispanic / Latino 8% Two or more races 6% Asian 2%
- Hispanic origin (detail)
- Mexican 4%
- Common ancestry
- Romanian 2% Slovak 2% Italian 1%
- Foreign-born
- 4% · Canada
- Languages at home
- 93% English-only · Spanish 5% French/Haitian/Cajun 1% Other Indo-European 1%
Political lean MEDSL · Marion
- 2024 margin
- Strong D (+27.7) · D 63.0% · R 35.3% · Other 1.7%
- 2008→2024 swing
- -0.7pp no change · 2008: 28.4pp · 2024: 27.7pp
- All cycles
- 2024: D+27.7 2020: D+29.1 2016: D+22.8 2012: D+22.2 2008: D+28.4
Not yet ingested
- Civics
- —
Market trends
- HPI YoY
- ▼ -324.63%
- Current HPI
- 319.7725
- Rent YoY
- ▲ 6.43%
- Metro
- Indianapolis-Carmel-Anderson, IN
- State GDP YoY
- ▲ 2.90%
- F500 in state
- 18
Industry mix (Fortune 500 HQ in IN)
| Industry | F500 HQs | Revenue |
|---|---|---|
| Industrial Machinery | 2 | $37B |
|
||
| Healthcare | 1 | $177B |
|
||
| Pharmaceuticals | 1 | $45B |
|
||
| Metals / Steel | 1 | $18B |
|
||
| Agriculture | 1 | $17B |
|
||
| Packaging | 1 | $12B |
|
||
Price history
+450.0% since first listed15 events — show timeline
- 2026-05-16 Pending — MIBOR as Distributed by MLS Grid
- 2026-05-15 Listed $110,000 MIBOR as Distributed by MLS Grid
- 2023-12-21 Sold (MLS) $150,500 MIBOR as Distributed by MLS Grid
- 2023-12-19 Pending — MIBOR as Distributed by MLS Grid
- 2023-12-06 Listed $150,000 MIBOR as Distributed by MLS Grid
- 2021-09-13 Sold (MLS) $120,000 MIBOR as Distributed by MLS Grid
- 2021-08-09 Pending — MIBOR as Distributed by MLS Grid
- 2021-07-27 Price Changed $125,000 MIBOR as Distributed by MLS Grid
- 2021-07-14 Listed $130,000 MIBOR as Distributed by MLS Grid
- 2021-06-09 Sold (MLS) $62,500 MIBOR as Distributed by MLS Grid
- 2021-06-04 Listing Removed — MIBOR as Distributed by MLS Grid
- 2021-06-03 Listed $62,500 MIBOR as Distributed by MLS Grid
- 2017-08-01 Sold (MLS) $20,000 MIBOR as Distributed by MLS Grid
- 2017-07-14 Pending — MIBOR as Distributed by MLS Grid
- 2017-07-13 Listed $20,000 MIBOR as Distributed by MLS Grid
Property tax history
+12.6%/yrLatest (2025): $3,627 · +15.7% YoY. Source: county tax records.
Cash-flow waterfall
monthlySold comps — $/sqft
last 12 mo · ≤1 miLoading sold comps…