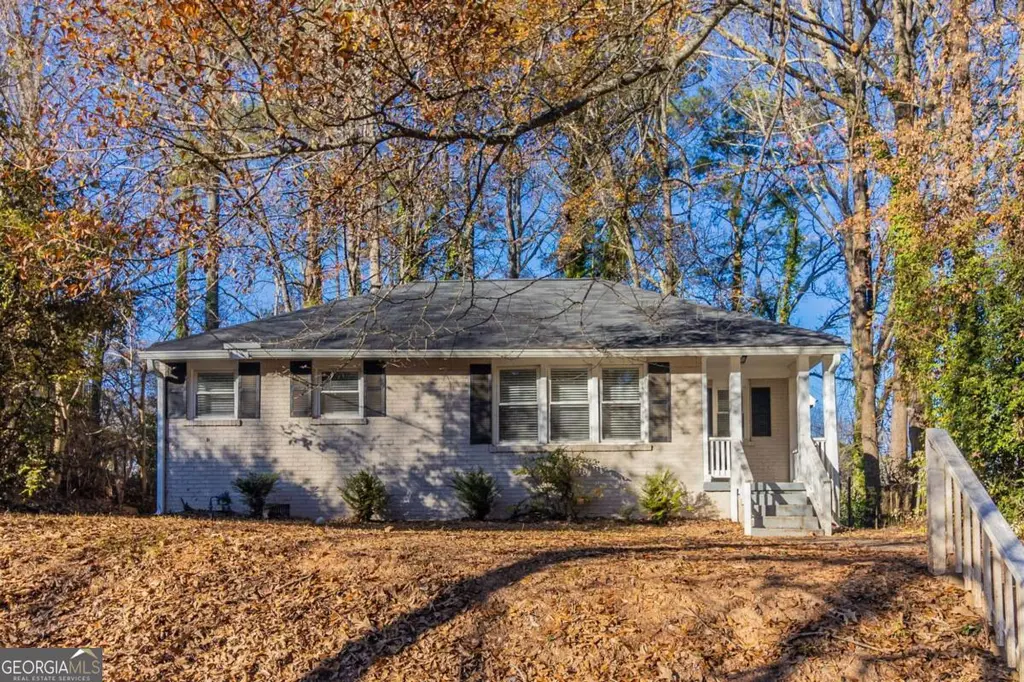
1807 Oakmont Dr NW · Atlanta, GA
Flood risk 1/10 · Minimal
- FEMA flood zone
- X (unshaded)
- Chance of flooding over 30 yrs
- 0.0%
- Est. flood insurance / yr
- $473 – $860
Fire risk 1/10 · Minimal
- Est. fire insurance / yr
- $963 – $1,789
Heat risk 5/10 · Moderate
- Hot days now (above 103°F)
- 7 days/yr
- Hot days in 30 yrs
- 17 days/yr
Wind risk 6/10 · Moderate
- Chance of severe wind over 30 yrs
- 27.0%
Air-quality risk 4/10 · Minor
- Unhealthy air days now
- 5 days/yr
- Unhealthy air days in 30 yrs
- 7 days/yr
Risk factors via First Street. Map © Google.
Why this score? — see what drove the D grade
The composite is a weighted blend of 9 inputs, each scored 0–100. Each bar is that input's sub-score; the figure is the points it added to the 100-point composite (weight × sub-score).
- ARV discount +13.2/15.0
- Cash flow +11.0/30.0
- Livability +4.2/5.0
- DSCR +3.2/10.0
- Rent growth +3.1/5.0
- 1% rule +2.8/10.0
- Schools +2.7/10.0
- Condition / age +2.5/5.0
- Appreciation +0.0/10.0
$173,000
🖨 Deal sheet (PDF) 📄 Offer letter ✓ Due diligence
Listing remarks
This cozy 1-story home offers 3 bedrooms and 1 bathroom, perfect for comfortable living. The kitchen is equipped with sleek stainless steel appliances, providing both style and functionality for everyday meals. Enjoy the charm of a small front porch, ideal for relaxing or greeting guests, as well as a small side porch for additional outdoor space. The backyard offers a peaceful view of trees, creating a serene, natural setting. With its inviting layout and charming details, this home is a must-see for those seeking comfort and tranquility.
Key facts
- Small front porch
- Small side porch
- 9,016 sq ft lot
Tags
Neighborhood map
What this means for you Summary
Snapshot
- This is a 2-bed/1.0-bath single-family listed at $173k.
Deal economics
- At list price, monthly cash flow is $-73 ($-879/yr) — negative.
- To cash-flow at today's rent, offer at most $160k (7.5% below list).
- To meet the 1% rule (rent ≥ 1% of price), the offer needs to be $135k (21.8% below list).
- Recommended offer: $135k (21.8% below list) — sets the bar for 1% rule.
- Cap rate 5.8% vs local median 3.1% in Atlanta — top-decile yield for the area; either an underpriced asset or a hidden risk that comps aren't pricing in. Stress-test before assuming the spread holds.
Location & tenants
- Location reads 83/100 on livability (#6 in GA, #919 nationally) — a professional / high-income tenant draw. Strengths: amenities A+, commute A+, housing A+; Watch: cost of living C-.
- Atlanta Public Schools (urban): math 28% / reading 35% proficiency, ranked #80 of 174 in GA (top 46%) — families likely to look elsewhere, expect single-tenant / working-renter base with shorter leases; 71% free/reduced lunch — lower-income household profile, screen leases tightly.
- Zoned schools: Kipp Ways Primary Charter School (math 5% / reading 5%, grade F, #1,160 of 1,228 statewide, top 98%, 477 students, 100% FRL, charter); Frederick Douglass High School (math 24%, 1,112 students, 100% FRL) — zoned schools average 100% FRL vs 71% district-wide (29 pts higher); higher-poverty schools than district average — tighter screening recommended.
- Zoned-school proficiency averages 5% at this address vs 32% district-wide (-26 pts) — the specific schools serving this property underperform the Atlanta Public Schools average; the district grade overstates school quality for this exact location.
- Market conditions: Rents rising (+2.5%/yr); 293 active listings in the ZIP; 40 comparable units currently listed for rent nearby; rentals at typical pace (median 24d on market — plan ~3-4 weeks tenant-placement turnaround); lower-income renter base — watch delinquency; 11,565 units permitted in Fulton County in 2024 (8,159 in 5+ unit buildings).
Forward outlook
- Local home prices are declining (-3.0%/yr); year-one equity from $1k of loan paydown is wiped out by about $5k of value loss. Plan a longer hold.
- Fulton County population projected at +38% by 2050 — long-run rental-demand tailwind backs the buy-and-hold thesis.
Negotiation context
- It's been on market 526 days — a 12% lower offer ($152k) is reasonable based on typical stale-listing flexibility.
- 5 sale attempts since 2y ago with the ask held roughly flat each time — persistent listings suggest the price (not the market) is what's stuck; bring a comps-based counter.
- Current owner paid $87k; list at $173k implies a 99% gain — meaningful room to come down on a strong offer.
Risks & watch-outs
- Watch-outs: built in 1949 — expect roof / HVAC / electrical / plumbing capex.
- Climate carrying-cost: major wind risk, 27% chance of damaging wind over 30y; extreme-heat days projected 7→17/yr by 2055 (HVAC capex compounding) — expect insurance premiums to compound above CPI over the hold.
Questions for the listing agent
- What do current leases actually rent for vs. the listed asking? Can we see a recent rent roll and the last 12 months of T-12 income?
- It's been on market 526 days. Have you received any prior offers? Is the seller open to a 22% concession, seller financing, or rate buy-down credit?
- Built in 1949 — when were the roof, HVAC, electrical panel, plumbing, and water heater last replaced?
- Why hasn't it sold? Are there any deal-killer items the seller is aware of (foundation, flood, title, zoning, code violations)?
- Is there a deadline driving the sale (1031 exchange, divorce, estate, relocation)? That informs how much negotiation room exists.
- The area grade is low — what's the realistic commute time and amenity access for the typical tenant pool here? Any planned neighborhood developments (good or bad) we should know about?
- What's the average days-on-market for RENTAL listings here right now (not sales)? A rising rental-DOM trend means longer vacancies and softer asking-rent achievability than the comps imply.
- What's the recent tenant-quality profile in this submarket — average credit score on applications, eviction rate, late-payment / NSF rate, and stable-employment percentage? A property-management company in the area should have these aggregated.
- How much new for-sale + rental construction is in the pipeline within 1–3 miles? Heavy new supply typically softens prices + rents 12–24 months out; constrained supply supports both.
Investment metrics
- 1% rule
- 0.78% ✗
- Cap rate
- 5.78%
- Cash-on-cash
- -1.81%
- DSCR
- 0.92
- GRM
- 10.7
CMA / ARV
- ARV (median comp)
- $198,296
- List price
- $173,000
- Delta
- -12.76%
- Verdict
- UNDERPRICED
- Comps
- 20 within 1.0 mi
Show comp detail 12 sales within ~0.75 mi
| Address | Dist | Beds/Ba | Sqft | Sold | Price | $/sf | Match |
|---|---|---|---|---|---|---|---|
| 1855 Oakmont Dr NW | 0.09mi | 2/2.0 | 839 (0%) | 1mo | $96,000 | $114 | 91 |
| 1810 Oakmont Dr NW | 0.03mi | 3/1.0 (+1) | 839 (0%) | 10mo | $134,000 | $160 | 85 |
| 116 Holly Rd NW | 0.47mi | 2/2.0 | 856 (+2%) | 2mo | $185,000 | $216 | 69 |
| 2073 Morehouse Dr NW | 0.53mi | 2/2.0 | 798 (-5%) | 1mo | $195,000 | $244 | 62 |
| 502 S Evelyn Pl NW | 0.68mi | 2/1.0 | 808 (-4%) | 11mo | $115,500 | $143 | 53 |
| 241 Holly Rd NW | 0.54mi | 3/1.0 (+1) | 768 (-8%) | 4mo | $70,000 | $91 | 52 |
| 250 Morris Brown Ave | 0.48mi | 2/1.0 | 725 (-14%) | 5mo | $163,000 | $225 | 50 |
| 2043 Chicago Ave NW | 0.61mi | 3/1.0 (+1) | 915 (+9%) | 2mo | $120,000 | $131 | 50 |
| 89 Holly Rd NW | 0.50mi | 3/1.0 (+1) | 792 (-6%) | 21mo | $140,000 | $177 | 44 |
| 1846 North Ave | 0.64mi | 3/1.0 (+1) | 896 (+7%) | 11mo | $104,900 | $117 | 44 |
| 350 New Jersey Ave NW | 0.69mi | 2/1.0 | 943 (+12%) | 10mo | $60,000 | $64 | 38 |
| 2161 Penelope St NW | 0.66mi | 3/2.0 (+1) | 960 (+14%) | 15mo | $237,500 | $247 | 24 |
Match score weights: distance 35% · size 25% · config 20% · recency 20%. Top-matched comps best support the ARV.
Projected returns pro-forma
-3.0% appreciation · 2.53% rent growth · sell at horizon
- IRR
- -19.8%
- Equity multiple
- 0.31×
- Total profit
- $-33,349
- Equity at exit
- $25,795
- IRR
- -13.7%
- Equity multiple
- 0.22×
- Total profit
- $-37,687
- Equity at exit
- $14,958
Cash invested: $48,440 (down + closing). Projections, not guarantees.
Landlord ↔ Tenant lean methodology
- Overall (STATE)
- 90 Strongly Landlord-Friendly
- State Georgia
- 90 Strongly Landlord-Friendly · R+3
- County
- — inherits STATE
- City
- — inherits STATE
ZIP-level market 30314
- Home prices YoY
- -22.9%
- Rents YoY
- 2.5%
- Active inventory
- 293
- Price-to-rent
- 10.7×
Monthly cashflow live
- Estimated rent
- $1,352 high interval (Pro) →
- Mortgage (P&I)
- −$907
- Tax from tax record
- −$162 /mo · $1,949/yr
- Insurance
- −$72
- HOA
- −$0
- Vacancy / Maint / Mgmt
- −$284
- Net cashflow
- $-73
Break-even live
Sensitivity live
| Price | -10% $25 | -5% $-24 | +0% $-73 | +5% $-122 | +10% $-171 |
|---|---|---|---|---|---|
| Rent | -10% $-180 | -5% $-127 | +0% $-73 | +5% $-20 | +10% $34 |
| Rate | -1.0pp $14 | -0.5pp $-29 | base $-73 | +0.5pp $-118 | +1.0pp $-164 |
UW: 25.0% down · 7.5% · 30yr · 1.5% tax · 5.0% vac · 8.0% maint · 8.0% mgmt
Financing live
Cash to close
- Down payment
- $43,250
- Closing costs
- $5,190
- Reserves months
- —
- Total cash needed
- —
Loan-product check · same deal, 3 products live
Conventional
25% down · 7.5% · 30yr
- Down + closing
- —
- Monthly P&I
- —
- Monthly cashflow
- —
- DSCR
- —
- Eligible?
- —
Personal DTI + credit; lowest rate.
DSCR
20% down · 8.5% · 30yr
- Down + closing
- —
- Monthly P&I
- —
- Monthly cashflow
- —
- DSCR
- —
- Eligible?
- —
No personal income docs; deal must DSCR.
Hard money
10% down · 12.0% · 12mo
- Down + closing
- —
- Monthly P&I
- —
- Monthly cashflow
- —
- DSCR
- —
- Eligible?
- —
Short-term bridge; refi at stabilization.
Rent comps 40 comps
| Address | Beds | Baths | Sqft | Rent | $/sqft | DOM | Units | Dist |
|---|---|---|---|---|---|---|---|---|
| 166 Anderson Ave NW Apt B4 Atlanta, GA | 2.0 | 1.0 | 760 | $1,095 | $1.44 | 13d | 1 | 0.30mi |
| 166 Anderson Ave NW Unit B12 Atlanta, GA | 2.0 | 1.0 | 760 | $1,095 | $1.44 | 9d | 1 | 0.30mi |
| 166 Anderson Ave NW Unit B18 Atlanta, GA | 2.0 | 1.0 | 760 | $1,095 | $1.44 | 4d | 1 | 0.31mi |
| 166 Anderson Ave NW Apt B6 Atlanta, GA | 2.0 | 1.0 | 760 | $1,095 | $1.44 | 0d | 1 | 0.31mi |
| 166 Anderson Ave NW Unit B17 Atlanta, GA | 2.0 | 1.0 | 760 | $1,150 | $1.51 | 26d | 1 | 0.31mi |
| 295 Penelope Dr NW Atlanta, GA | 1.0–2.0 | 1.0 | 751 | $1,542 | $2.05 | 23d | 1 | 0.32mi |
| 1839 Penelope Rd NW Atlanta, GA | 3.0 | 1.0 | 988 | $1,400 | $1.42 | 26d | 1 | 0.35mi |
| 215 W Lake Dr NW Atlanta, GA | 1.0 | 1.0 | 650 | $1,075 | $1.65 | 9d | 1 | 0.36mi |
| 1916 Joseph E. Boone Blvd NW Unit A Atlanta, GA | 3.0 | 1.0 | 1100 | $1,550 | $1.41 | 22d | 1 | 0.41mi |
| 1916 Joseph E. Boone Blvd NW Unit B Atlanta, GA | 2.0 | 1.0 | 1000 | $1,195 | $1.20 | 26d | 1 | 0.41mi |
| 340 Dixie Hills Cir NW Unit C1 Atlanta, GA | 2.0 | 1.0 | 775 | $1,099 | $1.42 | 26d | 1 | 0.43mi |
| 340 Dixie Hills Cir NW Unit A1 Atlanta, GA | 1.0 | 1.0 | 695 | $899 | $1.29 | 26d | 1 | 0.44mi |
| 39 Holly Rd NW Atlanta, GA | 1.0 | 1.0 | 1120 | $775 | $0.69 | 26d | 1 | 0.52mi |
| 39 Holly Rd NW Atlanta, GA | 1.0 | 1.0 | 1120 | $970 | $0.87 | 9d | 1 | 0.52mi |
| 280 Holly Rd NW Unit B Atlanta, GA | 2.0 | 2.0 | 1100 | $1,650 | $1.50 | 26d | 1 | 0.54mi |
| 371 Lanier St NW #1 Atlanta, GA | 2.0 | 1.0 | 700 | $1,250 | $1.79 | 9d | 1 | 0.58mi |
| 1595 Carlisle St NW Unit 1 Atlanta, GA | 2.0 | 1.0 | 900 | $1,200 | $1.33 | 26d | 1 | 0.61mi |
| 1441 Andrews St NW Unit 2 Atlanta, GA | 1.0 | 1.0 | 950 | $795 | $0.84 | 9d | 1 | 0.64mi |
| 1894 North Ave NW Atlanta, GA | 2.0 | 1.5 | 1098 | $1,995 | $1.82 | 26d | 1 | 0.66mi |
| 399 Holly St NW Unit 6 Atlanta, GA | 2.0 | 1.0 | 775 | $1,500 | $1.94 | 20d | 1 | 0.70mi |
| 427 Holly St NW Atlanta, GA | 2.0 | 2.0 | 900 | $2,100 | $2.33 | 26d | 1 | 0.73mi |
| 2175 Pansy St NW Atlanta, GA | 2.0 | 1.0 | 624 | $1,403 | $2.25 | 26d | 1 | 0.76mi |
| 511 Emily Pl NW Atlanta, GA | 3.0 | 1.0 | 1101 | $1,745 | $1.58 | 26d | 1 | 0.76mi |
| 2059 Detroit Ave NW Atlanta, GA | 2.0 | 1.0 | 750 | $1,340 | $1.79 | 23d | 1 | 0.77mi |
| 15 Chappell Rd NW Unit A Atlanta, GA | 1.0 | 1.0 | 700 | $940 | $1.34 | 7d | 1 | 0.77mi |
| 2199 Tiger Flowers Dr NW Atlanta, GA | 3.0 | 1.0 | 936 | $1,325 | $1.42 | 26d | 1 | 0.80mi |
| 518 Pelton Pl NW Atlanta, GA | 1.0 | 1.0 | 1036 | $750 | $0.72 | 26d | 1 | 0.80mi |
| 1474 Mozley Pl SW Atlanta, GA | 1.0 | 1.0 | 550 | $950 | $1.73 | 26d | 1 | 0.81mi |
| 557 W Lake Ave NW Atlanta, GA | 1.0–3.0 | 1.0–2.0 | 1190 | $1,344 | $1.13 | 6d | 9 | 0.84mi |
| 1338 Sharon St NW Atlanta, GA | 2.0 | 1.0 | 800 | $1,600 | $2.00 | 21d | 1 | 0.91mi |
| 1336 Sharon St NW Atlanta, GA | 2.0 | 1.0 | 800 | $1,450 | $1.81 | 26d | 1 | 0.92mi |
| 1958 Maywood Pl NW Atlanta, GA | 2.0 | 1.0 | 829 | $1,425 | $1.72 | 7d | 1 | 0.96mi |
| 10 Rockmart Dr NW Atlanta, GA | 1.0 | 1.0 | 784 | $1,450 | $1.85 | 16d | 1 | 1.00mi |
| 156 Fairfield Pl NW Unit B-9 Atlanta, GA | 2.0 | 1.0 | 750 | $1,199 | $1.60 | 26d | 1 | 1.00mi |
| 10 Rockmart Dr SW Atlanta, GA | 1.0 | 1.0 | 784 | $1,450 | $1.85 | 16d | 1 | 1.04mi |
| 15 Burbank Dr SW Unit 3 Atlanta, GA | 2.0 | 1.0 | 900 | $1,350 | $1.50 | 12d | 1 | 1.06mi |
| 5 Burbank Dr SW Unit B Atlanta, GA | 2.0 | 1.0 | 1000 | $1,300 | $1.30 | 18d | 1 | 1.06mi |
| 2227 Telhurst St SW Atlanta, GA | 2.0 | 2.0 | 928 | $1,395 | $1.50 | 15d | 1 | 1.06mi |
| 2227 Telhurst St SW Atlanta, GA | 2.0 | 2.0 | 928 | $1,395 | $1.50 | 5d | 1 | 1.06mi |
| 1699 Derry Ave SW Atlanta, GA | 2.0 | 1.0 | 825 | $1,800 | $2.18 | 26d | 1 | 1.07mi |
Listing history 38 events
-
2026-06-21days on market $173,000 Active 526 DOM
-
2026-06-18days on market $173,000 Active 523 DOM
-
2026-06-17days on market $173,000 Active 522 DOM
-
2026-06-16days on market $173,000 Active 521 DOM
-
2026-06-15days on market $173,000 Active 520 DOM
-
2026-06-13days on market $173,000 Active 518 DOM
-
2026-06-13days on market $173,000 Active 517 DOM
-
2026-06-09days on market $173,000 Active 514 DOM
-
2026-06-08days on market $173,000 Active 513 DOM
-
2026-06-07days on market $173,000 Active 512 DOM
-
2026-06-04days on market $173,000 Active 509 DOM
-
2026-06-03days on market $173,000 Active 508 DOM
-
2026-06-02days on market $173,000 Active 507 DOM
-
2026-06-01days on market $173,000 Active 506 DOM
-
2026-05-31days on market $173,000 Active 505 DOM
-
2025-12-03historical
-
2025-10-13historical
-
2025-10-08status Back On Market
-
2025-09-26$173,000 Active
-
2025-09-26$173,000 New
-
2025-09-16historical
-
2025-09-16historical
-
2025-07-19price $173,000
-
2025-07-19price $173,000
-
2025-06-25price $175,000
-
2025-06-25price $175,000
-
2025-04-11price $185,000
-
2025-04-11price $185,000
-
2025-01-31price $195,000
-
2025-01-31price $195,000
-
2024-12-20$200,000 New
-
2024-12-20$200,000 Active
-
2020-07-27soldstatus $87,000
-
2010-02-19price $14,400 Reduced
-
2010-01-15price $16,200 Reduced
-
2000-05-17soldstatus $70,000
-
1987-06-11soldstatus $33,000
-
1982-08-09soldstatus $37,000
ⓘ Source: listings_history table (triggers on properties + properties_extension) + one-shot
backfill from property_details.listing_events for pre-trigger history.
Tax reassessment forecast GA · Resets to sale price
- Current annual tax
- $1,949 · $162/mo
- Projected year-2 tax
- $1,949 · $162/mo
- Expected delta
- $0/yr ($0/mo · 0.0%)
ⓘ Screening estimate from a state-policy table — verify with the county assessor before closing.
Climate risk First Street
- Flood 1/10 Low FEMA zone X (unshaded) · 0% chance over 30 yrs
- Wildfire 1/10 Low
- Heat 5/10 Major 7 d/yr ≥103°F today · 17 d/yr by 30 yrs out
- Wind 6/10 Major 27% chance of damaging wind over 30 yrs
- Air quality 4/10 Moderate 5 unhealthy d/yr today · 7 by 30 yrs out
Nearby sold comps map
Loading sold comps map…
Walkable amenities ~0.75 mi
Loading nearby amenities…
Taxation est. · year 1
- Rental income
- $16,230
- − Mortgage interest
- −$9,691
- − Property taxes
- −$1,949
- − Insurance
- −$865
- − Repairs & maintenance
- −$1,298
- − Management
- −$1,298
- − Depreciation
- −$5,033
- Taxable loss
- −$3,904
- Est. tax savings @ 24.0%
- +$937
- After-tax cash flow
- $58/yr
For passive investors: Depreciation is non-cash, so a rental often shows a tax loss while cash-flowing — sheltering income. Rental losses are passive: they offset passive income freely, and up to $25,000/yr can offset ordinary (W-2) income if you actively participate and your MAGI is under $100k (phasing out to $0 by $150k); unused losses carry forward. On sale, claimed depreciation is recaptured at up to 25%, and gains may owe capital-gains tax (a 1031 exchange can defer both). Figures are a year-1 estimate at your 24.0% rate — not tax advice; consult a CPA.
Schools (NCES district)
- District
- Atlanta Public Schools
- NCES district ID
- 1300120
- Math proficiency
- 28% ▼ -6.00%
- Reading proficiency
- 35% ▼ -2.00%
- Median HH income
- $48,306
- Composite
- 27.27/100
- National rank
- #7006
- State rank
- #80 of 174 in GA
Livability — Atlanta
- Score
- 83/100
- State rank
- #6
- US rank
- #919
Category grades
Schools grade is shown separately in the Schools card above.
Census & demographics
- Census place
- Atlanta, GA
- County
- Fulton County · 1,094,430 people
- City population
- 629,525
- Metro
- Atlanta-Sandy Springs-Alpharetta, GA
- Population (ZIP)
- 23,333
- Household income
- $42,089
- Rent vs Own
- Severe rent burden
- 1293.0
Population outlook (Fulton County) Hauer SSP2
- Today (2025)
- 1,203,707 people
- By 2030
- 1,299,706 · +8.0%
- By 2040
- 1,488,256 · +23.6%
- By 2050
- 1,664,580 · +38.3%
- By 2075
- 2,036,072 · +69.2%
- By 2100
- 2,222,402 · +84.6%
Race, ethnicity, and origin ACS 2023
- Neighborhood character
- Predominantly Black (76%)
- Race & ethnicity
- Black 76% White 11% Hispanic / Latino 7% Asian 4% Two or more races 3%
- Hispanic origin (detail)
- Mexican 4% Dominican 1%
- Common ancestry
- Lithuanian 1%
- Foreign-born
- 6% · Canada, China, South Korea
- Languages at home
- 89% English-only · Spanish 5% Other Indo-European 1% Chinese 1%
Political lean MEDSL · Fulton
- 2024 margin
- Solid D (+44.9) · D 71.9% · R 27.0% · Other 1.1%
- 2008→2024 swing
- +9.8pp toward D · 2008: 35.0pp · 2024: 44.9pp
- All cycles
- 2024: D+44.9 2020: D+46.4 2016: D+42.1 2012: D+29.6 2008: D+35.0
Not yet ingested
- Civics
- —
Market trends
- HPI YoY
- ▼ -95.32%
- Current HPI
- 321.4626
- Rent YoY
- ▲ 2.53%
- Metro
- Atlanta-Sandy Springs-Alpharetta, GA
- State GDP YoY
- ▲ 2.66%
- F500 in state
- 28
Industry mix (Fortune 500 HQ in GA)
| Industry | F500 HQs | Revenue |
|---|---|---|
| Paper / Packaging | 2 | $29B |
|
||
| Retail | 1 | $160B |
|
||
| Transportation / Logistics | 1 | $91B |
|
||
| Airlines | 1 | $62B |
|
||
| Consumer Goods | 1 | $47B |
|
||
| Utilities | 1 | $25B |
|
||
Price history
+367.6% since first listed23 events — show timeline
- 2025-12-03 Listing Removed — FMLS
- 2025-10-13 Listing Removed — GAMLS
- 2025-10-08 Relisted — GAMLS
- 2025-09-26 Listed $173,000 GAMLS
- 2025-09-26 Listed $173,000 FMLS
- 2025-09-16 Listing Removed — FMLS
- 2025-09-16 Listing Removed — GAMLS
- 2025-07-19 Price Changed $173,000 GAMLS
- 2025-07-19 Price Changed $173,000 FMLS
- 2025-06-25 Price Changed $175,000 FMLS
- 2025-06-25 Price Changed $175,000 GAMLS
- 2025-04-11 Price Changed $185,000 FMLS
- 2025-04-11 Price Changed $185,000 GAMLS
- 2025-01-31 Price Changed $195,000 FMLS
- 2025-01-31 Price Changed $195,000 GAMLS
- 2024-12-20 Listed $200,000 FMLS
- 2024-12-20 Listed $200,000 GAMLS
- 2020-07-27 Sold (Public Records) $87,000 Public Records
- 2010-02-19 Price Changed $14,400 GAMLS
- 2010-01-15 Price Changed $16,200 GAMLS
- 2000-05-17 Sold (Public Records) $70,000 Public Records
- 1987-06-11 Sold (Public Records) $33,000 Public Records
- 1982-08-09 Sold (Public Records) $37,000 Public Records
Property tax history
+22.6%/yrLatest (2025): $1,949 · -0.1% YoY. Source: county tax records.
Cash-flow waterfall
monthlySold comps — $/sqft
last 12 mo · ≤1 miLoading sold comps…