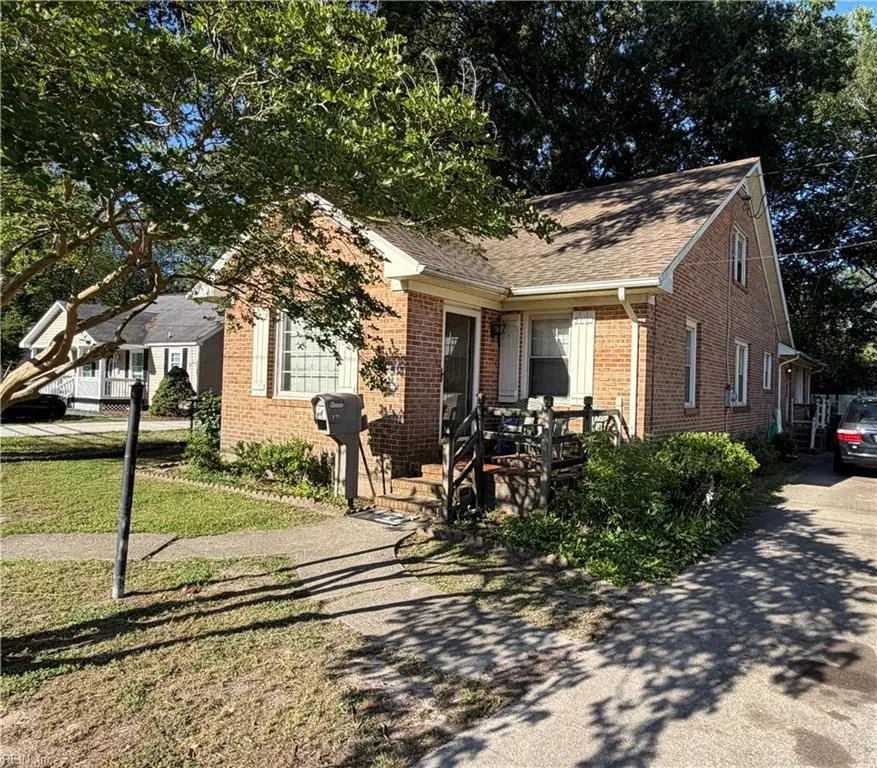
511 Pretlow St · Franklin, VA
Flood risk No data
- FEMA flood zone
- —
- Chance of flooding over 30 yrs
- —
- Est. flood insurance / yr
- —
Fire risk No data
- Est. fire insurance / yr
- —
Heat risk No data
- Hot days now (above threshold)
- —
- Hot days in 30 yrs
- —
Wind risk No data
- Chance of severe wind over 30 yrs
- —
Air-quality risk No data
- Unhealthy air days now
- —
- Unhealthy air days in 30 yrs
- —
Risk factors via First Street. Map © Google.
Why this score? — see what drove the C grade
The composite is a weighted blend of 9 inputs, each scored 0–100. Each bar is that input's sub-score; the figure is the points it added to the 100-point composite (weight × sub-score).
- Cash flow +20.4/30.0
- ARV discount +15.0/15.0
- DSCR +6.5/10.0
- 1% rule +5.0/10.0
- Schools +3.0/10.0
- Livability +3.0/5.0
- Rent growth +2.5/5.0
- Condition / age +2.5/5.0
- Appreciation +0.0/10.0
$170,000
🖨 Deal sheet (PDF) 📄 Offer letter ✓ Due diligence
Listing remarks
Spacious 3-bedroom, 2-1/2 bath brick home offering over 2,300 square feet of living space in the heart of Franklin. Features include an updated central heating and cooling system, updated stovetop, generous room sizes, and plenty of potential. Conveniently located near schools, shopping, and dining. Property is being sold as-is. Investors welcome! Great opportunity for a primary residence, rental property, or renovation project. Schedule your showing today.
Key facts
- 6,751 sq ft lot
- Built 1942
- Listed 17 days
Property features AI
Finance
- HOA & community: No HOA fees
Exterior
- Parking: Off-street parking; Driveway spaces; On-street parking
- Utilities: City/County water; City/County sewer; Electric water heater; Electric power
- Home design: Detached traditional home; 2 stories; Crawl foundation
- Construction: Brick exterior; Crawl space foundation; Asphalt shingle roof
- Exterior features: Back fenced yard; Brick siding; Asphalt shingle roof
Interior
- Kitchen: Electric range; Dishwasher; Refrigerator
- Bedrooms: 1 bedroom with ensuite; Bedroom and full bathroom on 1st floor
- Flooring: Carpet; Vinyl
- Bathrooms: 2 full bathrooms; 1 half bathroom
- Heating & cooling: Electric heating; Central air conditioning
- Interior features: Gas-propane fireplace; 6 total rooms; Attic; Breakfast area; Foyer; Porch
- Laundry & utility: Washer hookup; Dryer hookup
Neighborhood map
What this means for you Summary
Snapshot
- This is a 3-bed/3.0-bath single-family listed at $170k.
Deal economics
- At list price, monthly cash flow is $222 ($3k/yr) — positive.
- The deal already cash-flows at list — no discount required.
- Meets the 1% rule at list price ($2k rent vs $170k).
- Recommended offer: $167k (1.5% below list) — sets the bar for market timing.
- Cap rate 7.9% vs local median 3.8% in Franklin — top-decile yield for the area; either an underpriced asset or a hidden risk that comps aren't pricing in. Stress-test before assuming the spread holds.
Location & tenants
- Location reads 59/100 on livability (#461 in VA) — a working-class tenant base; expect higher turnover. Strengths: cost of living A+, housing A+, health & safety B+; Watch: crime F, amenities F, commute F.
- Franklin City Public School District (town): math 23% / reading 51% proficiency, ranked #127 of 131 in VA (top 97%) — families likely to look elsewhere, expect single-tenant / working-renter base with shorter leases; 75% free/reduced lunch — lower-income household profile, screen leases tightly.
- Zoned schools: S.P. Morton Elementary (math 16% / reading 38%, grade F, #1,029 of 1,108 statewide, top 94%, 481 students, 101% FRL); Joseph P. King Jr. Middle (math 23% / reading 53%, grade F, #313 of 342 statewide, top 92%, 164 students, 99% FRL); Franklin High (math 37% / reading 82%, grade C+, #247 of 319 statewide, top 80%, 378 students, 100% FRL) — zoned schools average 100% FRL vs 75% district-wide (25 pts higher); higher-poverty schools than district average — tighter screening recommended.
- Market conditions: 137 active listings in the ZIP; 1 comparable units currently listed for rent nearby.
Forward outlook
- Local home prices are declining (-3.0%/yr); year-one equity from $1k of loan paydown is wiped out by about $5k of value loss. Plan a longer hold.
- Franklin County population projected at -22% by 2050 — secular population decline; favor cash flow + early exit over multi-decade hold.
Negotiation context
- It's been on market 18 days — a 2% lower offer ($167k) is reasonable based on typical stale-listing flexibility.
Risks & watch-outs
- Watch-outs: built in 1942 — expect roof / HVAC / electrical / plumbing capex.
Questions for the listing agent
- Built in 1942 — when were the roof, HVAC, electrical panel, plumbing, and water heater last replaced?
- Is there a deadline driving the sale (1031 exchange, divorce, estate, relocation)? That informs how much negotiation room exists.
- Schools are B-rated — typically a magnet for longer-tenancy family renters. What's the average tenant stay here, and is there a school-zone premium baked into asking?
- Crime grade is F in this area — have there been break-ins, vandalism, or insurance claims at this property in the last 3 years? What carrier currently insures it and at what premium?
- What's the average days-on-market for RENTAL listings here right now (not sales)? A rising rental-DOM trend means longer vacancies and softer asking-rent achievability than the comps imply.
- What's the recent tenant-quality profile in this submarket — average credit score on applications, eviction rate, late-payment / NSF rate, and stable-employment percentage? A property-management company in the area should have these aggregated.
- How much new for-sale + rental construction is in the pipeline within 1–3 miles? Heavy new supply typically softens prices + rents 12–24 months out; constrained supply supports both.
Investment metrics
- 1% rule
- 1.00% ✓
- Cap rate
- 7.86%
- Cash-on-cash
- 5.59%
- DSCR
- 1.25
- GRM
- 8.3
CMA / ARV
- ARV (on-the-fly)
- $334,978
- Comps found
- 6
Show comp detail 6 sales within ~0.75 mi
| Address | Dist | Beds/Ba | Sqft | Sold | Price | $/sf | Match |
|---|---|---|---|---|---|---|---|
| 609 Pace St | 0.44mi | 4/2.5 (+1) | 2,356 (-0%) | 2mo | $330,000 | $140 | 71 |
| 100 Langston Ct | 0.18mi | 3/2.5 | 2,100 (-11%) | 8mo | $320,000 | $152 | 65 |
| 303 W Second Ave | 0.50mi | 3/3.0 | 2,183 (-8%) | 2mo | $165,000 | $76 | 63 |
| 504 Cameron St | 0.67mi | 3/2.0 | 2,100 (-11%) | 4mo | $299,000 | $142 | 43 |
| 32454 Pebble Creek Dr | 0.60mi | 3/2.5 | 2,646 (+12%) | 9mo | $390,000 | $147 | 42 |
| 325 Clay St | 0.69mi | 3/2.5 | 2,013 (-15%) | 18mo | $285,000 | $142 | 27 |
Match score weights: distance 35% · size 25% · config 20% · recency 20%. Top-matched comps best support the ARV.
Projected returns pro-forma
-3.0% appreciation · 3.0% rent growth · sell at horizon
- IRR
- -7.6%
- Equity multiple
- 0.72×
- Total profit
- $-13,429
- Equity at exit
- $25,348
- IRR
- 1.9%
- Equity multiple
- 1.14×
- Total profit
- $6,466
- Equity at exit
- $14,698
Cash invested: $47,600 (down + closing). Projections, not guarantees.
Landlord ↔ Tenant lean methodology
- Overall (STATE)
- 55 Moderately Landlord-Leaning
- State Virginia
- 55 Moderately Landlord-Leaning · D+2
- County
- — inherits STATE
- City
- — inherits STATE
ZIP-level market 23851
- Home prices YoY
- -10.2%
- Active inventory
- 137
- Price-to-rent
- 8.3×
Monthly cashflow live
- Estimated rent
- $1,700 medium interval (Pro) →
- Mortgage (P&I)
- −$891
- Tax from tax record
- −$159 /mo · $1,907/yr
- Insurance
- −$71
- HOA
- −$0
- Vacancy / Maint / Mgmt
- −$357
- Net cashflow
- $222
Break-even live
Sensitivity live
| Price | -10% $318 | -5% $270 | +0% $222 | +5% $174 | +10% $126 |
|---|---|---|---|---|---|
| Rent | -10% $87 | -5% $155 | +0% $222 | +5% $289 | +10% $356 |
| Rate | -1.0pp $307 | -0.5pp $265 | base $222 | +0.5pp $178 | +1.0pp $133 |
UW: 25.0% down · 7.5% · 30yr · 1.5% tax · 5.0% vac · 8.0% maint · 8.0% mgmt
Financing live
Cash to close
- Down payment
- $42,500
- Closing costs
- $5,100
- Reserves months
- —
- Total cash needed
- —
Loan-product check · same deal, 3 products live
Conventional
25% down · 7.5% · 30yr
- Down + closing
- —
- Monthly P&I
- —
- Monthly cashflow
- —
- DSCR
- —
- Eligible?
- —
Personal DTI + credit; lowest rate.
DSCR
20% down · 8.5% · 30yr
- Down + closing
- —
- Monthly P&I
- —
- Monthly cashflow
- —
- DSCR
- —
- Eligible?
- —
No personal income docs; deal must DSCR.
Hard money
10% down · 12.0% · 12mo
- Down + closing
- —
- Monthly P&I
- —
- Monthly cashflow
- —
- DSCR
- —
- Eligible?
- —
Short-term bridge; refi at stabilization.
Rent comps 1 comps
| Address | Beds | Baths | Sqft | Rent | $/sqft | DOM | Units | Dist |
|---|---|---|---|---|---|---|---|---|
| 1700 South St Franklin, VA | 3.0 | 2.0 | 2500 | $1,700 | $0.68 | 45d | 1 | 0.64mi |
Listing history 15 events
-
2026-06-21days on market $170,000 Active 18 DOM
-
2026-06-21days on market $170,000 Active 17 DOM
-
2026-06-18days on market $170,000 Active 15 DOM
-
2026-06-17days on market $170,000 Active 14 DOM
-
2026-06-16days on market $170,000 Active 13 DOM
-
2026-06-15days on market $170,000 Active 12 DOM
-
2026-06-15days on market $170,000 Active 11 DOM
-
2026-06-13days on market $170,000 Active 10 DOM
-
2026-06-12days on market $170,000 Active 9 DOM
-
2026-06-09days on market $170,000 Active 6 DOM
-
2026-06-08days on market $170,000 Active 5 DOM
-
2026-06-08days on market $170,000 Active 4 DOM
-
2026-06-05days on market $170,000 Active 2 DOM
-
2026-06-04remarks 461-char remark
-
2026-06-04$170,000 Active 1 DOM
ⓘ Source: listings_history table (triggers on properties + properties_extension) + one-shot
backfill from property_details.listing_events for pre-trigger history.
Tax reassessment forecast VA · Resets to sale price
- Current annual tax
- $1,907 · $159/mo
- Projected year-2 tax
- $1,907 · $159/mo
- Expected delta
- $0/yr ($0/mo · 0.0%)
ⓘ Screening estimate from a state-policy table — verify with the county assessor before closing.
Nearby sold comps map
Loading sold comps map…
Walkable amenities ~0.75 mi
Loading nearby amenities…
Taxation est. · year 1
- Rental income
- $20,400
- − Mortgage interest
- −$9,523
- − Property taxes
- −$1,907
- − Insurance
- −$850
- − Repairs & maintenance
- −$1,632
- − Management
- −$1,632
- − Depreciation
- −$4,945
- Taxable loss
- −$89
- Est. tax savings @ 24.0%
- +$21
- After-tax cash flow
- $2,683/yr
For passive investors: Depreciation is non-cash, so a rental often shows a tax loss while cash-flowing — sheltering income. Rental losses are passive: they offset passive income freely, and up to $25,000/yr can offset ordinary (W-2) income if you actively participate and your MAGI is under $100k (phasing out to $0 by $150k); unused losses carry forward. On sale, claimed depreciation is recaptured at up to 25%, and gains may owe capital-gains tax (a 1031 exchange can defer both). Figures are a year-1 estimate at your 24.0% rate — not tax advice; consult a CPA.
Schools (NCES district)
- District
- Franklin City Public School District
- NCES district ID
- 5101410
- Math proficiency
- 23% ▼ -48.00%
- Reading proficiency
- 51% ▼ -18.00%
- Median HH income
- $35,138
- Composite
- 30.47/100
- National rank
- #6227
- State rank
- #127 of 131 in VA
Livability — Franklin
- Score
- 59/100
- State rank
- #461
- US rank
- #19645
Category grades
Schools grade is shown separately in the Schools card above.
Census & demographics
- Census place
- Franklin, VA
- Population (ZIP)
- 13,481
Population outlook (Franklin County) Hauer SSP2
- Today (2025)
- 7,817 people
- By 2030
- 7,480 · -4.3%
- By 2040
- 6,803 · -13.0%
- By 2050
- 6,124 · -21.7%
- By 2075
- 4,484 · -42.6%
- By 2100
- 2,967 · -62.0%
Race, ethnicity, and origin ACS 2023
- Neighborhood character
- Diverse neighborhood (Simpson 0.60)
- Race & ethnicity
- Black 45% White 44% Two or more races 8% Hispanic / Latino 2% Asian 2%
- Common ancestry
- Serbian 2% Slovak 1% Lithuanian 1%
- Foreign-born
- 2% · South Korea, Canada
- Languages at home
- 97% English-only · Spanish 2% Other Indo-European 1%
Political lean MEDSL · Franklin
- 2024 margin
- Strong D (+22.8) · D 60.9% · R 38.1% · Other 1.1%
- 2008→2024 swing
- -5.3pp toward R · 2008: 28.1pp · 2024: 22.8pp
- All cycles
- 2024: D+22.8 2020: D+25.6 2016: D+27.1 2012: D+30.7 2008: D+28.1
Not yet ingested
- Civics
- —
Market trends
- HPI YoY
- ▼ -33.51%
- Current HPI
- 293.564
- Rent YoY
- —
- Metro
- —
- State GDP YoY
- ▲ 2.40%
- F500 in state
- 50
Industry mix (Fortune 500 HQ in VA)
| Industry | F500 HQs | Revenue |
|---|---|---|
| Aerospace / Defense | 4 | $236B |
|
||
| Technology / Defense | 3 | $32B |
|
||
| Financial Services | 2 | $176B |
|
||
| Utilities | 2 | $27B |
|
||
| Insurance | 2 | $25B |
|
||
| Technology | 2 | $15B |
|
||
Price history
1 event — show timeline
- 2026-06-03 Listed $170,000 REINMLS
Property tax history
+4.0%/yrLatest (2025): $1,907 · +0.0% YoY. Source: county tax records.
Cash-flow waterfall
monthlySold comps — $/sqft
last 12 mo · ≤1 miLoading sold comps…