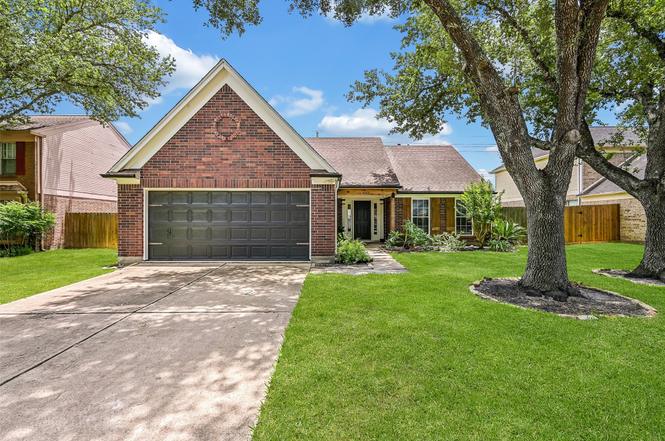
4009 Spring Branch Dr E · Pearland, TX
Flood risk 1/10 · Minimal
- FEMA flood zone
- X (unshaded)
- Chance of flooding over 30 yrs
- 0.0%
- Est. flood insurance / yr
- $507 – $1,088
Fire risk 2/10 · Minimal
- Est. fire insurance / yr
- $1,222 – $2,270
Heat risk 9/10 · Severe
- Hot days now (above 108°F)
- 7 days/yr
- Hot days in 30 yrs
- 24 days/yr
Wind risk 9/10 · Severe
- Chance of severe wind over 30 yrs
- 99.0%
Air-quality risk 2/10 · Minimal
- Unhealthy air days now
- 1 days/yr
- Unhealthy air days in 30 yrs
- 1 days/yr
Risk factors via First Street. Map © Google.
Why this score? — see what drove the D- grade
The composite is a weighted blend of 9 inputs, each scored 0–100. Each bar is that input's sub-score; the figure is the points it added to the 100-point composite (weight × sub-score).
- Cash flow +9.2/30.0
- ARV discount +8.3/15.0
- Schools +5.4/10.0
- Livability +4.0/5.0
- 1% rule +3.3/10.0
- Rent growth +2.9/5.0
- DSCR +2.6/10.0
- Condition / age +2.5/5.0
- Appreciation +0.0/10.0
$295,000
🖨 Deal sheet 📄 Offer letter ✓ Due diligence
Listing remarks
Beautifully updated one-story home nestled beneath mature oak trees with charming farmhouse-inspired curb appeal, featuring a welcoming front porch with wood beams & custom shutters. This functional floor plan offers 3 bedrooms, 2 baths, & spacious living areas designed for everyday comfort or entertaining. The family room showcases vaulted ceilings, hand-scraped wood flooring, a cozy gas-log fireplace, & abundant natural light. The island kitchen features granite countertops, solid oak cabinetry, a 5-burner gas range, Bosch dishwasher, & breakfast area with a wall of Low-E impact-resistant windows. The private primary suite offers backyard views & a beautifully r
Key facts
- Island kitchen
- Large backyard
- Oversized garage
Tags
Property features AI
Finance
- HOA & community: Houston Community Management HOA; Annual association fee of $150 covering common areas; Community curbs
Exterior
- Parking: Attached garage (2 spaces); Driveway; Garage door opener; Oversized garage
- Security: Smoke detector(s)
- Utilities: Public water; Public sewer
- Home design: Residential property; Faces west; Full ownership; Slab foundation
- Construction: Built in 1991; Brick and wood siding construction; Composition roof; Slab foundation
- Exterior features: Deck; Fence (back yard); Porch; Patio; Private yard; Greenbelt; Subdivision; Concrete road surface
Interior
- Kitchen: Convection oven; Gas oven; Gas range; Oven; Microwave; Dishwasher; Disposal; Kitchen island; Pantry; Granite counters; Breakfast bar
- Bedrooms: 3 bedrooms possible
- Flooring: Plank; Tile; Vinyl; Wood
- Bathrooms: 2 full bathrooms; Double vanity
- Heating & cooling: Central heating (gas); Central electric air conditioning; Has heating; Has cooling; Programmable thermostat; Fireplace (gas, gas log)
- Interior features: Breakfast bar; Double vanity; Granite counters; High ceilings; Kitchen island; Pantry; Tub with shower; Vanity; Vaulted ceilings; Ceiling fans; Programmable thermostat; Low emissivity windows
- Laundry & utility: Washer hookup; Electric dryer hookup; Gas dryer hookup
Neighborhood map
What this means for you Summary
Snapshot
- This is a 3-bed/2.0-bath single-family listed at $295k.
Deal economics
- At list price, monthly cash flow is $-221 ($-3k/yr) — negative.
- To cash-flow at today's rent, offer at most $256k (13.2% below list).
- To meet the 1% rule (rent ≥ 1% of price), the offer needs to be $245k (16.8% below list).
- Recommended offer: $245k (16.8% below list) — sets the bar for 1% rule.
- Cap rate 5.4% vs local median 3.0% in Pearland — top-decile yield for the area; either an underpriced asset or a hidden risk that comps aren't pricing in. Stress-test before assuming the spread holds.
Location & tenants
- Location reads 81/100 on livability (#32 in TX, #1,539 nationally) — a professional / high-income tenant draw. Strengths: employment A+, housing A+, crime A; Watch: amenities D-, commute F.
- Pearland ISD (suburban): math 58% / reading 59% proficiency, ranked #47 of 826 in TX (top 6%) — acceptable for families but not a draw, mixed tenant base, ~2y average lease.
- Zoned schools: Pearland J H South (math 56% / reading 58%, grade B, #212 of 1,662 statewide, top 13%, 895 students, 52% FRL); Pearland H S (math 58% / reading 64%, grade C+, #258 of 1,632 statewide, top 16%, 3,261 students, 36% FRL) — zoned schools average 44% FRL vs 26% district-wide (18 pts higher); higher-poverty schools than district average — tighter screening recommended.
- Market conditions: Rents rising (+1.5%/yr); 497 active listings in the ZIP; 3 comparable units currently listed for rent nearby; rentals leasing fast (median 12d on market — plan ~1-2 weeks tenant-placement turnaround); high-income renter base; 3,960 units permitted in Brazoria County in 2024 (593 in 5+ unit buildings).
Forward outlook
- Local home prices are declining (-3.0%/yr); year-one equity from $2k of loan paydown is wiped out by about $9k of value loss. Plan a longer hold.
- Brazoria County population projected at +44% by 2050 — long-run rental-demand tailwind backs the buy-and-hold thesis.
Negotiation context
- Only 2 days on market — expect competitive offers; lowballing is unlikely to land.
- 2 sale attempts since 3y ago with the ask held roughly flat each time — persistent listings suggest the price (not the market) is what's stuck; bring a comps-based counter.
Risks & watch-outs
- Climate carrying-cost: severe wind risk, 99% chance of damaging wind over 30y; extreme-heat days projected 7→24/yr by 2055 (HVAC capex compounding) — expect insurance premiums to compound above CPI over the hold.
Questions for the listing agent
- What do current leases actually rent for vs. the listed asking? Can we see a recent rent roll and the last 12 months of T-12 income?
- What does the HOA fee cover, when was the last increase, and are there any pending special assessments or reserve-fund shortfalls?
- Is there a deadline driving the sale (1031 exchange, divorce, estate, relocation)? That informs how much negotiation room exists.
- Schools are A-rated — typically a magnet for longer-tenancy family renters. What's the average tenant stay here, and is there a school-zone premium baked into asking?
- The area grade is low — what's the realistic commute time and amenity access for the typical tenant pool here? Any planned neighborhood developments (good or bad) we should know about?
- What's the average days-on-market for RENTAL listings here right now (not sales)? A rising rental-DOM trend means longer vacancies and softer asking-rent achievability than the comps imply.
- What's the recent tenant-quality profile in this submarket — average credit score on applications, eviction rate, late-payment / NSF rate, and stable-employment percentage? A property-management company in the area should have these aggregated.
- How much new for-sale + rental construction is in the pipeline within 1–3 miles? Heavy new supply typically softens prices + rents 12–24 months out; constrained supply supports both.
Investment metrics
- 1% rule
- 0.83% ✗
- Cap rate
- 5.40%
- Cash-on-cash
- -3.20%
- DSCR
- 0.86
- GRM
- 10.0
CMA / ARV
- ARV (on-the-fly)
- $300,424
- Comps found
- 12
Show comp detail 12 sales within ~0.75 mi
| Address | Dist | Beds/Ba | Sqft | Sold | Price | $/sf | Match |
|---|---|---|---|---|---|---|---|
| 4110 Cleburne Dr | 0.27mi | 3/2.0 | 1,513 (-5%) | 1mo | $295,000 | $195 | 77 |
| 4113 Cleburne Dr | 0.28mi | 3/2.0 | 1,513 (-5%) | 9mo | $319,000 | $211 | 71 |
| 4002 Fernwood Dr | 0.21mi | 3/2.0 | 1,705 (+7%) | 14mo | $320,000 | $188 | 67 |
| 3911 Spring Circle Dr W | 0.44mi | 3/2.0 | 1,705 (+7%) | 3mo | $335,000 | $196 | 66 |
| 4109 Seminole Dr | 0.29mi | 3/2.0 | 1,513 (-5%) | 22mo | $299,900 | $198 | 60 |
| 4101 Seminole Dr | 0.27mi | 3/2.5 | 1,724 (+8%) | 17mo | $305,000 | $177 | 58 |
| 4511 Teal Glen St | 0.63mi | 3/2.0 | 1,661 (+4%) | 9mo | $282,500 | $170 | 56 |
| 4522 Fox Run St | 0.65mi | 3/2.0 | 1,661 (+4%) | 11mo | $269,000 | $162 | 54 |
| 4010 Spring Meadow Dr | 0.32mi | 3/2.0 | 1,785 (+12%) | 14mo | $289,900 | $162 | 54 |
| 4520 Fox Run St | 0.66mi | 3/2.0 | 1,476 (-8%) | 6mo | $285,000 | $193 | 52 |
| 3508 Yellowstone Cir | 0.71mi | 3/2.0 | 1,697 (+6%) | 11mo | $289,000 | $170 | 48 |
| 3912 Ashwood Dr | 0.47mi | 3/2.0 | 1,788 (+12%) | 13mo | $300,000 | $168 | 48 |
Match score weights: distance 35% · size 25% · config 20% · recency 20%. Top-matched comps best support the ARV.
Projected returns pro-forma
-3.0% appreciation · 1.47% rent growth · sell at horizon
- IRR
- -23.4%
- Equity multiple
- 0.21×
- Total profit
- $-65,461
- Equity at exit
- $43,985
- IRR
- -23.1%
- Equity multiple
- -0.08×
- Total profit
- $-89,448
- Equity at exit
- $25,506
Cash invested: $82,600 (down + closing). Projections, not guarantees.
Landlord ↔ Tenant lean methodology
- Overall (STATE)
- 87 Strongly Landlord-Friendly
- State Texas
- 87 Strongly Landlord-Friendly · R+5
- County
- — inherits STATE
- City
- — inherits STATE
ZIP-level market 77584
- Home prices YoY
- -18.7%
- Rents YoY
- 1.5%
- Active inventory
- 497
- Price-to-rent
- 10.0×
Monthly cashflow live
- Estimated rent
- $2,454 medium interval (Pro) →
- Mortgage (P&I)
- −$1,547
- Tax from tax record
- −$476 /mo · $5,717/yr
- Insurance
- −$123
- HOA
- −$13
- Vacancy / Maint / Mgmt
- −$515
- Net cashflow
- $-221
Break-even live
UW: 25.0% down · 7.5% · 30yr · 1.5% tax · 5.0% vac · 8.0% maint · 8.0% mgmt
Financing live
Cash to close
- Down payment
- $73,750
- Closing costs
- $8,850
- Reserves months
- —
- Total cash needed
- —
Loan-product check · same deal, 3 products live
Conventional
25% down · 7.5% · 30yr
- Down + closing
- —
- Monthly P&I
- —
- Monthly cashflow
- —
- DSCR
- —
- Eligible?
- —
Personal DTI + credit; lowest rate.
DSCR
20% down · 8.5% · 30yr
- Down + closing
- —
- Monthly P&I
- —
- Monthly cashflow
- —
- DSCR
- —
- Eligible?
- —
No personal income docs; deal must DSCR.
Hard money
10% down · 12.0% · 12mo
- Down + closing
- —
- Monthly P&I
- —
- Monthly cashflow
- —
- DSCR
- —
- Eligible?
- —
Short-term bridge; refi at stabilization.
Rent comps 3 comps
| Address | Beds | Baths | Sqft | Rent | $/sqft | DOM | Units | Dist |
|---|---|---|---|---|---|---|---|---|
| 4009 Spring Forest Dr Pearland, TX | 3.0 | 2.0 | 1976 | $2,700 | $1.37 | 1d | 1 | 0.33mi |
| 6207 Winter Oak St Pearland, TX | 3.0 | 2.5 | 1884 | $2,340 | $1.24 | 11d | 1 | 1.23mi |
| 3610 Kale St Pearland, TX | 3.0 | 2.5 | 1680 | $2,140 | $1.27 | 18d | 1 | 1.42mi |
HOA detail
- Monthly dues
- $13 · $156/yr
- Likely covers
- gas
Listing history 3 events
-
2026-06-18days on market $295,000 Active 2 DOM
-
2026-06-16remarks 679-char remark
-
2026-06-16$295,000 Active 1 DOM
ⓘ Source: listings_history table (triggers on properties + properties_extension) + one-shot
backfill from property_details.listing_events for pre-trigger history.
Tax reassessment forecast TX · Resets to sale price
- Current annual tax
- $5,717 · $476/mo
- Projected year-2 tax
- $5,717 · $476/mo
- Expected delta
- $0/yr ($0/mo · 0.0%)
ⓘ Screening estimate from a state-policy table — verify with the county assessor before closing.
Climate risk First Street
- Flood 1/10 Low FEMA zone X (unshaded) · 0% chance over 30 yrs
- Wildfire 2/10 Low
- Heat 9/10 Extreme 7 d/yr ≥108°F today · 24 d/yr by 30 yrs out
- Wind 9/10 Extreme 99% chance of damaging wind over 30 yrs
- Air quality 2/10 Low 1 unhealthy d/yr today · 1 by 30 yrs out
Nearby sold comps map
Loading sold comps map…
Walkable amenities ~0.75 mi
Loading nearby amenities…
Taxation est. · year 1
- Rental income
- $29,450
- − Mortgage interest
- −$16,525
- − Property taxes
- −$5,717
- − Insurance
- −$1,475
- − Repairs & maintenance
- −$2,356
- − Management
- −$2,356
- − HOA
- −$156
- − Depreciation
- −$8,582
- Taxable loss
- −$7,717
- Est. tax savings @ 24.0%
- +$1,852
- After-tax cash flow
- $-795/yr
For passive investors: Depreciation is non-cash, so a rental often shows a tax loss while cash-flowing — sheltering income. Rental losses are passive: they offset passive income freely, and up to $25,000/yr can offset ordinary (W-2) income if you actively participate and your MAGI is under $100k (phasing out to $0 by $150k); unused losses carry forward. On sale, claimed depreciation is recaptured at up to 25%, and gains may owe capital-gains tax (a 1031 exchange can defer both). Figures are a year-1 estimate at your 24.0% rate — not tax advice; consult a CPA.
Schools (NCES district)
- District
- Pearland ISD
- NCES district ID
- 4834440
- Math proficiency
- 58% ▼ -13.00%
- Reading proficiency
- 59% ▼ -6.00%
- Median HH income
- $90,091
- Composite
- 53.67/100
- National rank
- #1430
- State rank
- #47 of 826 in TX
Livability — Pearland
- Score
- 81/100
- State rank
- #32
- US rank
- #1539
Category grades
Schools grade is shown separately in the Schools card above.
Census & demographics
- Census place
- Pearland, TX
- County
- Brazoria County · 374,982 people
- City population
- 142,397
- Metro
- Houston-The Woodlands-Sugar Land, TX
- Population (ZIP)
- 91,065
- Household income
- $121,872
- Rent vs Own
- Severe rent burden
- 1539.0
Population outlook (Brazoria County) Hauer SSP2
- Today (2025)
- 420,414 people
- By 2030
- 457,585 · +8.8%
- By 2040
- 532,232 · +26.6%
- By 2050
- 605,399 · +44.0%
- By 2075
- 779,358 · +85.4%
- By 2100
- 883,759 · +110.2%
Race, ethnicity, and origin ACS 2023
- Neighborhood character
- Highly diverse neighborhood (Simpson 0.76)
- Race & ethnicity
- White 32% Hispanic / Latino 22% Asian 21% Black 21% Two or more races 14%
- Hispanic origin (detail)
- Mexican 16% Puerto Rican 2%
- Common ancestry
- Lithuanian 2% Romanian 1% Slovak 1%
- Foreign-born
- 25% · Canada, China, Vietnam
- Languages at home
- 64% English-only · Spanish 14% Chinese 4% Other Indo-European 4%
Political lean MEDSL · Brazoria
- 2024 margin
- R (+19.7) · D 39.5% · R 59.2% · Other 1.3%
- 2008→2024 swing
- +9.9pp toward D · 2008: -29.6pp · 2024: -19.7pp
- All cycles
- 2024: R+19.7 2020: R+18.2 2016: R+24.6 2012: R+34.2 2008: R+29.6
Not yet ingested
- Civics
- —
Market trends
- HPI YoY
- ▼ -49.09%
- Current HPI
- 213.4011
- Rent YoY
- ▲ 1.47%
- Metro
- Houston-The Woodlands-Sugar Land, TX
- State GDP YoY
- ▲ 3.95%
- F500 in state
- 110
Industry mix (Fortune 500 HQ in TX)
| Industry | F500 HQs | Revenue |
|---|---|---|
| Energy | 16 | $1,198B |
|
||
| Technology | 5 | $198B |
|
||
| Engineering / Construction | 4 | $72B |
|
||
| Energy Services | 3 | $60B |
|
||
| Utilities | 3 | $41B |
|
||
| Healthcare | 2 | $330B |
|
||
Price history
+12588.2% since first listed5 events — show timeline
- 2026-06-16 Listed $295,000 HARMLS
- 2024-02-03 Rental Removed $2,325 HARMLS
- 2023-12-12 Listed for Rent $2,325 HARMLS
- 2016-03-31 Sold (Public Records) — Public Records
- 2002-06-17 Sold (Public Records) — Public Records
Property tax history
+3.7%/yrLatest (2025): $5,717 · +3.8% YoY. Source: county tax records.
Cash-flow waterfall
monthlySold comps — $/sqft
last 12 mo · ≤1 miLoading sold comps…