 6-Plex
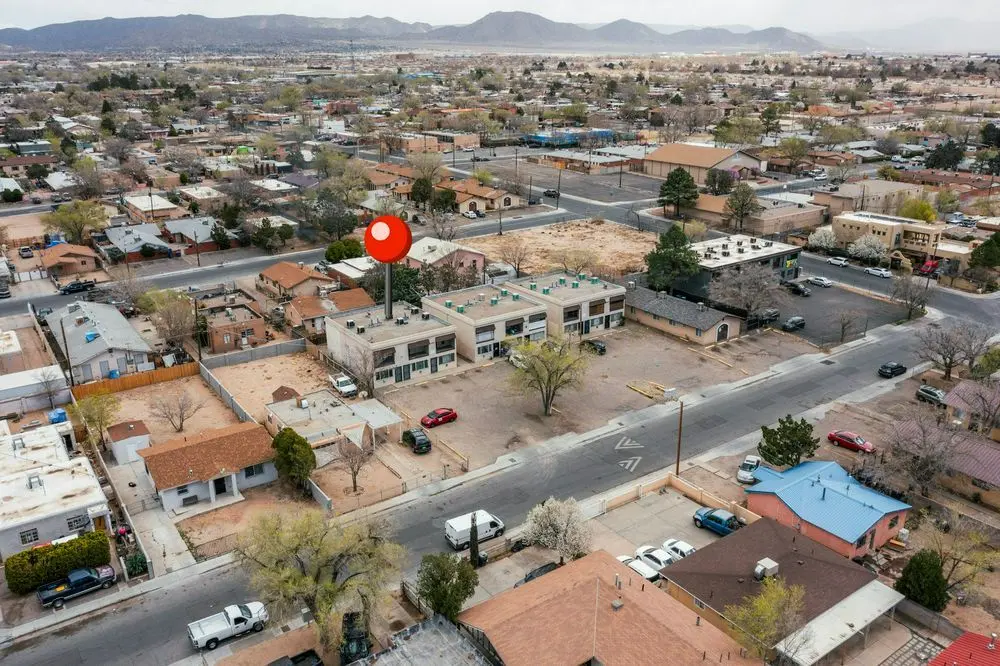
328 Grove St SE · Albuquerque, NM
Flood risk 1/10 · Minimal
- FEMA flood zone
- X (unshaded)
- Chance of flooding over 30 yrs
- 0.0%
- Est. flood insurance / yr
- $507 – $1,088
Fire risk 1/10 · Minimal
- Est. fire insurance / yr
- $706 – $1,312
Heat risk 4/10 · Minor
- Hot days now (above 94°F)
- 6 days/yr
- Hot days in 30 yrs
- 15 days/yr
Wind risk 1/10 · Minimal
- Chance of severe wind over 30 yrs
- —
Air-quality risk 2/10 · Minimal
- Unhealthy air days now
- 1 days/yr
- Unhealthy air days in 30 yrs
- 3 days/yr
Risk factors via First Street. Map © Google.
Why this score? — see what drove the C grade
The composite is a weighted blend of 9 inputs, each scored 0–100. Each bar is that input's sub-score; the figure is the points it added to the 100-point composite (weight × sub-score).
- Cash flow +26.0/30.0
- DSCR +8.7/10.0
- 1% rule +5.8/10.0
- Schools +5.3/10.0
- Livability +3.6/5.0
- Rent growth +3.1/5.0
- Condition / age +2.5/5.0
- ARV discount +0.0/15.0
- Appreciation +0.0/10.0
$459,000
🖨 Deal sheet 📄 Offer letter ✓ Due diligence
Multi-family units
County records classify this as Multi-Family (5+ Unit). Listing-text estimate: 6 units. confirmed
5+ unit building — per-unit beds/baths from public records are typically unavailable; the breakdown below (if shown) is an estimate from the listing text.
Listing remarks MLS
6 Unit income producing property. Townhouse style living. All one bedroom one bathroom two story units. New luxury vinyl flooring in units, new fridges in all units. Some units have new swamp coolers and new water heaters. All bedroom have brand new front doors, new security doors, and new windows. All units recently painted. Each unit can be rented between $750 - $800 per month. Open concept living room downstairs with full kitchen, gas stove and pantry. Bedroom is upstairs with walk in closet and full bath. Off street parking for residents. Close to VA hospital, Expo New Mexico and Tingley Coliseum. Highland high school and Highland pool just down the street. Art stop and public transportation are near by.
Key facts
- New front doors
- New fridges
- New swamp coolers
Tags
Neighborhood map
What this means for you Summary
Snapshot
- This is a 6 × 1-bed/1-bath units multifamily listed at $459k.
Deal economics
- At list price, monthly cash flow is $1k ($14k/yr) — positive. Per door: $189/mo.
- The deal already cash-flows at list — no discount required.
- Meets the 1% rule at list price ($5k rent vs $459k).
- Recommended offer: $404k (12.0% below list) — sets the bar for market timing.
- Cap rate 9.3% vs local median 3.7% in Albuquerque — top-decile yield for the area; either an underpriced asset or a hidden risk that comps aren't pricing in. Stress-test before assuming the spread holds.
Location & tenants
- Location reads 72/100 on livability (#13 in NM) — a middle-class / working-renter tenant base. Strengths: amenities A+, commute A+, cost of living A+; Watch: schools D-, crime F.
- Albuquerque Public Schools (urban): math 51% / reading 75% proficiency, ranked #3 of 29 in NM (top 10%) — acceptable for families but not a draw, mixed tenant base, ~2y average lease; 60% free/reduced lunch — lower-income household profile, screen leases tightly.
- Market conditions: Rents rising (+2.5%/yr); 164 active listings in the ZIP; lower-income renter base — watch delinquency; 1,316 units permitted in Bernalillo County in 2024 (546 in 5+ unit buildings).
- At $4,961/mo this rent would consume 139% of the median local household income ($43k/yr) (locally 3480% of renters already pay >50% of income on rent) — very limited rent-growth headroom before tenants either downsize or default.
Forward outlook
- Local home prices are declining (-3.0%/yr); year-one equity from $3k of loan paydown is wiped out by about $14k of value loss. Plan a longer hold.
Negotiation context
- It's been on market 233 days — a 12% lower offer ($404k) is reasonable based on typical stale-listing flexibility.
- 2 sale attempts since 8y ago with the ask held roughly flat each time — persistent listings suggest the price (not the market) is what's stuck; bring a comps-based counter.
Questions for the listing agent
- It's been on market 233 days. Have you received any prior offers? Is the seller open to a 12% concession, seller financing, or rate buy-down credit?
- Can we see the unit-by-unit rent roll, current vacancy, and any below-market leases? What's the average tenancy length?
- What capital expenditures (roof, boiler, parking lot, exteriors) have been made in the last 5 years, and what's planned in the next 2?
- Built in 1978 — when were the roof, HVAC, electrical panel, plumbing, and water heater last replaced?
- Why hasn't it sold? Are there any deal-killer items the seller is aware of (foundation, flood, title, zoning, code violations)?
- Is there a deadline driving the sale (1031 exchange, divorce, estate, relocation)? That informs how much negotiation room exists.
- Schools are D-rated, which usually means shorter tenancies and higher turnover. Who's the typical renter profile here, and what's been the actual vacancy rate?
- Crime grade is F in this area — have there been break-ins, vandalism, or insurance claims at this property in the last 3 years? What carrier currently insures it and at what premium?
- What's the average days-on-market for RENTAL listings here right now (not sales)? A rising rental-DOM trend means longer vacancies and softer asking-rent achievability than the comps imply.
- What's the recent tenant-quality profile in this submarket — average credit score on applications, eviction rate, late-payment / NSF rate, and stable-employment percentage? A property-management company in the area should have these aggregated.
- How much new apartment / multifamily construction is in the pipeline within 1–3 miles? Heavy new supply (>2% of stock underway) typically softens rents 12–24 months out; light construction supports rent growth.
Investment metrics
- 1% rule
- 1.08% ✓
- Cap rate
- 9.26%
- Cash-on-cash
- 10.61%
- DSCR
- 1.47
- GRM
- 7.7
CMA / ARV
- ARV (median comp)
- $369,542
- List price
- $459,000
- Delta
- 24.21%
- Verdict
- OVERPRICED
- Comps
- 14 within 1.0 mi
Projected returns pro-forma
-3.0% appreciation · 2.54% rent growth · sell at horizon
- IRR
- -0.9%
- Equity multiple
- 0.97×
- Total profit
- $-4,445
- Equity at exit
- $68,438
- IRR
- 8.3%
- Equity multiple
- 1.62×
- Total profit
- $79,374
- Equity at exit
- $39,686
Cash invested: $128,520 (down + closing). Projections, not guarantees.
Landlord ↔ Tenant lean methodology
- Overall (STATE)
- 55 Moderately Landlord-Leaning
- State New Mexico
- 55 Moderately Landlord-Leaning · D+3
- County
- — inherits STATE
- City
- — inherits STATE
ZIP-level market 87108
- Rents YoY
- 2.5%
- Active inventory
- 164
- Price-to-rent
- 46.3×
Monthly cashflow live
- Estimated rent
- $4,961 high interval (Pro) →
- Mortgage (P&I)
- −$2,407
- Tax from tax record
- −$184 /mo · $2,213/yr
- Insurance
- −$191
- HOA
- −$0
- Vacancy / Maint / Mgmt
- −$1,042
- Net cashflow
- $1,136
Break-even live
6-unit breakdown (identical units grouped — click to expand)
| Units | Beds | Baths | Est. rent |
|---|---|---|---|
| 6× units | 1 | 1 | $4,962 |
| #1 | 1 | 1 | $827 |
| #2 | 1 | 1 | $827 |
| #3 | 1 | 1 | $827 |
| #4 | 1 | 1 | $827 |
| #5 | 1 | 1 | $827 |
| #6 | 1 | 1 | $827 |
| Total (6 units) | $4,961 | ||
UW: 25.0% down · 7.5% · 30yr · 1.5% tax · 5.0% vac · 8.0% maint · 8.0% mgmt
Financing live
Cash to close
- Down payment
- $114,750
- Closing costs
- $13,770
- Reserves months
- —
- Total cash needed
- —
Loan-product check · same deal, 3 products live
Conventional
25% down · 7.5% · 30yr
- Down + closing
- —
- Monthly P&I
- —
- Monthly cashflow
- —
- DSCR
- —
- Eligible?
- —
Personal DTI + credit; lowest rate.
DSCR
20% down · 8.5% · 30yr
- Down + closing
- —
- Monthly P&I
- —
- Monthly cashflow
- —
- DSCR
- —
- Eligible?
- —
No personal income docs; deal must DSCR.
Hard money
10% down · 12.0% · 12mo
- Down + closing
- —
- Monthly P&I
- —
- Monthly cashflow
- —
- DSCR
- —
- Eligible?
- —
Short-term bridge; refi at stabilization.
Listing history 21 events
-
2026-06-15days on market $459,000 Active 233 DOM
-
2026-06-13days on market $459,000 Active 231 DOM
-
2026-06-10days on market $459,000 Active 228 DOM
-
2026-06-09days on market $459,000 Active 227 DOM
-
2026-06-08days on market $459,000 Active 226 DOM
-
2026-06-07days on market $459,000 Active 225 DOM
-
2026-06-05days on market $459,000 Active 222 DOM
-
2026-06-03days on market $459,000 Active 221 DOM
-
2026-06-02days on market $459,000 Active 220 DOM
-
2026-06-01days on market $459,000 Active 219 DOM
-
2026-05-31days on market $459,000 Active 218 DOM
-
2025-10-25$459,000 Active 717-char remark
Show marketing remark (717 chars)
6 Unit income producing property. Townhouse style living. All one bedroom one bathroom two story units. New luxury vinyl flooring in units, new fridges in all units. Some units have new swamp coolers and new water heaters. All bedroom have brand new front doors, new security doors, and new windows. All units recently painted. Each unit can be rented between $750 - $800 per month. Open concept living room downstairs with full kitchen, gas stove and pantry. Bedroom is upstairs with walk in closet and full bath. Off street parking for residents. Close to VA hospital, Expo New Mexico and Tingley Coliseum. Highland high school and Highland pool just down the street. Art stop and public transportation are near by.
-
2025-06-04price $478,000
-
2025-05-21price $498,000
-
2025-05-18price $508,000
-
2025-04-14price $520,000
-
2022-12-04historical
-
2018-12-07historical
-
2018-12-06soldstatus
-
2018-10-17status Pending
-
2018-05-27$165,000 Active
ⓘ Source: listings_history table (triggers on properties + properties_extension) + one-shot
backfill from property_details.listing_events for pre-trigger history.
Tax reassessment forecast NM · Resets to sale price
- Current annual tax
- $2,213 · $184/mo
- Projected year-2 tax
- $3,672 · $306/mo
- Expected delta
- +$1,459/yr (+$122/mo · 65.9%)
ⓘ Screening estimate from a state-policy table — verify with the county assessor before closing.
Climate risk First Street
- Flood 1/10 Low FEMA zone X (unshaded) · 0% chance over 30 yrs
- Wildfire 1/10 Low
- Heat 4/10 Moderate 6 d/yr ≥94°F today · 15 d/yr by 30 yrs out
- Wind 1/10 Low
- Air quality 2/10 Low 1 unhealthy d/yr today · 3 by 30 yrs out
Nearby sold comps map
Loading sold comps map…
Walkable amenities ~0.75 mi
Loading nearby amenities…
Taxation est. · year 1
- Rental income
- $59,532
- − Mortgage interest
- −$25,711
- − Property taxes
- −$2,213
- − Insurance
- −$2,295
- − Repairs & maintenance
- −$4,763
- − Management
- −$4,763
- − Depreciation
- −$13,353
- Taxable income
- $6,435
- Est. tax owed @ 24.0%
- −$1,544
- After-tax cash flow
- $12,093/yr
For passive investors: Depreciation is non-cash, so a rental often shows a tax loss while cash-flowing — sheltering income. Rental losses are passive: they offset passive income freely, and up to $25,000/yr can offset ordinary (W-2) income if you actively participate and your MAGI is under $100k (phasing out to $0 by $150k); unused losses carry forward. On sale, claimed depreciation is recaptured at up to 25%, and gains may owe capital-gains tax (a 1031 exchange can defer both). Figures are a year-1 estimate at your 24.0% rate — not tax advice; consult a CPA.
Schools (NCES district)
- District
- Albuquerque Public Schools
- NCES district ID
- 3500060
- Math proficiency
- 51% ▲ 30.00%
- Reading proficiency
- 75% ▲ 45.00%
- Median HH income
- $48,151
- Composite
- 53.29/100
- National rank
- #1487
- State rank
- #3 of 29 in NM
Livability — Albuquerque
- Score
- 72/100
- State rank
- #13
- US rank
- #6219
Category grades
Schools grade is shown separately in the Schools card above.
Census & demographics
- Census place
- Albuquerque, NM
- County
- Bernalillo County · 647,165 people
- City population
- 647,165
- Metro
- Albuquerque, NM
- Population (ZIP)
- 36,331
- Household income
- $42,724
- Rent vs Own
- Severe rent burden
- 3480.0
Population outlook (Bernalillo County) Hauer SSP2
- Today (2025)
- 704,528 people
- By 2030
- 711,723 · +1.0%
- By 2040
- 714,522 · +1.4%
- By 2050
- 709,274 · +0.7%
- By 2075
- 680,015 · -3.5%
- By 2100
- 619,879 · -12.0%
Race, ethnicity, and origin ACS 2023
- Neighborhood character
- Diverse neighborhood (Simpson 0.64)
- Race & ethnicity
- Hispanic / Latino 49% White 34% Two or more races 21% Native American 6% Black 5% Asian 3%
- Hispanic origin (detail)
- Mexican 31% Cuban 3%
- Common ancestry
- Lithuanian 2% Slovak 1% Romanian 1%
- Foreign-born
- 18% · Canada, Vietnam
- Languages at home
- 67% English-only · Spanish 26% Other Indo-European 2% Tagalog/Filipino 1%
Political lean MEDSL · Bernalillo
- 2024 margin
- Strong D (+21.0) · D 59.2% · R 38.2% · Other 2.6%
- 2008→2024 swing
- -0.3pp no change · 2008: 21.4pp · 2024: 21.0pp
- All cycles
- 2024: D+21.0 2020: D+24.4 2016: D+17.8 2012: D+16.2 2008: D+21.4
Not yet ingested
- Civics
- —
Market trends
- HPI YoY
- ▼ -228.14%
- Current HPI
- 238.53
- Rent YoY
- ▲ 2.54%
- Metro
- Albuquerque, NM
- State GDP YoY
- —
- F500 in state
- 0
Price history
+178.2% since first listed10 events — show timeline
- 2025-10-25 Listed $459,000 ForSaleByOwner.com
- 2025-06-04 Price Changed $478,000 Southwest MLS
- 2025-05-21 Price Changed $498,000 Southwest MLS
- 2025-05-18 Price Changed $508,000 Southwest MLS
- 2025-04-14 Price Changed $520,000 Southwest MLS
- 2022-12-04 Rental Removed — RENT.
- 2018-12-07 Delisted — Southwest MLS
- 2018-12-06 Sold (Public Records) — Public Records
- 2018-10-17 Pending — Southwest MLS
- 2018-05-27 Listed $165,000 Southwest MLS
Property tax history
-13.5%/yrLatest (2025): $2,213 · +3.2% YoY. Source: county tax records.
Cash-flow waterfall
monthlySold comps — $/sqft
last 12 mo · ≤1 miLoading sold comps…