413 Elm St · Camden, NJ
Flood risk 1/10 · Minimal
- FEMA flood zone
- X (unshaded)
- Chance of flooding over 30 yrs
- 0.0%
- Est. flood insurance / yr
- $507 – $1,088
Fire risk 1/10 · Minimal
- Est. fire insurance / yr
- $526 – $976
Heat risk 7/10 · Major
- Hot days now (above 104°F)
- 7 days/yr
- Hot days in 30 yrs
- 15 days/yr
Wind risk 6/10 · Moderate
- Chance of severe wind over 30 yrs
- 27.0%
Air-quality risk 4/10 · Minor
- Unhealthy air days now
- 5 days/yr
- Unhealthy air days in 30 yrs
- 6 days/yr
Risk factors via First Street. Map © Google.
Why this score? — see what drove the D+ grade
The composite is a weighted blend of 9 inputs, each scored 0–100. Each bar is that input's sub-score; the figure is the points it added to the 100-point composite (weight × sub-score).
- Cash flow +22.9/30.0
- DSCR +7.3/10.0
- 1% rule +5.1/10.0
- Livability +3.5/5.0
- Rent growth +2.5/5.0
- Condition / age +2.5/5.0
- Appreciation +0.7/10.0
- Schools +0.7/10.0
- ARV discount +0.0/15.0
$259,900
🖨 Deal sheet 📄 Offer letter ✓ Due diligence
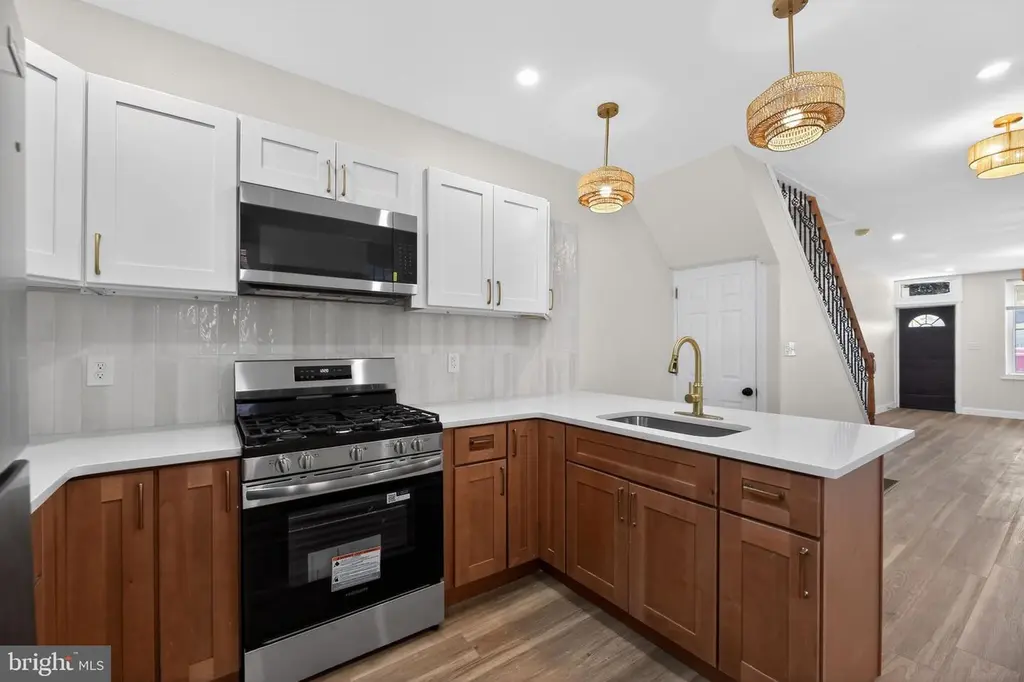
Listing remarks
MULTIPLE OFFERS RECEIVED. Seller is requesting all highest and best offers to be submitted by noon on Monday 5/18. WELCOME HOME to this beautifully updated 4 bedroom / 1.5 bathroom home in Camden, NJ! Immediately upon entering the home you will be impressed by the stylish updates and designs from the luxury vinyl plant flooring, to the floor to ceiling black tiled fireplace, the lovely hanging light fixtures, and the braided railings bordering the stairway to the upper level. The main level is complete with an open concept living room flowing into the tastefully designed kitchen, a half bathroom, and a nice sized bedroom. Head upstairs to find a 3 more nicely sized bedroom, a spacious full
Key facts
- Built 1905
- Listed 10 days
Property features AI
Finance
- Financial info: Assessed improvement value $43,300; Assessed land value $6,900; Tax assessed value $50,200 (tax year 2025); Annual tax amount approx. $1,850
Exterior
- Parking: On-street parking
- Utilities: Public water; Public sewer; Electric-powered cooling; Natural gas for heating and hot water
- Home design: Interior townhouse/rowhouse; Flat roof; Fee simple ownership; Effective/major remodel year 2026
- Construction: Block construction; Slab foundation; Above- and below-grade structures
- Exterior features: Lot dimensions approximately 17.00 x 0.00; No tidal water
Interior
- Bedrooms: Three bedrooms on the upper level; One bedroom on the main level
- Bathrooms: One full bathroom on the upper level; One half bathroom on the main level; Total: one full bathroom and one half bathroom
- Heating & cooling: Forced air heating (natural gas); Central air conditioning (electric); Natural gas hot water
- Interior features: Two or more access/exit points; Unfinished basement
Neighborhood map
What this means for you Summary
Snapshot
- This is a 4-bed/1.5-bath townhouse listed at $260k.
Deal economics
- At list price, monthly cash flow is $456 ($5k/yr) — positive.
- The deal already cash-flows at list — no discount required.
- Meets the 1% rule at list price ($3k rent vs $260k).
Location & tenants
- Location reads 70/100 on livability (#262 in NJ) — a middle-class / working-renter tenant base. Strengths: amenities A+, commute A+, cost of living A; Watch: schools F, crime F, employment F.
- Camden City School District (urban): math 3% / reading 16% proficiency, ranked #472 of 472 in NJ (top 100%) — low school quality limits family demand, transient renter base, plan for 1-2y turnover; 86% free/reduced lunch — lower-income household profile, screen leases tightly.
- Market conditions: 24 active listings in the ZIP; 13 comparable units currently listed for rent nearby; rentals leasing fast (median 6d on market — plan ~1-2 weeks tenant-placement turnaround); lower-income renter base — watch delinquency; 1,018 units permitted in Camden County in 2024 (509 in 5+ unit buildings).
- At $2,635/mo this rent would consume 93% of the median local household income ($34k/yr) (locally 562% of renters already pay >50% of income on rent) — very limited rent-growth headroom before tenants either downsize or default.
Forward outlook
- Local home prices are declining (-3.0%/yr); year-one equity from $2k of loan paydown is wiped out by about $8k of value loss. Plan a longer hold.
- Camden County population projected to shrink 8% by 2050 — rents likely to lag national; underwrite the cash flow, not the appreciation.
Negotiation context
- Only 10 days on market — expect competitive offers; lowballing is unlikely to land.
Risks & watch-outs
- Watch-outs: built in 1905 — expect roof / HVAC / electrical / plumbing capex.
- Climate carrying-cost: major wind risk, 27% chance of damaging wind over 30y; extreme-heat days projected 7→15/yr by 2055 (HVAC capex compounding) — expect insurance premiums to compound above CPI over the hold.
Questions for the listing agent
- Built in 1905 — when were the roof, HVAC, electrical panel, plumbing, and water heater last replaced?
- Is there a deadline driving the sale (1031 exchange, divorce, estate, relocation)? That informs how much negotiation room exists.
- Schools are F-rated, which usually means shorter tenancies and higher turnover. Who's the typical renter profile here, and what's been the actual vacancy rate?
- Crime grade is F in this area — have there been break-ins, vandalism, or insurance claims at this property in the last 3 years? What carrier currently insures it and at what premium?
- The area grade is low — what's the realistic commute time and amenity access for the typical tenant pool here? Any planned neighborhood developments (good or bad) we should know about?
- What's the average days-on-market for RENTAL listings here right now (not sales)? A rising rental-DOM trend means longer vacancies and softer asking-rent achievability than the comps imply.
- What's the recent tenant-quality profile in this submarket — average credit score on applications, eviction rate, late-payment / NSF rate, and stable-employment percentage? A property-management company in the area should have these aggregated.
- How much new for-sale + rental construction is in the pipeline within 1–3 miles? Heavy new supply typically softens prices + rents 12–24 months out; constrained supply supports both.
Investment metrics
- 1% rule
- 1.01% ✓
- Cap rate
- 8.40%
- Cash-on-cash
- 7.52%
- DSCR
- 1.33
- GRM
- 8.2
CMA / ARV
- ARV (on-the-fly)
- $222,264
- Comps found
- 12
Show comp detail 12 sales within ~0.75 mi
| Address | Dist | Beds/Ba | Sqft | Sold | Price | $/sf | Match |
|---|---|---|---|---|---|---|---|
| 318 State St | 0.13mi | 3/1.5 (-1) | 1,490 (-2%) | 4mo | $220,000 | $148 | 83 |
| 542 York St | 0.20mi | 5/2.0 (+1) | 1,572 (+4%) | 4mo | $45,000 | $29 | 74 |
| 563 Bailey St | 0.26mi | 4/2.0 | 1,424 (-6%) | 4mo | $69,000 | $48 | 73 |
| 211 Elm St | 0.16mi | 3/1.0 (-1) | 1,456 (-4%) | 12mo | $225,000 | $155 | 70 |
| 906 N 4th St | 0.21mi | 3/2.0 (-1) | 1,367 (-10%) | 2mo | $215,000 | $157 | 65 |
| 821 N 2nd St | 0.26mi | 4/2.0 | 1,317 (-13%) | 1mo | $265,000 | $201 | 63 |
| 934 N 4th St | 0.26mi | 3/1.0 (-1) | 1,341 (-11%) | 1mo | $180,000 | $134 | 62 |
| 826 State St | 0.36mi | 3/1.0 (-1) | 1,377 (-9%) | 2mo | $110,000 | $80 | 60 |
| 646 York St | 0.26mi | 4/2.0 | 1,301 (-14%) | 11mo | $180,000 | $138 | 54 |
| 1153 Cooper St | 0.70mi | 4/2.0 | 1,410 (-7%) | 2mo | $280,000 | $199 | 53 |
| 608 Point St | 0.30mi | 3/1.0 (-1) | 1,358 (-10%) | 12mo | $155,000 | $114 | 52 |
| 836 State St | 0.37mi | 3/1.5 (-1) | 1,289 (-15%) | 11mo | $190,000 | $147 | 44 |
Match score weights: distance 35% · size 25% · config 20% · recency 20%. Top-matched comps best support the ARV.
Projected returns pro-forma
-3.0% appreciation · 3.0% rent growth · sell at horizon
- IRR
- -4.8%
- Equity multiple
- 0.82×
- Total profit
- $-13,123
- Equity at exit
- $38,752
- IRR
- 4.8%
- Equity multiple
- 1.35×
- Total profit
- $25,725
- Equity at exit
- $22,471
Cash invested: $72,772 (down + closing). Projections, not guarantees.
Landlord ↔ Tenant lean methodology
- Overall (STATE)
- 21 Tenant-Leaning
- State New Jersey
- 21 Tenant-Leaning · D+6
- County
- — inherits STATE
- City
- — inherits STATE
ZIP-level market 08102
- Home prices YoY
- -4.3%
- Active inventory
- 24
- Price-to-rent
- 8.2×
Monthly cashflow live
- Estimated rent
- $2,635 high interval (Pro) →
- Mortgage (P&I)
- −$1,363
- Tax from tax record
- −$154 /mo · $1,851/yr
- Insurance
- −$108
- HOA
- −$0
- Vacancy / Maint / Mgmt
- −$553
- Net cashflow
- $456
Break-even live
UW: 25.0% down · 7.5% · 30yr · 1.5% tax · 5.0% vac · 8.0% maint · 8.0% mgmt
Financing live
Cash to close
- Down payment
- $64,975
- Closing costs
- $7,797
- Reserves months
- —
- Total cash needed
- —
Loan-product check · same deal, 3 products live
Conventional
25% down · 7.5% · 30yr
- Down + closing
- —
- Monthly P&I
- —
- Monthly cashflow
- —
- DSCR
- —
- Eligible?
- —
Personal DTI + credit; lowest rate.
DSCR
20% down · 8.5% · 30yr
- Down + closing
- —
- Monthly P&I
- —
- Monthly cashflow
- —
- DSCR
- —
- Eligible?
- —
No personal income docs; deal must DSCR.
Hard money
10% down · 12.0% · 12mo
- Down + closing
- —
- Monthly P&I
- —
- Monthly cashflow
- —
- DSCR
- —
- Eligible?
- —
Short-term bridge; refi at stabilization.
Rent comps 13 comps
| Address | Beds | Baths | Sqft | Rent | $/sqft | DOM | Units | Dist |
|---|---|---|---|---|---|---|---|---|
| 1 Market St Camden, NJ | 3.0 | 1.0–2.0 | 1190 | $2,456 | $2.06 | 2d | 15 | 0.41mi |
| 440 Henry St Camden, NJ | 3.0 | 1.5 | 1224 | $2,200 | $1.80 | 24d | 1 | 0.77mi |
| 609 Henry St Camden, NJ | 3.0 | 1.0 | 1290 | $1,600 | $1.24 | 24d | 1 | 0.93mi |
| 708 Royden St Camden, NJ | 3.0 | 1.0 | 1113 | $1,595 | $1.43 | 17d | 1 | 0.95mi |
| 501 N Christopher Columbus Blvd Philadelphia, PA | 1.0–3.0 | 1.0–3.0 | 1062 | $5,148 | $4.85 | 1d | 100 | 1.00mi |
| 503 N Christopher Columbus Blvd Unit 1503 Philadelphia, PA | 3.0 | 2.5 | 1450 | $3,825 | $2.64 | 5d | 1 | 1.08mi |
| 700 N Delaware Ave Philadelphia, PA | 3.0 | 2.0 | 1067 | $5,110 | $4.79 | 1d | 166 | 1.20mi |
| 209 Vine St Philadelphia, PA | 1.0–3.0 | 1.0–2.0 | 991 | $4,325 | $4.36 | 2d | 4 | 1.27mi |
| 1 Dock St Philadelphia, PA | 3.0 | 1.0–3.5 | 1164 | $10,341 | $8.88 | 1d | 18 | 1.30mi |
| 2008 Northbank Pl Philadelphia, PA | 3.0 | 3.5 | 2100 | $3,600 | $1.71 | 1d | 1 | 1.34mi |
| 1055 Kenwood Ave Camden, NJ | 4.0 | 1.0 | 1088 | $1,875 | $1.72 | 24d | 1 | 1.35mi |
| 457 Mechanic St Camden, NJ | 3.0 | 2.0 | 1200 | $1,950 | $1.62 | 19d | 1 | 1.48mi |
| 1455 Wildwood Ave Camden, NJ | 3.0 | 1.5 | 1353 | $1,900 | $1.40 | 10d | 1 | 1.49mi |
Listing history 4 events
-
2026-05-21status Pending
-
2026-05-18historical Active Under Contract
-
2026-05-09$259,900 Active
-
2026-05-06historical $259,900
ⓘ Source: listings_history table (triggers on properties + properties_extension) + one-shot
backfill from property_details.listing_events for pre-trigger history.
Tax reassessment forecast NJ · Partial reset (capped growth)
- Current annual tax
- $1,851 · $154/mo
- Projected year-2 tax
- $4,161 · $347/mo
- Expected delta
- +$2,310/yr (+$193/mo · 124.8%)
ⓘ Screening estimate from a state-policy table — verify with the county assessor before closing.
Climate risk First Street
- Flood 1/10 Low FEMA zone X (unshaded) · 0% chance over 30 yrs
- Wildfire 1/10 Low
- Heat 7/10 Severe 7 d/yr ≥104°F today · 15 d/yr by 30 yrs out
- Wind 6/10 Major 27% chance of damaging wind over 30 yrs
- Air quality 4/10 Moderate 5 unhealthy d/yr today · 6 by 30 yrs out
Nearby sold comps map
Loading sold comps map…
Walkable amenities ~0.75 mi
Loading nearby amenities…
Taxation est. · year 1
- Rental income
- $31,621
- − Mortgage interest
- −$14,558
- − Property taxes
- −$1,851
- − Insurance
- −$1,300
- − Repairs & maintenance
- −$2,530
- − Management
- −$2,530
- − Depreciation
- −$7,561
- Taxable income
- $1,292
- Est. tax owed @ 24.0%
- −$310
- After-tax cash flow
- $5,165/yr
For passive investors: Depreciation is non-cash, so a rental often shows a tax loss while cash-flowing — sheltering income. Rental losses are passive: they offset passive income freely, and up to $25,000/yr can offset ordinary (W-2) income if you actively participate and your MAGI is under $100k (phasing out to $0 by $150k); unused losses carry forward. On sale, claimed depreciation is recaptured at up to 25%, and gains may owe capital-gains tax (a 1031 exchange can defer both). Figures are a year-1 estimate at your 24.0% rate — not tax advice; consult a CPA.
Schools (NCES district)
- District
- Camden City School District
- NCES district ID
- 3402640
- Math proficiency
- 3% ▼ -6.00%
- Reading proficiency
- 16% ▬ 0.00%
- Median HH income
- $25,845
- Composite
- 6.85/100
- National rank
- #9981
- State rank
- #472 of 472 in NJ
Livability — Camden
- Score
- 70/100
- State rank
- #262
- US rank
- #7721
Category grades
Schools grade is shown separately in the Schools card above.
Census & demographics
- Census place
- Camden, NJ
- County
- Camden County · 407,624 people
- City population
- 20,865
- Metro
- Philadelphia-Camden-Wilmington, PA-NJ-DE-MD
- Population (ZIP)
- 8,292
- Household income
- $33,852
- Rent vs Own
- Severe rent burden
- 562.0
Population outlook (Camden County) Hauer SSP2
- Today (2025)
- 507,964 people
- By 2030
- 502,182 · -1.1%
- By 2040
- 485,602 · -4.4%
- By 2050
- 465,630 · -8.3%
- By 2075
- 419,986 · -17.3%
- By 2100
- 369,492 · -27.3%
Race, ethnicity, and origin ACS 2023
- Neighborhood character
- Majority Hispanic (64%)
- Race & ethnicity
- Hispanic / Latino 64% Black 20% Two or more races 14% White 13% Asian 1%
- Hispanic origin (detail)
- Mexican 3% Puerto Rican 40% Dominican 14%
- Common ancestry
- Romanian 2% Hispanic 1% Serbian 1%
- Foreign-born
- 13% · Canada
- Languages at home
- 48% English-only · Spanish 50%
Political lean MEDSL · Camden
- 2024 margin
- Strong D (+27.4) · D 63.0% · R 35.5% · Other 1.5%
- 2008→2024 swing
- -8.8pp toward R · 2008: 36.2pp · 2024: 27.4pp
- All cycles
- 2024: D+27.4 2020: D+33.5 2016: D+32.4 2012: D+36.6 2008: D+36.2
Not yet ingested
- Civics
- —
Market trends
- HPI YoY
- ▼ -8.61%
- Current HPI
- 192.0092
- Rent YoY
- —
- Metro
- Philadelphia-Camden-Wilmington, PA-NJ-DE-MD
- State GDP YoY
- ▲ 2.05%
- F500 in state
- 34
Industry mix (Fortune 500 HQ in NJ)
| Industry | F500 HQs | Revenue |
|---|---|---|
| Consumer Goods | 3 | $31B |
|
||
| Pharmaceuticals | 2 | $153B |
|
||
| Technology | 2 | $21B |
|
||
| Insurance | 2 | $20B |
|
||
| Healthcare | 2 | $19B |
|
||
| Financial Services | 1 | $70B |
|
||
Price history
+0.0% since first listed4 events — show timeline
- 2026-05-21 Pending — BRIGHT MLS
- 2026-05-18 Contingent — BRIGHT MLS
- 2026-05-09 Listed $259,900 BRIGHT MLS
- 2026-05-06 Coming Soon $259,900 BRIGHT MLS
Property tax history
+14.9%/yrLatest (2025): $1,851 · +4.1% YoY. Source: county tax records.
Cash-flow waterfall
monthlySold comps — $/sqft
last 12 mo · ≤1 miLoading sold comps…