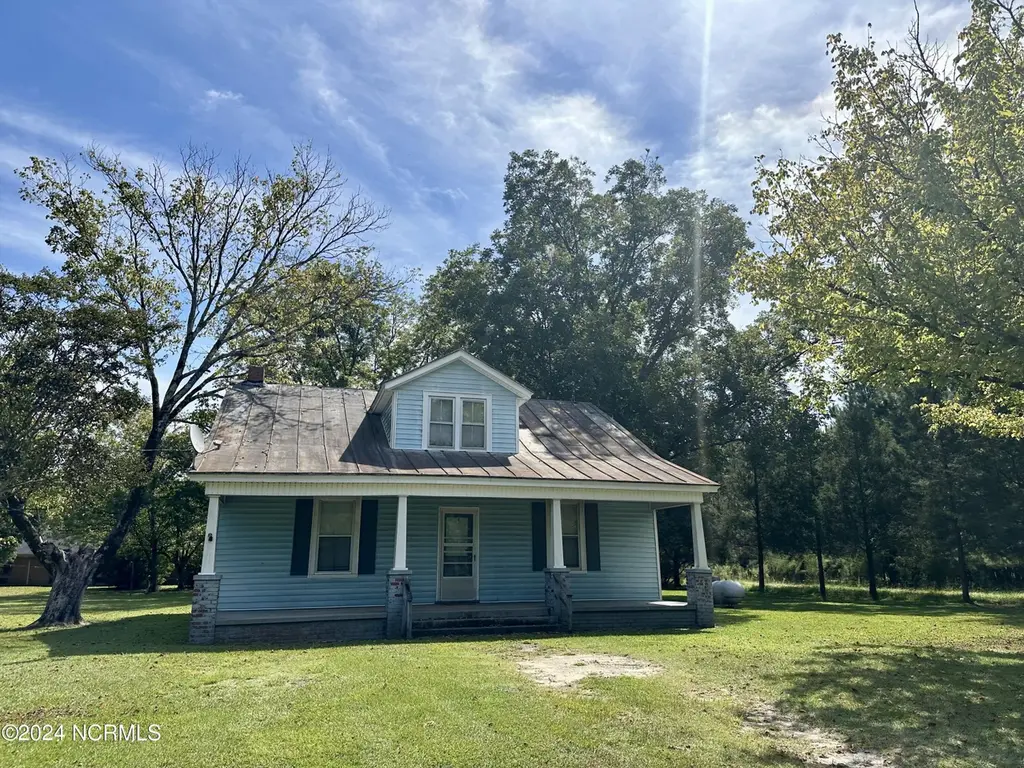
114 Rhodes Ave · Windsor, NC
Flood risk 1/10 · Minimal
- FEMA flood zone
- X (shaded)
- Chance of flooding over 30 yrs
- 0.0%
- Est. flood insurance / yr
- $507 – $1,088
Fire risk 3/10 · Minor
- Est. fire insurance / yr
- $906 – $1,684
Heat risk 8/10 · Major
- Hot days now (above 109°F)
- 7 days/yr
- Hot days in 30 yrs
- 17 days/yr
Wind risk 8/10 · Major
- Chance of severe wind over 30 yrs
- 80.0%
Air-quality risk 1/10 · Minimal
- Unhealthy air days now
- 0 days/yr
- Unhealthy air days in 30 yrs
- 0 days/yr
Risk factors via First Street. Map © Google.
Why this score? — see what drove the C grade
The composite is a weighted blend of 9 inputs, each scored 0–100. Each bar is that input's sub-score; the figure is the points it added to the 100-point composite (weight × sub-score).
- Cash flow +18.8/30.0
- Appreciation +9.0/10.0
- ARV discount +7.5/15.0
- DSCR +5.9/10.0
- 1% rule +3.9/10.0
- Livability +3.4/5.0
- Rent growth +2.5/5.0
- Condition / age +2.5/5.0
- Schools +1.9/10.0
$135,000
🖨 Deal sheet 📄 Offer letter ✓ Due diligence
Listing remarks
This vintage beauty is ready for renovation! You will love the big front porch, spacious rooms, tall ceilings in the living area, & 1st floor bedrooms. There is central HVAC on the primary level plus upstairs the original bead board is exposed in several spots. Town sewer & water. Excellent potential to convert to commercial property w Town approval. R-10 SINGLE & 2 FAMILY RES DIST
Key facts
- Central hvac
- Big front porch
- Tall ceilings
Tags
Property features AI
Finance
- Other: Zoning: R-10 Single & 2 Family Residential
- Financial info: No investor or income/expense details provided
- HOA & community: No HOA information provided
Exterior
- Parking: Off-street parking
- Security: No security features provided
- Utilities: Public water; Sewer connected; Water connected
- Home design: Single family residence; One and one-half levels; Entry level: 1; Residential property
- Construction: Vinyl siding and frame construction; Metal roof
- Exterior features: Covered porch; Porch; Storage structure on property; Paved road access; City street and state road frontage; Property has a view; Lot features: See remarks
Interior
- Kitchen: No kitchen appliance details provided
- Bedrooms: Total of 7 rooms (bedrooms included in room count)
- Flooring: Carpet; Wood
- Bathrooms: One full bathroom
- Heating & cooling: Heating: Propane and other heating; Cooling: Other
- Interior features: Carpet and wood flooring; Crawl space basement
- Laundry & utility: No laundry or utility room details provided
Neighborhood map
What this means for you Summary
Snapshot
- This is a 5-bed/1.0-bath single-family listed at $135k.
Deal economics
- At list price, monthly cash flow is $136 ($2k/yr) — positive.
- The deal already cash-flows at list — no discount required.
- To meet the 1% rule (rent ≥ 1% of price), the offer needs to be $120k (10.9% below list).
- Recommended offer: $120k (10.9% below list) — sets the bar for 1% rule.
Location & tenants
- Location reads 68/100 on livability (#187 in NC) — a middle-class / working-renter tenant base. Strengths: cost of living A+, health & safety A+, housing A; Watch: crime C-, amenities F, commute F.
- Bertie County Schools (rural): math 17% / reading 31% proficiency, ranked #165 of 178 in NC (top 93%) — low school quality limits family demand, transient renter base, plan for 1-2y turnover; 80% free/reduced lunch — lower-income household profile, screen leases tightly.
- Zoned schools: Windsor Elementary (math 12% / reading 27%, grade F, #1,242 of 1,410 statewide, top 90%, 328 students, 99% FRL); Bertie Middle (math 13% / reading 31%, grade F, #416 of 475 statewide, top 89%, 425 students, 99% FRL); Bertie High (math 27% / reading 22%, grade F, #474 of 535 statewide, top 90%, 442 students, 99% FRL) — zoned schools average 99% FRL vs 80% district-wide (19 pts higher); higher-poverty schools than district average — tighter screening recommended.
- Market conditions: 25 active listings in the ZIP; 46 units permitted in Bertie County in 2024 (0 in 5+ unit buildings).
Forward outlook
- In year one you build about $12k of equity ($933 loan paydown + $11k appreciation (8.0% local appreciation)).
- Bertie County population projected at -30% by 2050 — secular population decline; favor cash flow + early exit over multi-decade hold.
- At projected returns (8.0% appreciation + 3.0% rent growth), your $38k cash investment doubles in ~3 years — after that, you're playing with house money.
- By year 4, paydown + projected appreciation supports a ~$41k cash-out refi (75% LTV) — recoverable capital for the next deal without selling this one.
Negotiation context
- It's been on market 65 days — a 6% lower offer ($127k) is reasonable based on typical stale-listing flexibility.
- 3 sale attempts since 2y ago with the ask held roughly flat each time — persistent listings suggest the price (not the market) is what's stuck; bring a comps-based counter.
Risks & watch-outs
- Watch-outs: built in 1932 — expect roof / HVAC / electrical / plumbing capex.
- Climate carrying-cost: severe wind risk, 80% chance of damaging wind over 30y; extreme-heat days projected 7→17/yr by 2055 (HVAC capex compounding) — expect insurance premiums to compound above CPI over the hold.
Questions for the listing agent
- It's been on market 65 days. Have you received any prior offers? Is the seller open to a 11% concession, seller financing, or rate buy-down credit?
- Built in 1932 — when were the roof, HVAC, electrical panel, plumbing, and water heater last replaced?
- Why hasn't it sold? Are there any deal-killer items the seller is aware of (foundation, flood, title, zoning, code violations)?
- Is there a deadline driving the sale (1031 exchange, divorce, estate, relocation)? That informs how much negotiation room exists.
- Schools are F-rated, which usually means shorter tenancies and higher turnover. Who's the typical renter profile here, and what's been the actual vacancy rate?
- What's the average days-on-market for RENTAL listings here right now (not sales)? A rising rental-DOM trend means longer vacancies and softer asking-rent achievability than the comps imply.
- What's the recent tenant-quality profile in this submarket — average credit score on applications, eviction rate, late-payment / NSF rate, and stable-employment percentage? A property-management company in the area should have these aggregated.
- How much new for-sale + rental construction is in the pipeline within 1–3 miles? Heavy new supply typically softens prices + rents 12–24 months out; constrained supply supports both.
Investment metrics
- 1% rule
- 0.89% ✗
- Cap rate
- 7.50%
- Cash-on-cash
- 4.31%
- DSCR
- 1.19
- GRM
- 9.3
CMA / ARV
No comps found within radius.
Projected returns pro-forma
8.03% appreciation · 3.0% rent growth · sell at horizon
- IRR
- 23.3%
- Equity multiple
- 2.71×
- Total profit
- $64,452
- Equity at exit
- $102,835
- IRR
- 21.2%
- Equity multiple
- 5.77×
- Total profit
- $180,479
- Equity at exit
- $204,386
Cash invested: $37,800 (down + closing). Projections, not guarantees.
Landlord ↔ Tenant lean methodology
- Overall (STATE)
- 85 Strongly Landlord-Friendly
- State North Carolina
- 85 Strongly Landlord-Friendly · R+3
- County
- — inherits STATE
- City
- — inherits STATE
ZIP-level market 27983
- Home prices YoY
- 4.6%
- Active inventory
- 25
- Price-to-rent
- 9.3×
Monthly cashflow live
- Estimated rent
- $1,203 medium interval (Pro) →
- Mortgage (P&I)
- −$708
- Tax from tax record
- −$51 /mo · $611/yr
- Insurance
- −$56
- HOA
- −$0
- Vacancy / Maint / Mgmt
- −$253
- Net cashflow
- $136
Break-even live
UW: 25.0% down · 7.5% · 30yr · 1.5% tax · 5.0% vac · 8.0% maint · 8.0% mgmt
Financing live
Cash to close
- Down payment
- $33,750
- Closing costs
- $4,050
- Reserves months
- —
- Total cash needed
- —
Loan-product check · same deal, 3 products live
Conventional
25% down · 7.5% · 30yr
- Down + closing
- —
- Monthly P&I
- —
- Monthly cashflow
- —
- DSCR
- —
- Eligible?
- —
Personal DTI + credit; lowest rate.
DSCR
20% down · 8.5% · 30yr
- Down + closing
- —
- Monthly P&I
- —
- Monthly cashflow
- —
- DSCR
- —
- Eligible?
- —
No personal income docs; deal must DSCR.
Hard money
10% down · 12.0% · 12mo
- Down + closing
- —
- Monthly P&I
- —
- Monthly cashflow
- —
- DSCR
- —
- Eligible?
- —
Short-term bridge; refi at stabilization.
Listing history 19 events
-
2026-06-18days on market $135,000 Active 65 DOM
-
2026-06-17days on market $135,000 Active 64 DOM
-
2026-06-16days on market $135,000 Active 63 DOM
-
2026-06-15days on market $135,000 Active 62 DOM
-
2026-06-13days on market $135,000 Active 60 DOM
-
2026-06-12days on market $135,000 Active 59 DOM
-
2026-06-09days on market $135,000 Active 56 DOM
-
2026-06-08days on market $135,000 Active 55 DOM
-
2026-06-07days on market $135,000 Active 54 DOM
-
2026-06-07days on market $135,000 Active 53 DOM
-
2026-06-04days on market $135,000 Active 50 DOM
-
2026-06-02days on market $135,000 Active 49 DOM
-
2026-06-01days on market $135,000 Active 48 DOM
-
2026-05-31days on market $135,000 Active 47 DOM
-
2026-04-12$135,000 Active
-
2025-11-23historical
-
2025-05-22$160,000 Active
-
2025-03-12historical
-
2024-09-10$175,000 Active
ⓘ Source: listings_history table (triggers on properties + properties_extension) + one-shot
backfill from property_details.listing_events for pre-trigger history.
Tax reassessment forecast NC · Resets to sale price
- Current annual tax
- $611 · $51/mo
- Projected year-2 tax
- $1,107 · $92/mo
- Expected delta
- +$496/yr (+$41/mo · 81.2%)
ⓘ Screening estimate from a state-policy table — verify with the county assessor before closing.
Climate risk First Street
- Flood 1/10 Low FEMA zone X (shaded) · 0% chance over 30 yrs
- Wildfire 3/10 Moderate
- Heat 8/10 Severe 7 d/yr ≥109°F today · 17 d/yr by 30 yrs out
- Wind 8/10 Severe 80% chance of damaging wind over 30 yrs
- Air quality 1/10 Low 0 unhealthy d/yr today · 0 by 30 yrs out
Nearby sold comps map
Loading sold comps map…
Walkable amenities ~0.75 mi
Loading nearby amenities…
Taxation est. · year 1
- Rental income
- $14,442
- − Mortgage interest
- −$7,562
- − Property taxes
- −$611
- − Insurance
- −$675
- − Repairs & maintenance
- −$1,155
- − Management
- −$1,155
- − Depreciation
- −$3,927
- Taxable loss
- −$644
- Est. tax savings @ 24.0%
- +$155
- After-tax cash flow
- $1,782/yr
For passive investors: Depreciation is non-cash, so a rental often shows a tax loss while cash-flowing — sheltering income. Rental losses are passive: they offset passive income freely, and up to $25,000/yr can offset ordinary (W-2) income if you actively participate and your MAGI is under $100k (phasing out to $0 by $150k); unused losses carry forward. On sale, claimed depreciation is recaptured at up to 25%, and gains may owe capital-gains tax (a 1031 exchange can defer both). Figures are a year-1 estimate at your 24.0% rate — not tax advice; consult a CPA.
Schools (NCES district)
- District
- Bertie County Schools
- NCES district ID
- 3700360
- Math proficiency
- 17% ▼ -7.00%
- Reading proficiency
- 31% ▼ -2.00%
- Median HH income
- $30,361
- Composite
- 19.3/100
- National rank
- #8797
- State rank
- #165 of 178 in NC
Livability — Windsor
- Score
- 68/100
- State rank
- #187
- US rank
- #9390
Category grades
Schools grade is shown separately in the Schools card above.
Census & demographics
- Census place
- Windsor, NC
- Population (ZIP)
- 8,642
Population outlook (Bertie County) Hauer SSP2
- Today (2025)
- 18,388 people
- By 2030
- 17,285 · -6.0%
- By 2040
- 14,982 · -18.5%
- By 2050
- 12,963 · -29.5%
- By 2075
- 10,051 · -45.3%
- By 2100
- 8,320 · -54.8%
Race, ethnicity, and origin ACS 2023
- Neighborhood character
- Majority Black (61%)
- Race & ethnicity
- Black 61% White 31% Two or more races 4% Hispanic / Latino 4% Asian 1%
- Common ancestry
- Serbian 2% Slovak 1% Iranian 1%
- Foreign-born
- 3% · Canada, China
- Languages at home
- 94% English-only · Spanish 4% Korean 1% Chinese 1%
Political lean MEDSL · Bertie
- 2024 margin
- D (+15.7) · D 57.6% · R 41.9%
- 2008→2024 swing
- -14.9pp toward R · 2008: 30.6pp · 2024: 15.7pp
- All cycles
- 2024: D+15.7 2020: D+21.6 2016: D+25.2 2012: D+31.9 2008: D+30.6
Not yet ingested
- Civics
- —
Market trends
- HPI YoY
- ▲ 8.03%
- Current HPI
- 183.57
- Rent YoY
- —
- Metro
- —
- State GDP YoY
- ▲ 3.28%
- F500 in state
- 26
Industry mix (Fortune 500 HQ in NC)
| Industry | F500 HQs | Revenue |
|---|---|---|
| Financial Services | 2 | $213B |
|
||
| Retail | 2 | $95B |
|
||
| Industrial Conglomerate | 1 | $38B |
|
||
| Metals / Steel | 1 | $35B |
|
||
| Utilities | 1 | $30B |
|
||
| Industrial Machinery | 1 | $19B |
|
||
Price history
-22.9% since first listed5 events — show timeline
- 2026-04-12 Listed $135,000 Hive MLS
- 2025-11-23 Listing Removed — Hive MLS
- 2025-05-22 Listed $160,000 Hive MLS
- 2025-03-12 Listing Removed — Hive MLS
- 2024-09-10 Listed $175,000 Hive MLS
Property tax history
+11.2%/yrLatest (2025): $611 · +3.5% YoY. Source: county tax records.
Cash-flow waterfall
monthlySold comps — $/sqft
last 12 mo · ≤1 miLoading sold comps…