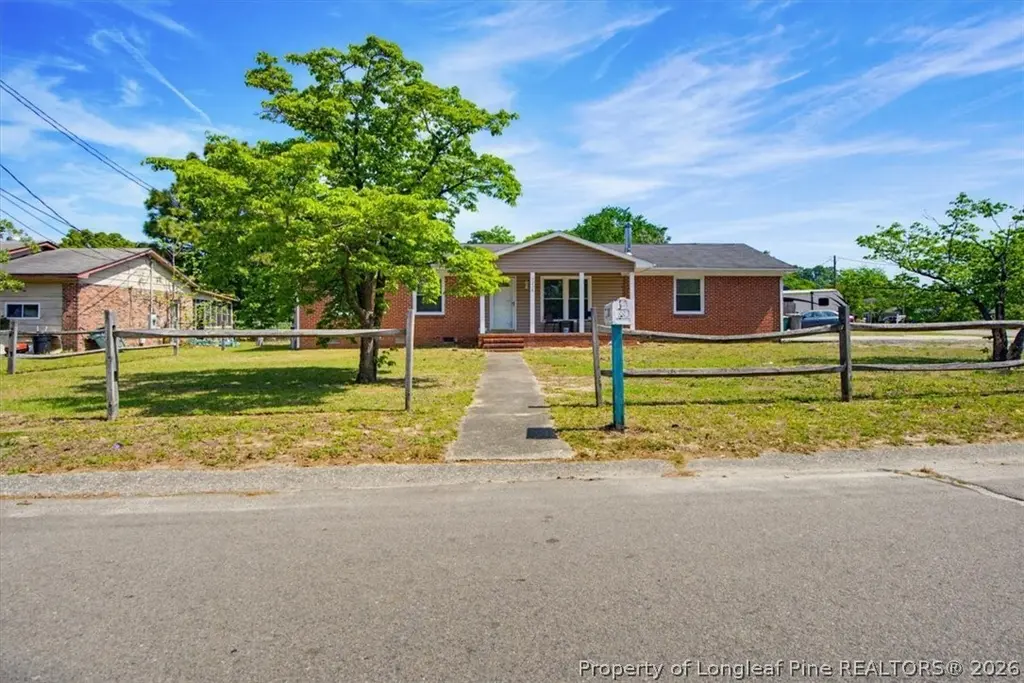
3238 Glenmore Dr · Hope Mills, NC
Flood risk 1/10 · Minimal
- FEMA flood zone
- X (unshaded)
- Chance of flooding over 30 yrs
- 0.0%
- Est. flood insurance / yr
- $507 – $1,088
Fire risk 5/10 · Moderate
- Est. fire insurance / yr
- $906 – $1,684
Heat risk 7/10 · Major
- Hot days now (above 106°F)
- 7 days/yr
- Hot days in 30 yrs
- 16 days/yr
Wind risk 7/10 · Major
- Chance of severe wind over 30 yrs
- 78.0%
Air-quality risk 1/10 · Minimal
- Unhealthy air days now
- 0 days/yr
- Unhealthy air days in 30 yrs
- 0 days/yr
Risk factors via First Street. Map © Google.
Why this score? — see what drove the D+ grade
The composite is a weighted blend of 9 inputs, each scored 0–100. Each bar is that input's sub-score; the figure is the points it added to the 100-point composite (weight × sub-score).
- ARV discount +15.0/15.0
- Cash flow +11.8/30.0
- Rent growth +3.6/5.0
- DSCR +3.5/10.0
- Livability +3.4/5.0
- 1% rule +3.2/10.0
- Schools +3.1/10.0
- Condition / age +2.5/5.0
- Appreciation +0.0/10.0
$204,900
🖨 Deal sheet (PDF) 📄 Offer letter ✓ Due diligence
Listing remarks
Charming Ranch starter home in the heart of Hope Mills. This home is ready for you to make it your own! Cute 3 bedroom 2 full baths. Eat in kitchen. Plenty of storage. Back yard patio & rear fencing. Close to schools , shopping and local dining. Easy access w - 20 minute commute to Ft Bragg. Schedule a showing today.
Key facts
- 0.26 acre lot
- Built 1974
- Listed 38 days
Property features AI
Exterior
- Parking: No garage
- Utilities: Public water; Public sewer
- Home design: Single-family residence; Residential zoning (R10 - Residential District)
- Construction: Brick veneer exterior
- Exterior features: Partial backyard fencing; Corner lot; Level lot; Shed on the property; Paved road access
Interior
- Kitchen: Range; Microwave; Refrigerator; Eat-in kitchen layout
- Bedrooms: 7 total rooms (includes bedrooms and living spaces)
- Flooring: Carpet; Tile; Vinyl
- Bathrooms: 2 full bathrooms; 1 half bathroom
- Heating & cooling: Central air; Electric cooling; Ceiling fans
- Interior features: Ceiling fans; Eat-in kitchen; Storage; Wood burning stove
- Laundry & utility: Washer; Dryer
Neighborhood map
What this means for you Summary
Snapshot
- This is a 3-bed/3.0-bath single-family listed at $205k.
Deal economics
- At list price, monthly cash flow is $-55 ($-662/yr) — negative.
- To cash-flow at today's rent, offer at most $195k (4.8% below list).
- To meet the 1% rule (rent ≥ 1% of price), the offer needs to be $169k (17.6% below list).
- Recommended offer: $169k (17.6% below list) — sets the bar for 1% rule.
- Cap rate 6.0% vs local median 4.8% in Hope Mills — meaningfully above typical; check what's discounted (condition, days-on-market, listing class) to confirm the premium yield is real.
Location & tenants
- Location reads 67/100 on livability (#234 in NC) — a middle-class / working-renter tenant base. Strengths: cost of living A+, housing A+, health & safety B+; Watch: crime D-, amenities F, commute F.
- Cumberland County Schools (urban): math 32% / reading 41% proficiency, ranked #126 of 178 in NC (top 71%) — families likely to look elsewhere, expect single-tenant / working-renter base with shorter leases.
- Zoned schools: C Wayne Collier Elementary (math 26% / reading 27%, grade F, #1,073 of 1,410 statewide, top 77%, 526 students, 99% FRL); Hope Mills Middle (math 27% / reading 34%, grade F, #331 of 475 statewide, top 70%, 514 students, 99% FRL); South View High (math 60% / reading 43%, grade D+, #299 of 535 statewide, top 56%, 1,502 students, 66% FRL) — zoned schools average 88% FRL vs 55% district-wide (34 pts higher); higher-poverty schools than district average — tighter screening recommended.
- Market conditions: Rents rising fast (+4.3%/yr); 319 active listings in the ZIP; 11 comparable units currently listed for rent nearby; rentals at typical pace (median 16d on market — plan ~3-4 weeks tenant-placement turnaround); 1,125 units permitted in Cumberland County in 2024 (104 in 5+ unit buildings).
- This rent runs 31% of the median local income ($66k/yr) — at the standard rent-burdened threshold; future hikes will face affordability resistance.
Forward outlook
- Local home prices are declining (-3.0%/yr); year-one equity from $1k of loan paydown is wiped out by about $6k of value loss. Plan a longer hold.
Negotiation context
- It's been on market 38 days — a 3% lower offer ($199k) is reasonable based on typical stale-listing flexibility.
- 2 sale attempts since 13y ago with the ask held roughly flat each time — persistent listings suggest the price (not the market) is what's stuck; bring a comps-based counter.
- Current owner paid $89k; list at $205k implies a 130% gain — meaningful room to come down on a strong offer.
Risks & watch-outs
- Climate carrying-cost: major wind risk, 78% chance of damaging wind over 30y; moderate wildfire risk; extreme-heat days projected 7→16/yr by 2055 (HVAC capex compounding) — expect insurance premiums to compound above CPI over the hold.
Questions for the listing agent
- What do current leases actually rent for vs. the listed asking? Can we see a recent rent roll and the last 12 months of T-12 income?
- It's been on market 38 days. Have you received any prior offers? Is the seller open to a 18% concession, seller financing, or rate buy-down credit?
- Built in 1974 — when were the roof, HVAC, electrical panel, plumbing, and water heater last replaced?
- Is there a deadline driving the sale (1031 exchange, divorce, estate, relocation)? That informs how much negotiation room exists.
- Schools are D-rated, which usually means shorter tenancies and higher turnover. Who's the typical renter profile here, and what's been the actual vacancy rate?
- Crime grade is D in this area — have there been break-ins, vandalism, or insurance claims at this property in the last 3 years? What carrier currently insures it and at what premium?
- The area grade is low — what's the realistic commute time and amenity access for the typical tenant pool here? Any planned neighborhood developments (good or bad) we should know about?
- What's the average days-on-market for RENTAL listings here right now (not sales)? A rising rental-DOM trend means longer vacancies and softer asking-rent achievability than the comps imply.
- What's the recent tenant-quality profile in this submarket — average credit score on applications, eviction rate, late-payment / NSF rate, and stable-employment percentage? A property-management company in the area should have these aggregated.
- How much new for-sale + rental construction is in the pipeline within 1–3 miles? Heavy new supply typically softens prices + rents 12–24 months out; constrained supply supports both.
Investment metrics
- 1% rule
- 0.82% ✗
- Cap rate
- 5.97%
- Cash-on-cash
- -1.15%
- DSCR
- 0.95
- GRM
- 10.1
CMA / ARV
- ARV (on-the-fly)
- $247,016
- Comps found
- 12
Show comp detail 12 sales within ~0.75 mi
| Address | Dist | Beds/Ba | Sqft | Sold | Price | $/sf | Match |
|---|---|---|---|---|---|---|---|
| 3238 Glenmore Dr | 0.00mi | 3/2.0 | 1,785 (+11%) | 0mo | $204,900 | $115 | 77 |
| 3522 Golfview Rd | 0.32mi | 3/2.0 | 1,603 (-0%) | 6mo | $205,000 | $128 | 76 |
| 5828 Fairway Dr | 0.51mi | 3/2.5 | 1,607 (+0%) | 1mo | $249,320 | $155 | 73 |
| 3601 Golfview Rd | 0.38mi | 3/2.0 | 1,682 (+5%) | 2mo | $236,600 | $141 | 69 |
| 3533 Rittenour Dr | 0.28mi | 3/2.5 | 1,397 (-13%) | 1mo | $249,900 | $179 | 63 |
| 3603 Colonial Cv | 0.29mi | 3/2.0 | 1,445 (-10%) | 4mo | $221,000 | $153 | 63 |
| 5714 Crenshaw Dr | 0.66mi | 3/2.0 | 1,510 (-6%) | 0mo | $242,500 | $161 | 55 |
| 5904 Genesis Ct | 0.73mi | 3/2.0 | 1,681 (+5%) | 2mo | $268,900 | $160 | 53 |
| 3638 Golfview Rd | 0.41mi | 3/2.0 | 1,814 (+13%) | 5mo | $279,900 | $154 | 51 |
| 3732 Floyd Dr | 0.60mi | 3/2.5 | 1,792 (+12%) | 1mo | $265,000 | $148 | 49 |
| 3718 Floyd Dr | 0.64mi | 3/2.0 | 1,749 (+9%) | 3mo | $265,000 | $152 | 49 |
| 5803 Labonte Dr | 0.65mi | 3/2.0 | 1,432 (-11%) | 4mo | $286,400 | $200 | 45 |
Match score weights: distance 35% · size 25% · config 20% · recency 20%. Top-matched comps best support the ARV.
Projected returns pro-forma
-3.0% appreciation · 4.28% rent growth · sell at horizon
- IRR
- -16.8%
- Equity multiple
- 0.40×
- Total profit
- $-34,509
- Equity at exit
- $30,551
- IRR
- -6.5%
- Equity multiple
- 0.56×
- Total profit
- $-25,270
- Equity at exit
- $17,716
Cash invested: $57,372 (down + closing). Projections, not guarantees.
Landlord ↔ Tenant lean methodology
- Overall (STATE)
- 85 Strongly Landlord-Friendly
- State North Carolina
- 85 Strongly Landlord-Friendly · R+3
- County
- — inherits STATE
- City
- — inherits STATE
ZIP-level market 28348
- Home prices YoY
- -14.0%
- Rents YoY
- 4.3%
- Active inventory
- 319
- Price-to-rent
- 10.1×
Monthly cashflow live
- Estimated rent
- $1,688 high interval (Pro) →
- Mortgage (P&I)
- −$1,075
- Tax from tax record
- −$229 /mo · $2,744/yr
- Insurance
- −$85
- HOA
- −$0
- Vacancy / Maint / Mgmt
- −$354
- Net cashflow
- $-55
Break-even live
Sensitivity live
| Price | -10% $61 | -5% $3 | +0% $-55 | +5% $-113 | +10% $-171 |
|---|---|---|---|---|---|
| Rent | -10% $-189 | -5% $-122 | +0% $-55 | +5% $11 | +10% $78 |
| Rate | -1.0pp $48 | -0.5pp $-3 | base $-55 | +0.5pp $-108 | +1.0pp $-162 |
UW: 25.0% down · 7.5% · 30yr · 1.5% tax · 5.0% vac · 8.0% maint · 8.0% mgmt
Financing live
Cash to close
- Down payment
- $51,225
- Closing costs
- $6,147
- Reserves months
- —
- Total cash needed
- —
Loan-product check · same deal, 3 products live
Conventional
25% down · 7.5% · 30yr
- Down + closing
- —
- Monthly P&I
- —
- Monthly cashflow
- —
- DSCR
- —
- Eligible?
- —
Personal DTI + credit; lowest rate.
DSCR
20% down · 8.5% · 30yr
- Down + closing
- —
- Monthly P&I
- —
- Monthly cashflow
- —
- DSCR
- —
- Eligible?
- —
No personal income docs; deal must DSCR.
Hard money
10% down · 12.0% · 12mo
- Down + closing
- —
- Monthly P&I
- —
- Monthly cashflow
- —
- DSCR
- —
- Eligible?
- —
Short-term bridge; refi at stabilization.
Rent comps 11 comps
| Address | Beds | Baths | Sqft | Rent | $/sqft | DOM | Units | Dist |
|---|---|---|---|---|---|---|---|---|
| 3506 Shipstone Pl Hope Mills, NC | 2.0 | 2.0 | 1280 | $1,380 | $1.08 | 15d | 3 | 0.21mi |
| 3636 Metric Dr Hope Mills, NC | 3.0 | 1.5 | 1100 | $1,400 | $1.27 | 15d | 1 | 0.29mi |
| 3541 Rittenour Dr Hope Mills, NC | 3.0 | 2.0 | 1552 | $1,825 | $1.18 | 15d | 1 | 0.32mi |
| 3332 Kenmont Ln Unit E Hope Mills, NC | 2.0 | 2.5 | 1100 | $1,150 | $1.05 | 25d | 1 | 0.63mi |
| 3511 Birchfield Ct Fayetteville, NC | 2.0–3.0 | 2.0 | 1270 | $1,685 | $1.33 | 15d | 5 | 0.72mi |
| 3766 Colonial Cv Hope Mills, NC | 3.0 | 1.5 | 1475 | $1,445 | $0.98 | 15d | 1 | 0.83mi |
| 5959 Rehoboth Rd Hope Mills, NC | 3.0 | 2.0 | 1667 | $1,795 | $1.08 | 15d | 1 | 0.85mi |
| 3462 Marty Cir Hope Mills, NC | 3.0 | 2.0 | 1120 | $1,250 | $1.12 | 25d | 1 | 0.90mi |
| 5715 Walkabout Rd Hope Mills, NC | 3.0 | 2.0 | 1143 | $1,675 | $1.47 | 25d | 1 | 1.04mi |
| 2935 Chillingworth Dr Fayetteville, NC | 3.0 | 2.0 | 1403 | $1,750 | $1.25 | 15d | 1 | 1.36mi |
| 6258 Stoney Point Loop Fayetteville, NC | 3.0 | 2.5 | 1799 | $2,300 | $1.28 | 15d | 1 | 1.45mi |
Listing history 4 events
-
2026-04-17$204,900 Active
-
2013-10-04$105,000
-
2005-12-02soldstatus $89,000
-
1997-12-22soldstatus $73,000
ⓘ Source: listings_history table (triggers on properties + properties_extension) + one-shot
backfill from property_details.listing_events for pre-trigger history.
Tax reassessment forecast NC · Resets to sale price
- Current annual tax
- $2,744 · $229/mo
- Projected year-2 tax
- $2,744 · $229/mo
- Expected delta
- $0/yr ($0/mo · 0.0%)
ⓘ Screening estimate from a state-policy table — verify with the county assessor before closing.
Climate risk First Street
- Flood 1/10 Low FEMA zone X (unshaded) · 0% chance over 30 yrs
- Wildfire 5/10 Major
- Heat 7/10 Severe 7 d/yr ≥106°F today · 16 d/yr by 30 yrs out
- Wind 7/10 Severe 78% chance of damaging wind over 30 yrs
- Air quality 1/10 Low 0 unhealthy d/yr today · 0 by 30 yrs out
Nearby sold comps map
Loading sold comps map…
Walkable amenities ~0.75 mi
Loading nearby amenities…
Taxation est. · year 1
- Rental income
- $20,253
- − Mortgage interest
- −$11,478
- − Property taxes
- −$2,744
- − Insurance
- −$1,024
- − Repairs & maintenance
- −$1,620
- − Management
- −$1,620
- − Depreciation
- −$5,961
- Taxable loss
- −$4,194
- Est. tax savings @ 24.0%
- +$1,007
- After-tax cash flow
- $344/yr
For passive investors: Depreciation is non-cash, so a rental often shows a tax loss while cash-flowing — sheltering income. Rental losses are passive: they offset passive income freely, and up to $25,000/yr can offset ordinary (W-2) income if you actively participate and your MAGI is under $100k (phasing out to $0 by $150k); unused losses carry forward. On sale, claimed depreciation is recaptured at up to 25%, and gains may owe capital-gains tax (a 1031 exchange can defer both). Figures are a year-1 estimate at your 24.0% rate — not tax advice; consult a CPA.
Schools (NCES district)
- District
- Cumberland County Schools
- NCES district ID
- 3700011
- Math proficiency
- 32% ▼ -2.00%
- Reading proficiency
- 41% ▼ -1.00%
- Median HH income
- $44,168
- Composite
- 31.0/100
- National rank
- #6096
- State rank
- #126 of 178 in NC
Livability — Hope Mills
- Score
- 67/100
- State rank
- #234
- US rank
- #10761
Category grades
Schools grade is shown separately in the Schools card above.
Census & demographics
- Census place
- Hope Mills, NC
- County
- Cumberland County · 265,314 people
- City population
- 39,196
- Metro
- Fayetteville, NC
- Population (ZIP)
- 39,196
- Household income
- $66,129
- Rent vs Own
- Severe rent burden
- 746.0
Population outlook (Cumberland County) Hauer SSP2
- Today (2025)
- 330,855 people
- By 2030
- 333,523 · +0.8%
- By 2040
- 335,583 · +1.4%
- By 2050
- 335,325 · +1.4%
- By 2075
- 342,853 · +3.6%
- By 2100
- 340,698 · +3.0%
Race, ethnicity, and origin ACS 2023
- Neighborhood character
- Diverse neighborhood (Simpson 0.67)
- Race & ethnicity
- White 49% Black 27% Hispanic / Latino 13% Two or more races 11% Asian 2% Native American 2%
- Hispanic origin (detail)
- Mexican 4% Puerto Rican 5%
- Common ancestry
- Romanian 2% Lithuanian 1% Serbian 1%
- Foreign-born
- 5% · Canada, South Korea, Vietnam
- Languages at home
- 90% English-only · Spanish 8% Other Indo-European 1%
Political lean MEDSL · Cumberland
- 2024 margin
- D (+13.4) · D 56.1% · R 42.7% · Other 1.2%
- 2008→2024 swing
- -4.3pp toward R · 2008: 17.7pp · 2024: 13.4pp
- All cycles
- 2024: D+13.4 2020: D+16.6 2016: D+16.0 2012: D+19.7 2008: D+17.7
Not yet ingested
- Civics
- —
Market trends
- HPI YoY
- ▼ -37.14%
- Current HPI
- 228.3122
- Rent YoY
- ▲ 4.28%
- Metro
- Fayetteville, NC
- State GDP YoY
- ▲ 3.28%
- F500 in state
- 26
Industry mix (Fortune 500 HQ in NC)
| Industry | F500 HQs | Revenue |
|---|---|---|
| Financial Services | 2 | $213B |
|
||
| Retail | 2 | $95B |
|
||
| Industrial Conglomerate | 1 | $38B |
|
||
| Metals / Steel | 1 | $35B |
|
||
| Utilities | 1 | $30B |
|
||
| Industrial Machinery | 1 | $19B |
|
||
Price history
+180.7% since first listed4 events — show timeline
- 2026-04-17 Listed $204,900 LPRMLS
- 2013-10-04 Listed $105,000 LPRMLS
- 2005-12-02 Sold (Public Records) $89,000 Public Records
- 1997-12-22 Sold (Public Records) $73,000 Public Records
Property tax history
+5.0%/yrLatest (2025): $2,744 · +44.1% YoY. Source: county tax records.
Cash-flow waterfall
monthlySold comps — $/sqft
last 12 mo · ≤1 miLoading sold comps…