711 Springwell Dr · Princeton, TX
Flood risk 1/10 · Minimal
- FEMA flood zone
- X (unshaded)
- Chance of flooding over 30 yrs
- 0.0%
- Est. flood insurance / yr
- $507 – $1,088
Fire risk 5/10 · Moderate
- Est. fire insurance / yr
- $1,222 – $2,270
Heat risk 7/10 · Major
- Hot days now (above 110°F)
- 7 days/yr
- Hot days in 30 yrs
- 25 days/yr
Wind risk 6/10 · Moderate
- Chance of severe wind over 30 yrs
- 27.0%
Air-quality risk 3/10 · Minor
- Unhealthy air days now
- 3 days/yr
- Unhealthy air days in 30 yrs
- 3 days/yr
Risk factors via First Street. Map © Google.
Why this score? — see what drove the D- grade
The composite is a weighted blend of 9 inputs, each scored 0–100. Each bar is that input's sub-score; the figure is the points it added to the 100-point composite (weight × sub-score).
- ARV discount +15.0/15.0
- Cash flow +7.5/30.0
- Schools +4.2/10.0
- Livability +3.1/5.0
- 1% rule +2.6/10.0
- Condition / age +2.5/5.0
- Rent growth +2.2/5.0
- DSCR +1.6/10.0
- Appreciation +0.0/10.0
$262,990
🖨 Deal sheet (PDF) 📄 Offer letter ✓ Due diligence
Listing remarks
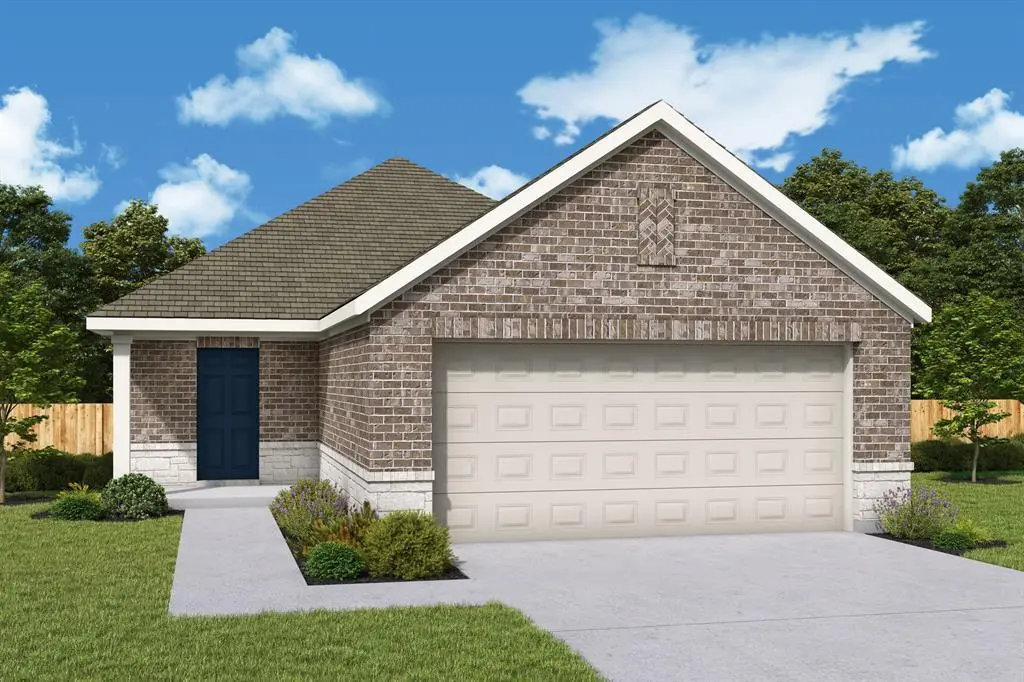
MLS# 21249602 - Built by Imagination Homes - Ready Now! ~ Imagination Homes proudly presents the Sonnet Floorplan, a thoughtfully designed single-story home offering comfort, functionality, and inviting living spaces throughout. A 3 Bedroom, 2 Bathroom, 2 Car Garage with 1,424 SF of living space that feels much bigger. Step inside through the welcoming entry and discover an open-concept layout that seamlessly connects the kitchen, dining, and family room—perfect for everyday living and effortless entertaining. The spacious family room flows naturally into the dining area and kitchen, creating a bright and airy central gathering space. The kitchen features a large island, pantry, and c
Key facts
- Dual vanities
- Walk-in closet
- Soaking tub
Tags
Property features AI
Finance
- Other: Energy-efficient features including attic insulation, efficient appliances, insulation, energy-efficient lighting, mechanical fresh air, rain/freeze sensors, and thermostat
- Financial info: Treat as clear loan type; No second mortgage indicated
- HOA & community: Mandatory HOA (Clearhaven Homeowners Association); HOA fee $1,120 annually; Association includes internet; HOA management company contact available
Exterior
- Parking: 2 covered spaces; 2-car attached garage with garage door opener and double doors; Driveway
- Security: Smoke detectors installed
- Utilities: Electricity connected; Co-op water; Underground utilities; Community mailbox; Sidewalk; Municipal utility district: No
- Home design: Single family residence; One story; New construction (incomplete, 2026); Not attached to other units; Planned development: Clearhaven
- Construction: Brick construction; Radiant barrier; Composition/shingle roof; Slab foundation
- Exterior features: Back yard wood fencing; Sprinkler system; Subdivision setting; Playground in community; Community mailbox; Curbs and sidewalks
Interior
- Kitchen: Electric range; Microwave; Dishwasher; Disposal; Solid surface countertops (non-natural)
- Bedrooms: 3 bedrooms (all on main level); Primary bedroom with walk-in closet
- Flooring: Carpet; Luxury vinyl plank
- Bathrooms: 2 full bathrooms; Primary bathroom with separate shower and dual sinks; Bathroom(s) with built-in cabinets and granite countertops
- Heating & cooling: Central heating (electric); Central air conditioning (electric)
- Interior features: Open floorplan; Kitchen island; Eat-in kitchen; Pantry; Walk-in pantry; Double vanity; Built-in cabinets; High speed internet available; Cable TV available
- Laundry & utility: Washer hookup; Electric dryer hookup; Separate utility room
Neighborhood map
What this means for you Summary
Snapshot
- This is a 3-bed/2.0-bath single-family listed at $263k.
Deal economics
- At list price, monthly cash flow is $-325 ($-4k/yr) — negative.
- To cash-flow at today's rent, offer at most $216k (17.9% below list).
- To meet the 1% rule (rent ≥ 1% of price), the offer needs to be $201k (23.7% below list).
- Recommended offer: $201k (23.7% below list) — sets the bar for 1% rule.
Location & tenants
- Location reads 62/100 on livability (#969 in TX) — a middle-class / working-renter tenant base. Strengths: employment A+, housing A+, cost of living A; Watch: amenities F, commute F, health & safety F.
- Princeton ISD (suburban): math 51% / reading 47% proficiency, ranked #188 of 826 in TX (top 23%) — families likely to look elsewhere, expect single-tenant / working-renter base with shorter leases.
- Zoned schools: Harper El (math 50% / reading 41%, grade D-, #1,112 of 4,322 statewide, top 26%, 436 students, 56% FRL) — zoned schools at 56% FRL track the district average.
- Market conditions: Rents soft (-1.0%/yr); 1409 active listings in the ZIP; 40 comparable units currently listed for rent nearby; rentals at typical pace (median 26d on market — plan ~3-4 weeks tenant-placement turnaround); solid renter incomes; 19,194 units permitted in Collin County in 2024 (3,988 in 5+ unit buildings).
Forward outlook
- Local home prices are declining (-3.0%/yr); year-one equity from $2k of loan paydown is wiped out by about $8k of value loss. Plan a longer hold.
- Collin County population projected at +60% by 2050 — long-run rental-demand tailwind backs the buy-and-hold thesis.
Negotiation context
- It's been on market 58 days — a 3% lower offer ($255k) is reasonable based on typical stale-listing flexibility.
Risks & watch-outs
- Climate carrying-cost: major wind risk, 27% chance of damaging wind over 30y; moderate wildfire risk; extreme-heat days projected 7→25/yr by 2055 (HVAC capex compounding) — expect insurance premiums to compound above CPI over the hold.
Questions for the listing agent
- What do current leases actually rent for vs. the listed asking? Can we see a recent rent roll and the last 12 months of T-12 income?
- It's been on market 58 days. Have you received any prior offers? Is the seller open to a 24% concession, seller financing, or rate buy-down credit?
- What does the HOA fee cover, when was the last increase, and are there any pending special assessments or reserve-fund shortfalls?
- Is there a deadline driving the sale (1031 exchange, divorce, estate, relocation)? That informs how much negotiation room exists.
- The area grade is low — what's the realistic commute time and amenity access for the typical tenant pool here? Any planned neighborhood developments (good or bad) we should know about?
- What's the average days-on-market for RENTAL listings here right now (not sales)? A rising rental-DOM trend means longer vacancies and softer asking-rent achievability than the comps imply.
- What's the recent tenant-quality profile in this submarket — average credit score on applications, eviction rate, late-payment / NSF rate, and stable-employment percentage? A property-management company in the area should have these aggregated.
- How much new for-sale + rental construction is in the pipeline within 1–3 miles? Heavy new supply typically softens prices + rents 12–24 months out; constrained supply supports both.
Investment metrics
- 1% rule
- 0.76% ✗
- Cap rate
- 4.81%
- Cash-on-cash
- -5.30%
- DSCR
- 0.76
- GRM
- 10.9
CMA / ARV
- ARV (median comp)
- $315,674
- List price
- $262,990
- Delta
- -16.69%
- Verdict
- UNDERPRICED
- Comps
- 20 within 1.0 mi
Show comp detail 12 sales within ~0.75 mi
| Address | Dist | Beds/Ba | Sqft | Sold | Price | $/sf | Match |
|---|---|---|---|---|---|---|---|
| 1135 Loch Way | 0.07mi | 3/2.0 | 1,552 (+9%) | 0mo | $290,600 | $187 | 82 |
| 1140 Laguna Ln | 0.06mi | 3/2.0 | 1,291 (-9%) | 0mo | $239,990 | $186 | 81 |
| 1111 Loch Way | 0.11mi | 3/2.0 | 1,552 (+9%) | 2mo | $283,440 | $183 | 78 |
| 777 Saxony Dr | 0.57mi | 3/2.0 | 1,491 (+5%) | 3mo | $279,955 | $188 | 63 |
| 913 Poppy Cove Ln | 0.24mi | 3/2.0 | 1,552 (+9%) | 21mo | $312,980 | $202 | 56 |
| 875 Poppy Cove Ln | 0.28mi | 3/2.0 | 1,552 (+9%) | 21mo | $304,980 | $197 | 55 |
| 480 Lake Erie Dr | 0.43mi | 3/2.0 | 1,249 (-12%) | 6mo | $235,000 | $188 | 54 |
| 860 Poppy Cove Ln | 0.31mi | 3/2.0 | 1,552 (+9%) | 22mo | $305,590 | $197 | 52 |
| 842 Poppy Cove Ln | 0.33mi | 3/2.0 | 1,552 (+9%) | 22mo | $305,190 | $197 | 51 |
| 622 Windsor Dr | 0.67mi | 3/2.0 | 1,567 (+10%) | 17mo | $343,293 | $219 | 38 |
| 418 Boroughbridge Dr | 0.75mi | 3/2.0 | 1,567 (+10%) | 17mo | $335,249 | $214 | 34 |
| 523 Oxford Loop | 0.72mi | 4/2.0 (+1) | 1,608 (+13%) | 19mo | $234,900 | $146 | 24 |
Match score weights: distance 35% · size 25% · config 20% · recency 20%. Top-matched comps best support the ARV.
Projected returns pro-forma
-3.0% appreciation · 0.0% rent growth · sell at horizon
- IRR
- -28.9%
- Equity multiple
- 0.06×
- Total profit
- $-69,105
- Equity at exit
- $39,213
- IRR
- -48.0%
- Equity multiple
- -0.48×
- Total profit
- $-109,199
- Equity at exit
- $22,739
Cash invested: $73,637 (down + closing). Projections, not guarantees.
Landlord ↔ Tenant lean methodology
- Overall (STATE)
- 87 Strongly Landlord-Friendly
- State Texas
- 87 Strongly Landlord-Friendly · R+5
- County
- — inherits STATE
- City
- — inherits STATE
ZIP-level market 75407
- Home prices YoY
- -30.3%
- Rents YoY
- -1.0%
- Active inventory
- 1409
- Price-to-rent
- 10.9×
Monthly cashflow live
- Estimated rent
- $2,007 high interval (Pro) →
- Mortgage (P&I)
- −$1,379
- Tax est. 1.5%
- −$329 /mo · $3,945/yr
- Insurance
- −$110
- HOA
- −$93
- Vacancy / Maint / Mgmt
- −$421
- Net cashflow
- $-325
Break-even live
Sensitivity live
| Price | -10% $-143 | -5% $-234 | +0% $-325 | +5% $-416 | +10% $-507 |
|---|---|---|---|---|---|
| Rent | -10% $-483 | -5% $-404 | +0% $-325 | +5% $-246 | +10% $-166 |
| Rate | -1.0pp $-192 | -0.5pp $-258 | base $-325 | +0.5pp $-393 | +1.0pp $-462 |
UW: 25.0% down · 7.5% · 30yr · 1.5% tax · 5.0% vac · 8.0% maint · 8.0% mgmt
Financing live
Cash to close
- Down payment
- $65,748
- Closing costs
- $7,890
- Reserves months
- —
- Total cash needed
- —
Loan-product check · same deal, 3 products live
Conventional
25% down · 7.5% · 30yr
- Down + closing
- —
- Monthly P&I
- —
- Monthly cashflow
- —
- DSCR
- —
- Eligible?
- —
Personal DTI + credit; lowest rate.
DSCR
20% down · 8.5% · 30yr
- Down + closing
- —
- Monthly P&I
- —
- Monthly cashflow
- —
- DSCR
- —
- Eligible?
- —
No personal income docs; deal must DSCR.
Hard money
10% down · 12.0% · 12mo
- Down + closing
- —
- Monthly P&I
- —
- Monthly cashflow
- —
- DSCR
- —
- Eligible?
- —
Short-term bridge; refi at stabilization.
Rent comps 40 comps
| Address | Beds | Baths | Sqft | Rent | $/sqft | DOM | Units | Dist |
|---|---|---|---|---|---|---|---|---|
| 605 Grenada Lake Dr Princeton, TX | 3.0 | 2.0 | 1563 | $1,925 | $1.23 | 16d | 1 | 0.22mi |
| 1525 Farm to Market Road 982 Princeton, TX | 2.0–4.0 | 2.0–2.5 | 1551 | $2,332 | $1.50 | 0d | 53 | 0.29mi |
| 882 Breakwater Dr Princeton, TX | 4.0 | 2.5 | 1824 | $2,250 | $1.23 | 23d | 1 | 0.30mi |
| 846 Breakwater Dr Princeton, TX | 3.0 | 2.5 | 1824 | $2,000 | $1.10 | 0d | 1 | 0.34mi |
| 846 Breakwater Dr Princeton, TX | 3.0 | 2.5 | 1824 | $2,000 | $1.10 | 4d | 1 | 0.34mi |
| 865 Table Rock St Princeton, TX | 3.0 | 2.0 | 1563 | $2,050 | $1.31 | 23d | 1 | 0.36mi |
| 229 Marsh Ln Princeton, TX | 3.0 | 2.5 | 1550 | $1,650 | $1.06 | 25d | 1 | 0.40mi |
| 315 Stone Ct Princeton, TX | 3.0 | 2.5 | 1573 | $2,100 | $1.34 | 45d | 1 | 0.40mi |
| 843 Ozark Path Princeton, TX | 3.0 | 2.0 | 1249 | $2,100 | $1.68 | 45d | 1 | 0.42mi |
| 803 Table Rock St Princeton, TX | 4.0 | 2.5 | 1683 | $1,850 | $1.10 | 45d | 1 | 0.42mi |
| 303 Stone Ct Princeton, TX | 3.0 | 2.5 | 1586 | $1,700 | $1.07 | 25d | 1 | 0.42mi |
| 303 Stone Ct Princeton, TX | 3.0 | 2.5 | 1586 | $1,700 | $1.07 | 0d | 1 | 0.42mi |
| 220 Marsh Ln Princeton, TX | 4.0 | 2.5 | 1722 | $1,785 | $1.04 | 6d | 1 | 0.43mi |
| 203 Marsh Ln Princeton, TX | 3.0 | 2.5 | 1586 | $1,575 | $0.99 | 8d | 1 | 0.46mi |
| 204 Marsh Ln Princeton, TX | 4.0 | 2.5 | 1722 | $1,700 | $0.99 | 45d | 1 | 0.47mi |
| 366 Lake Erie Dr Princeton, TX | 4.0 | 2.5 | 1824 | $1,990 | $1.09 | 25d | 1 | 0.50mi |
| 622 Saxony Dr Princeton, TX | 3.0 | 2.0 | 1567 | $2,000 | $1.28 | 45d | 1 | 0.61mi |
| 649 Saxony Dr Princeton, TX | 4.0 | 2.0 | 1674 | $2,100 | $1.25 | 0d | 1 | 0.61mi |
| 649 Saxony Dr Princeton, TX | 4.0 | 2.0 | 1674 | $2,100 | $1.25 | 14d | 1 | 0.61mi |
| 461 Princewood Dr Princeton, TX | 3.0 | 2.0 | 1749 | $1,750 | $1.00 | 25d | 1 | 0.74mi |
| 353 Princewood Dr Princeton, TX | 4.0 | 2.0 | 1753 | $1,950 | $1.11 | 45d | 1 | 0.83mi |
| 899 E Hazelwood St Princeton, TX | 1.0–3.0 | 1.0–2.0 | 989 | $1,780 | $1.80 | 0d | 13 | 0.89mi |
| 502 E Hazelwood St Princeton, TX | 3.0 | 2.0 | 1295 | $1,550 | $1.20 | 45d | 1 | 0.96mi |
| 514 E Hazelwood St Unit B Princeton, TX | 3.0 | 2.0 | 1380 | $1,495 | $1.08 | 45d | 1 | 0.96mi |
| 514 E Hazelwood St Princeton, TX | 3.0 | 2.0 | 1380 | $1,475 | $1.07 | 25d | 1 | 0.96mi |
| 514 E Hazelwood St Unit B Princeton, TX | 3.0 | 2.0 | 1380 | $1,475 | $1.07 | 8d | 1 | 0.96mi |
| 514 E Hazelwood St Princeton, TX | 3.0 | 2.0 | 1380 | $1,475 | $1.07 | 0d | 1 | 0.96mi |
| 200 Cole St Princeton, TX | 1.0–3.0 | 1.0–2.0 | 960 | $1,799 | $1.87 | 45d | 23 | 0.97mi |
| 200 Cole St Princeton, TX | 1.0–2.0 | 1.0–2.0 | 838 | $1,263 | $1.51 | 0d | 8 | 0.97mi |
| 512 E Hazelwood St Unit A Princeton, TX | 3.0 | 2.0 | 1295 | $1,349 | $1.04 | 45d | 1 | 0.97mi |
| 414 E Hazelwood St Princeton, TX | 3.0 | 2.0 | 1328 | $1,595 | $1.20 | 25d | 1 | 0.98mi |
| 226 Griffith Dr Princeton, TX | 3.0 | 2.5 | 1339 | $1,675 | $1.25 | 25d | 1 | 1.02mi |
| 325 Allenwood Dr Princeton, TX | 3.0 | 1.5 | 1008 | $1,900 | $1.88 | 45d | 1 | 1.03mi |
| 1501 Hidden Bluff Xing Princeton, TX | 4.0 | 2.0 | 1794 | $2,200 | $1.23 | 14d | 1 | 1.04mi |
| 420 Gunsmoke Trl Princeton, TX | 4.0 | 2.0 | 1865 | $1,975 | $1.06 | 8d | 1 | 1.08mi |
| 408 Stampede Ln Princeton, TX | 4.0 | 2.0 | 1794 | $1,925 | $1.07 | 45d | 1 | 1.10mi |
| 7008 Vining DR Princeton, TX | 4.0 | 3.0 | 1510 | $2,500 | $1.66 | 45d | 1 | 1.12mi |
| 149 Princeton Xrds Princeton, TX | 1.0–3.0 | 1.0–2.0 | 980 | $1,889 | $1.93 | 0d | 22 | 1.14mi |
| 513 Spur Rdg Princeton, TX | 3.0 | 2.0 | 1622 | $2,200 | $1.36 | 18d | 1 | 1.19mi |
| 2583 FM 982 Princeton, TX | 2.0 | 1.0 | 952 | $1,495 | $1.57 | 25d | 1 | 1.21mi |
HOA detail
- Monthly dues
- $93 · $1,116/yr
Listing history 19 events
-
2026-06-21days on market $262,990 Active 58 DOM
-
2026-06-18days on market $262,990 Active 55 DOM
-
2026-06-17days on market $262,990 Active 54 DOM
-
2026-06-16days on market $262,990 Active 53 DOM
-
2026-06-15days on market $262,990 Active 52 DOM
-
2026-06-13days on market $262,990 Active 50 DOM
-
2026-06-13pricedays on market $262,990 Active 49 DOM
-
2026-06-09days on market $264,990 Active 46 DOM
-
2026-06-08days on market $264,990 Active 45 DOM
-
2026-06-07days on market $264,990 Active 44 DOM
-
2026-06-04days on market $264,990 Active 41 DOM
-
2026-06-03days on market $264,990 Active 40 DOM
-
2026-06-02days on market $264,990 Active 39 DOM
-
2026-06-01days on market $264,990 Active 38 DOM
-
2026-05-31days on market $264,990 Active 37 DOM
-
2026-05-14price $264,990 1619-char remark
-
2026-05-01price $269,990 1619-char remark
-
2026-04-28price $279,990 1619-char remark
-
2026-04-24$288,125 Active 1619-char remark
ⓘ Source: listings_history table (triggers on properties + properties_extension) + one-shot
backfill from property_details.listing_events for pre-trigger history.
Climate risk First Street
- Flood 1/10 Low FEMA zone X (unshaded) · 0% chance over 30 yrs
- Wildfire 5/10 Major
- Heat 7/10 Severe 7 d/yr ≥110°F today · 25 d/yr by 30 yrs out
- Wind 6/10 Major 27% chance of damaging wind over 30 yrs
- Air quality 3/10 Moderate 3 unhealthy d/yr today · 3 by 30 yrs out
Nearby sold comps map
Loading sold comps map…
Walkable amenities ~0.75 mi
Loading nearby amenities…
Taxation est. · year 1
- Rental income
- $24,084
- − Mortgage interest
- −$14,732
- − Property taxes
- −$3,945
- − Insurance
- −$1,315
- − Repairs & maintenance
- −$1,927
- − Management
- −$1,927
- − HOA
- −$1,116
- − Depreciation
- −$7,651
- Taxable loss
- −$8,527
- Est. tax savings @ 24.0%
- +$2,047
- After-tax cash flow
- $-1,853/yr
For passive investors: Depreciation is non-cash, so a rental often shows a tax loss while cash-flowing — sheltering income. Rental losses are passive: they offset passive income freely, and up to $25,000/yr can offset ordinary (W-2) income if you actively participate and your MAGI is under $100k (phasing out to $0 by $150k); unused losses carry forward. On sale, claimed depreciation is recaptured at up to 25%, and gains may owe capital-gains tax (a 1031 exchange can defer both). Figures are a year-1 estimate at your 24.0% rate — not tax advice; consult a CPA.
Schools (NCES district)
- District
- Princeton ISD
- NCES district ID
- 4835850
- Math proficiency
- 51% ▼ -8.00%
- Reading proficiency
- 47% ▬ 0.00%
- Median HH income
- $54,827
- Composite
- 42.44/100
- National rank
- #3226
- State rank
- #188 of 826 in TX
Livability — Princeton
- Score
- 62/100
- State rank
- #969
- US rank
- #17215
Category grades
Schools grade is shown separately in the Schools card above.
Census & demographics
- County
- Collin County · 1,159,394 people
- City population
- 34,171
- Metro
- Dallas-Fort Worth-Arlington, TX
- Population (ZIP)
- 34,171
- Household income
- $100,037
- Rent vs Own
- Severe rent burden
- 368.0
Population outlook (Collin County) Hauer SSP2
- Today (2025)
- 1,210,074 people
- By 2030
- 1,358,201 · +12.2%
- By 2040
- 1,654,061 · +36.7%
- By 2050
- 1,937,359 · +60.1%
- By 2075
- 2,567,039 · +112.1%
- By 2100
- 2,952,048 · +144.0%
Race, ethnicity, and origin ACS 2023
- Neighborhood character
- Diverse neighborhood (Simpson 0.66)
- Race & ethnicity
- White 47% Hispanic / Latino 30% Black 17% Two or more races 10% Asian 4% Native American 1%
- Hispanic origin (detail)
- Mexican 26%
- Common ancestry
- Lithuanian 2% Romanian 1% Russian 1%
- Foreign-born
- 15% · Canada, China, Mexico
- Languages at home
- 70% English-only · Spanish 22% Other Indo-European 2% Other Asian/Pacific 1%
Political lean MEDSL · Collin
- 2024 margin
- R (+11.1) · D 43.1% · R 54.3% · Other 2.6%
- 2008→2024 swing
- +14.4pp toward D · 2008: -25.6pp · 2024: -11.1pp
- All cycles
- 2024: R+11.1 2020: R+4.3 2016: R+17.0 2012: R+31.6 2008: R+25.6
Not yet ingested
- Civics
- —
Market trends
- HPI YoY
- ▼ -103.99%
- Current HPI
- 238.9373
- Rent YoY
- ▼ -1.02%
- Metro
- Dallas-Fort Worth-Arlington, TX
- State GDP YoY
- ▲ 3.95%
- F500 in state
- 110
Industry mix (Fortune 500 HQ in TX)
| Industry | F500 HQs | Revenue |
|---|---|---|
| Energy | 16 | $1,198B |
|
||
| Technology | 5 | $198B |
|
||
| Engineering / Construction | 4 | $72B |
|
||
| Energy Services | 3 | $60B |
|
||
| Utilities | 3 | $41B |
|
||
| Healthcare | 2 | $330B |
|
||
Price history
-8.7% since first listed5 events — show timeline
- 2026-06-13 Price Changed $262,990 NTREIS
- 2026-05-14 Price Changed $264,990 NTREIS
- 2026-05-01 Price Changed $269,990 NTREIS
- 2026-04-28 Price Changed $279,990 NTREIS
- 2026-04-24 Listed $288,125 NTREIS
Cash-flow waterfall
monthlySold comps — $/sqft
last 12 mo · ≤1 miLoading sold comps…