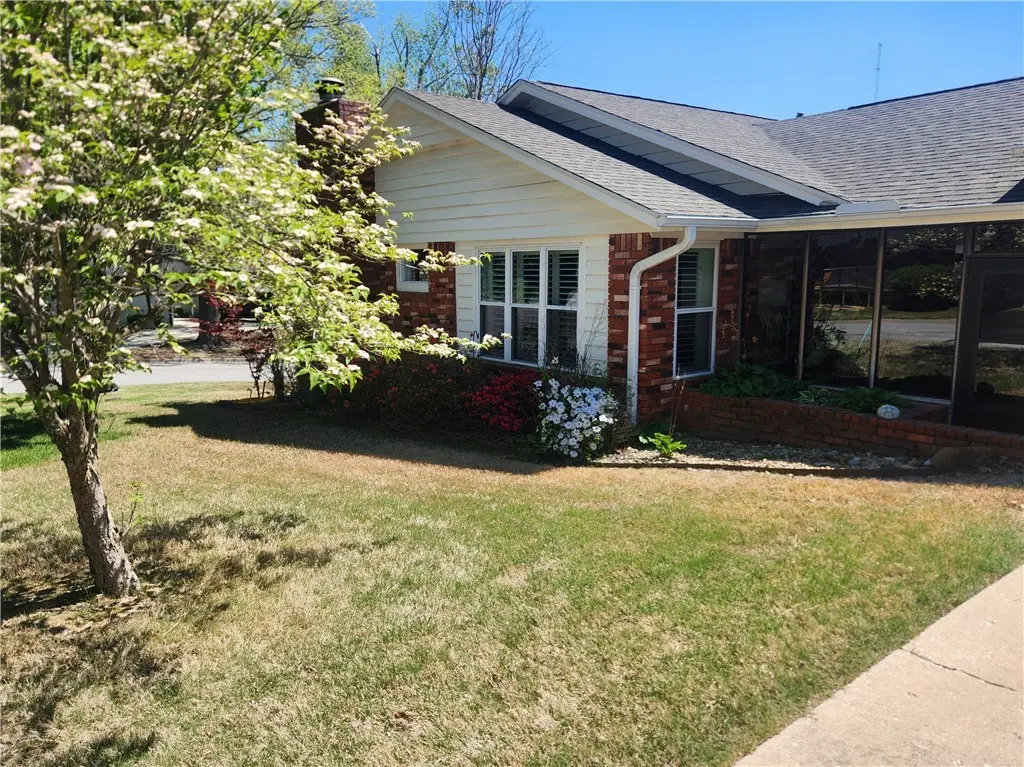
1336 Quail Run Cir · Bentonville, AR
Flood risk 6/10 · Moderate
- FEMA flood zone
- X (unshaded)
- Chance of flooding over 30 yrs
- 0.71%
- Est. flood insurance / yr
- $507 – $1,088
Fire risk 3/10 · Minor
- Est. fire insurance / yr
- $1,499 – $2,785
Heat risk 5/10 · Moderate
- Hot days now (above 104°F)
- 7 days/yr
- Hot days in 30 yrs
- 21 days/yr
Wind risk 2/10 · Minimal
- Chance of severe wind over 30 yrs
- 2.0%
Air-quality risk 2/10 · Minimal
- Unhealthy air days now
- 1 days/yr
- Unhealthy air days in 30 yrs
- 1 days/yr
Risk factors via First Street. Map © Google.
Why this score? — see what drove the D- grade
The composite is a weighted blend of 9 inputs, each scored 0–100. Each bar is that input's sub-score; the figure is the points it added to the 100-point composite (weight × sub-score).
- Cash flow +13.3/30.0
- Schools +5.2/10.0
- Livability +4.2/5.0
- DSCR +4.0/10.0
- Rent growth +3.6/5.0
- 1% rule +2.6/10.0
- ARV discount +2.6/15.0
- Condition / age +2.5/5.0
- Appreciation +0.0/10.0
$570,000
🖨 Deal sheet (PDF) 📄 Offer letter ✓ Due diligence
Listing remarks
Established neighborhood! An unbeatable location just up the hill from Coler bike park, it's a wonderful place to call home. Minutes from Downtown Bentonville and Crystal Bridges Museum. This 3 bedroom, 2 bath home offers 1815 SF PLUS a 310 SF glassed-in heated glassed-in porch, wood-burning fireplace, and custom wood shutters. Roof replaced in 2024. Owner is an Arkansas licensed real estate broker.
Key facts
- Unbeatable location
- Roof replaced
- Custom wood shutters
Tags
Property features AI
Finance
- HOA & community: HOA: monthly fee; Near fire station
Exterior
- Parking: Attached garage with garage door opener; 2 covered spaces
- Security: Fire sprinkler system; Smoke detectors
- Utilities: Electricity available; Natural gas available; Public water; Public sewer
- Home design: Single-story; Faces east; Residential zoning; Entry level: crawlspace foundation
- Construction: Brick and wood siding construction; Asphalt shingle roof; Crawlspace foundation; Built 25+ years ago
- Exterior features: Concrete driveway; Stone patio/porch; Back yard partial fencing; Landscaped; Corner lot; City lot; Subdivision; Public paved road frontage
Interior
- Kitchen: Dishwasher; Electric oven; Microwave; Disposal; Quartz counters; Pantry
- Flooring: Laminate
- Bathrooms: 2 full bathrooms
- Heating & cooling: Central heating (gas); Central air (electric)
- Interior features: Attic; Pantry; Quartz counters; Storage; Shutters; Walk-in closet(s); Window treatments; Double pane windows; Blinds; Plantation shutters
- Laundry & utility: Washer hookup; Dryer hookup; Gas water heater
Neighborhood map
What this means for you Summary
Snapshot
- This is a 3-bed/2.0-bath single-family listed at $570k.
Deal economics
- At list price, monthly cash flow is $-2 ($-30/yr) — negative.
- To cash-flow at today's rent, offer at most $570k (0.1% below list).
- To meet the 1% rule (rent ≥ 1% of price), the offer needs to be $431k (24.4% below list).
- Recommended offer: $431k (24.4% below list) — sets the bar for 1% rule.
- Cap rate 6.3% vs local median 2.6% in Bentonville — top-decile yield for the area; either an underpriced asset or a hidden risk that comps aren't pricing in. Stress-test before assuming the spread holds.
Location & tenants
- Location reads 83/100 on livability (#2 in AR, #864 nationally) — a professional / high-income tenant draw. Strengths: employment A+, housing A+, health & safety A+; Watch: amenities F.
- Bentonville School District (urban): math 59% / reading 59% proficiency, ranked #3 of 238 in AR (top 1%) — acceptable for families but not a draw, mixed tenant base, ~2y average lease.
- Market conditions: Rents rising fast (+4.4%/yr); 745 active listings in the ZIP; 28 comparable units currently listed for rent nearby; rentals at typical pace (median 23d on market — plan ~3-4 weeks tenant-placement turnaround); high-income renter base; 4,359 units permitted in Benton County in 2024 (402 in 5+ unit buildings).
- At $4,310/mo this rent would consume 47% of the median local household income ($111k/yr) (locally 932% of renters already pay >50% of income on rent) — very limited rent-growth headroom before tenants either downsize or default.
Forward outlook
- Local home prices are declining (-3.0%/yr); year-one equity from $4k of loan paydown is wiped out by about $17k of value loss. Plan a longer hold.
- Benton County population projected at +56% by 2050 — long-run rental-demand tailwind backs the buy-and-hold thesis.
Negotiation context
- It's been on market 19 days — a 2% lower offer ($561k) is reasonable based on typical stale-listing flexibility.
- Current owner paid $100k; list at $570k implies a 470% gain — meaningful room to come down on a strong offer.
Risks & watch-outs
- Climate carrying-cost: major flood risk; extreme-heat days projected 7→21/yr by 2055 (HVAC capex compounding) — expect insurance premiums to compound above CPI over the hold.
Questions for the listing agent
- What do current leases actually rent for vs. the listed asking? Can we see a recent rent roll and the last 12 months of T-12 income?
- Is there a deadline driving the sale (1031 exchange, divorce, estate, relocation)? That informs how much negotiation room exists.
- Schools are A-rated — typically a magnet for longer-tenancy family renters. What's the average tenant stay here, and is there a school-zone premium baked into asking?
- The area grade is low — what's the realistic commute time and amenity access for the typical tenant pool here? Any planned neighborhood developments (good or bad) we should know about?
- What's the average days-on-market for RENTAL listings here right now (not sales)? A rising rental-DOM trend means longer vacancies and softer asking-rent achievability than the comps imply.
- What's the recent tenant-quality profile in this submarket — average credit score on applications, eviction rate, late-payment / NSF rate, and stable-employment percentage? A property-management company in the area should have these aggregated.
- How much new for-sale + rental construction is in the pipeline within 1–3 miles? Heavy new supply typically softens prices + rents 12–24 months out; constrained supply supports both.
Investment metrics
- 1% rule
- 0.76% ✗
- Cap rate
- 6.29%
- Cash-on-cash
- -0.02%
- DSCR
- 1.00
- GRM
- 11.0
CMA / ARV
- ARV (on-the-fly)
- $513,645
- Comps found
- 12
Show comp detail 12 sales within ~0.75 mi
| Address | Dist | Beds/Ba | Sqft | Sold | Price | $/sf | Match |
|---|---|---|---|---|---|---|---|
| 9 NW K Pl | 0.16mi | 3/2.0 | 1,719 (-5%) | 2mo | $475,000 | $276 | 82 |
| 1201 NW 10th St | 0.32mi | 3/2.0 | 1,868 (+3%) | 2mo | $538,000 | $288 | 78 |
| 6602 Basswood Ave | 0.33mi | 4/2.0 (+1) | 1,946 (+7%) | 0mo | $416,900 | $214 | 67 |
| 608 NW K St | 0.56mi | 4/2.0 (+1) | 1,796 (-1%) | 1mo | $485,000 | $270 | 67 |
| 915 NW 10th St | 0.34mi | 3/2.0 | 1,746 (-4%) | 14mo | $450,000 | $258 | 66 |
| 1703 Kimberly Pl | 0.56mi | 3/2.5 | 1,783 (-2%) | 7mo | $505,000 | $283 | 63 |
| 1328 Quail Run Cir | 0.06mi | 2/2.0 (-1) | 1,544 (-15%) | 6mo | $398,900 | $258 | 63 |
| 1101 NW 7th St | 0.53mi | 3/2.0 | 1,794 (-1%) | 14mo | $600,000 | $334 | 62 |
| 706 NW 14th St | 0.45mi | 3/2.0 | 1,626 (-10%) | 2mo | $525,000 | $323 | 60 |
| 411 NW Saddlebrook Dr | 0.72mi | 3/2.0 | 1,917 (+6%) | 7mo | $486,000 | $254 | 52 |
| 810 NW 7th St | 0.63mi | 3/2.0 | 2,052 (+13%) | 1mo | $815,000 | $397 | 48 |
| 47 Stonehenge Dr | 0.74mi | 4/2.5 (+1) | 2,073 (+14%) | 12mo | $642,000 | $310 | 24 |
Match score weights: distance 35% · size 25% · config 20% · recency 20%. Top-matched comps best support the ARV.
Projected returns pro-forma
-3.0% appreciation · 4.39% rent growth · sell at horizon
- IRR
- -15.1%
- Equity multiple
- 0.46×
- Total profit
- $-86,672
- Equity at exit
- $84,989
- IRR
- -4.6%
- Equity multiple
- 0.68×
- Total profit
- $-50,937
- Equity at exit
- $49,283
Cash invested: $159,600 (down + closing). Projections, not guarantees.
Landlord ↔ Tenant lean methodology
- Overall (STATE)
- 92 Strongly Landlord-Friendly
- State Arkansas
- 92 Strongly Landlord-Friendly · R+14
- County
- — inherits STATE
- City
- — inherits STATE
ZIP-level market 72712
- Home prices YoY
- -15.5%
- Rents YoY
- 4.4%
- Active inventory
- 745
- Price-to-rent
- 11.0×
Monthly cashflow live
- Estimated rent
- $4,310 high interval (Pro) →
- Mortgage (P&I)
- −$2,989
- Tax from tax record
- −$181 /mo · $2,173/yr
- Insurance
- −$238
- HOA
- −$0
- Vacancy / Maint / Mgmt
- −$905
- Net cashflow
- $-2
Break-even live
Sensitivity live
| Price | -10% $320 | -5% $159 | +0% $-2 | +5% $-164 | +10% $-325 |
|---|---|---|---|---|---|
| Rent | -10% $-343 | -5% $-173 | +0% $-2 | +5% $168 | +10% $338 |
| Rate | -1.0pp $285 | -0.5pp $143 | base $-2 | +0.5pp $-150 | +1.0pp $-300 |
UW: 25.0% down · 7.5% · 30yr · 1.5% tax · 5.0% vac · 8.0% maint · 8.0% mgmt
Financing live
Cash to close
- Down payment
- $142,500
- Closing costs
- $17,100
- Reserves months
- —
- Total cash needed
- —
Loan-product check · same deal, 3 products live
Conventional
25% down · 7.5% · 30yr
- Down + closing
- —
- Monthly P&I
- —
- Monthly cashflow
- —
- DSCR
- —
- Eligible?
- —
Personal DTI + credit; lowest rate.
DSCR
20% down · 8.5% · 30yr
- Down + closing
- —
- Monthly P&I
- —
- Monthly cashflow
- —
- DSCR
- —
- Eligible?
- —
No personal income docs; deal must DSCR.
Hard money
10% down · 12.0% · 12mo
- Down + closing
- —
- Monthly P&I
- —
- Monthly cashflow
- —
- DSCR
- —
- Eligible?
- —
Short-term bridge; refi at stabilization.
Rent comps 28 comps
| Address | Beds | Baths | Sqft | Rent | $/sqft | DOM | Units | Dist |
|---|---|---|---|---|---|---|---|---|
| 705 NW J St Unit 1221874P Bentonville, AR | 4.0 | 3.0 | 2346 | $6,824 | $2.91 | 15d | 1 | 0.46mi |
| 1515 NW Bell Royal Ct Unit 1314699P Bentonville, AR | 4.0 | 2.5 | 2303 | $4,422 | $1.92 | 23d | 1 | 0.52mi |
| 1517 NW Bell Royal Ct Unit 1297037P Bentonville, AR | 4.0 | 2.5 | 2303 | $4,313 | $1.87 | 23d | 1 | 0.52mi |
| 703 NW 10th St Unit 1221918P Bentonville, AR | 3.0 | 2.0 | 1280 | $3,785 | $2.96 | 16d | 1 | 0.58mi |
| 4 Jonquilla Way Unit B Bentonville, AR | 4.0 | 2.5 | 1716 | $1,900 | $1.11 | 25d | 1 | 0.66mi |
| 304 Coachlight Dr Unit 1221882P Bentonville, AR | 4.0 | 2.0 | 1926 | $5,773 | $3.00 | 16d | 1 | 0.74mi |
| 717 NW 6th St Bentonville, AR | 3.0 | 1.5 | 1320 | $1,795 | $1.36 | 16d | 1 | 0.75mi |
| Stonegate Duplexes Bentonville, AR | 3.0 | 2.0 | 1225 | $1,350 | $1.10 | 25d | 2 | 0.82mi |
| 214 NW L St Unit 1363336P Bentonville, AR | 4.0 | 2.0 | 1377 | $3,995 | $2.90 | 23d | 1 | 0.84mi |
| 312 Crestview Dr Unit 1297039P Bentonville, AR | 3.0 | 2.0 | 1291 | $2,402 | $1.86 | 23d | 1 | 0.84mi |
| 1802 NW Mustang Ave Unit 1241310P Bentonville, AR | 4.0 | 3.0 | 1991 | $3,625 | $1.82 | 23d | 1 | 0.87mi |
| 503 NW D St Unit 1363333P Bentonville, AR | 2.0 | 2.5 | 2163 | $5,414 | $2.50 | 15d | 1 | 0.92mi |
| 414 NW Retreat Ln Unit 1221809P Bentonville, AR | 3.0 | 2.5 | 1743 | $6,267 | $3.60 | 16d | 1 | 0.94mi |
| 406 NW Retreat Ln Bentonville, AR | 3.0 | 2.5 | 1750 | $4,400 | $2.51 | 25d | 1 | 0.95mi |
| 2210 Oakwood Ave Bentonville, AR | 2.0 | 2.0 | 1270 | $1,350 | $1.06 | 23d | 1 | 0.95mi |
| 1525 NW Shores Loop Bentonville, AR | 1.0–2.0 | 1.0–2.5 | 1082 | $2,675 | $2.47 | 16d | 13 | 0.97mi |
| 210 NW 9th St Unit 1 Bentonville, AR | 3.0 | 3.5 | 2146 | $4,150 | $1.93 | 25d | 1 | 0.97mi |
| 208 NW 9th St Unit 1 Bentonville, AR | 3.0 | 3.5 | 2147 | $4,150 | $1.93 | 23d | 1 | 0.98mi |
| 107 NW Winfield Ln Bentonville, AR | 3.0 | 2.0 | 2044 | $2,695 | $1.32 | 25d | 1 | 1.04mi |
| 604 NW B St Unit 1221860P Bentonville, AR | 3.0 | 2.0 | 2271 | $8,542 | $3.76 | 23d | 1 | 1.05mi |
| 109 NW Ozark Way Unit 1221875P Bentonville, AR | 4.0 | 3.0 | 2055 | $9,114 | $4.44 | 23d | 1 | 1.05mi |
| 11 Holly Dr Unit B Bentonville, AR | 3.0 | 2.0 | 1300 | $1,700 | $1.31 | 16d | 1 | 1.11mi |
| 649 SW 2nd St Bentonville, AR | 4.0 | 3.0 | 2176 | $4,700 | $2.16 | 25d | 1 | 1.23mi |
| 103 SW E St Unit 1221849P Bentonville, AR | 4.0 | 3.0 | 2454 | $10,431 | $4.25 | 25d | 1 | 1.26mi |
| 342 SW D St Bentonville, AR | 3.0 | 2.5 | 1660 | $1,995 | $1.20 | 25d | 1 | 1.46mi |
| 442 SW Glover St Bentonville, AR | 3.0 | 2.5 | 1893 | $5,000 | $2.64 | 25d | 1 | 1.47mi |
| 501 SW Duke Ave Unit 1221919P Bentonville, AR | 3.0 | 2.0 | 1722 | $4,245 | $2.47 | 16d | 1 | 1.47mi |
| 2318 SW Clover Ct Unit 1221889P Bentonville, AR | 4.0 | 2.5 | 2551 | $8,354 | $3.27 | 23d | 1 | 1.48mi |
Listing history 5 events
-
2026-06-01days on market $570,000 Active 19 DOM
-
2026-05-31days on market $570,000 Active 18 DOM
-
2026-05-31days on market $570,000 Active 17 DOM
-
2026-05-13$570,000 Active
-
1994-06-08soldstatus $100,000
ⓘ Source: listings_history table (triggers on properties + properties_extension) + one-shot
backfill from property_details.listing_events for pre-trigger history.
Tax reassessment forecast AR · Resets to sale price
- Current annual tax
- $2,173 · $181/mo
- Projected year-2 tax
- $3,648 · $304/mo
- Expected delta
- +$1,475/yr (+$123/mo · 67.9%)
ⓘ Screening estimate from a state-policy table — verify with the county assessor before closing.
Climate risk First Street
- Flood 6/10 Major FEMA zone X (unshaded) · 71% chance over 30 yrs
- Wildfire 3/10 Moderate
- Heat 5/10 Major 7 d/yr ≥104°F today · 21 d/yr by 30 yrs out
- Wind 2/10 Low 2% chance of damaging wind over 30 yrs
- Air quality 2/10 Low 1 unhealthy d/yr today · 1 by 30 yrs out
Nearby sold comps map
Loading sold comps map…
Walkable amenities ~0.75 mi
Loading nearby amenities…
Taxation est. · year 1
- Rental income
- $51,725
- − Mortgage interest
- −$31,929
- − Property taxes
- −$2,173
- − Insurance
- −$2,850
- − Repairs & maintenance
- −$4,138
- − Management
- −$4,138
- − Depreciation
- −$16,582
- Taxable loss
- −$10,084
- Est. tax savings @ 24.0%
- +$2,420
- After-tax cash flow
- $2,391/yr
For passive investors: Depreciation is non-cash, so a rental often shows a tax loss while cash-flowing — sheltering income. Rental losses are passive: they offset passive income freely, and up to $25,000/yr can offset ordinary (W-2) income if you actively participate and your MAGI is under $100k (phasing out to $0 by $150k); unused losses carry forward. On sale, claimed depreciation is recaptured at up to 25%, and gains may owe capital-gains tax (a 1031 exchange can defer both). Figures are a year-1 estimate at your 24.0% rate — not tax advice; consult a CPA.
Schools (NCES district)
- District
- Bentonville School District
- NCES district ID
- 0503060
- Math proficiency
- 59% ▼ -8.00%
- Reading proficiency
- 59% ▼ -6.00%
- Median HH income
- $66,721
- Composite
- 51.85/100
- National rank
- #1661
- State rank
- #3 of 238 in AR
Livability — Bentonville
- Score
- 83/100
- State rank
- #2
- US rank
- #864
Category grades
Schools grade is shown separately in the Schools card above.
Census & demographics
- Census place
- Bentonville, AR
- County
- Benton County · 259,241 people
- City population
- 67,689
- Metro
- Fayetteville-Springdale-Rogers, AR
- Population (ZIP)
- 38,690
- Household income
- $110,514
- Rent vs Own
- Severe rent burden
- 932.0
Population outlook (Benton County) Hauer SSP2
- Today (2025)
- 318,683 people
- By 2030
- 353,481 · +10.9%
- By 2040
- 425,280 · +33.4%
- By 2050
- 497,239 · +56.0%
- By 2075
- 662,114 · +107.8%
- By 2100
- 776,431 · +143.6%
Race, ethnicity, and origin ACS 2023
- Neighborhood character
- Diverse neighborhood (Simpson 0.55)
- Race & ethnicity
- White 66% Two or more races 17% Hispanic / Latino 10% Asian 6% Black 4%
- Hispanic origin (detail)
- Mexican 7%
- Common ancestry
- Slovak 3% Italian 2% Lithuanian 2%
- Foreign-born
- 11% · Canada, Vietnam, China
- Languages at home
- 89% English-only · Spanish 6% Other Asian/Pacific 2% Other Indo-European 2%
Political lean MEDSL · Benton
- 2024 margin
- Strong R (+27.0) · D 35.2% · R 62.1% · Other 2.7%
- 2008→2024 swing
- +9.6pp toward D · 2008: -36.5pp · 2024: -27.0pp
- All cycles
- 2024: R+27.0 2020: R+26.4 2016: R+34.9 2012: R+40.4 2008: R+36.5
Not yet ingested
- Civics
- —
Market trends
- HPI YoY
- ▼ -66.76%
- Current HPI
- 365.1641
- Rent YoY
- ▲ 4.39%
- Metro
- Fayetteville-Springdale-Rogers, AR
- State GDP YoY
- ▲ 3.80%
- F500 in state
- 10
Industry mix (Fortune 500 HQ in AR)
| Industry | F500 HQs | Revenue |
|---|---|---|
| Retail | 1 | $681B |
|
||
| Food / Agriculture | 1 | $53B |
|
||
| Retail / Energy | 1 | $22B |
|
||
| Transportation / Logistics | 1 | $12B |
|
||
| Energy | 1 | $4B |
|
||
Price history
+470.0% since first listed2 events — show timeline
- 2026-05-13 Listed $570,000 NWARMLS
- 1994-06-08 Sold (Public Records) $100,000 Public Records
Property tax history
+3.9%/yrLatest (2025): $2,173 · +2.2% YoY. Source: county tax records.
Cash-flow waterfall
monthlySold comps — $/sqft
last 12 mo · ≤1 miLoading sold comps…