 🏗️ New Construction
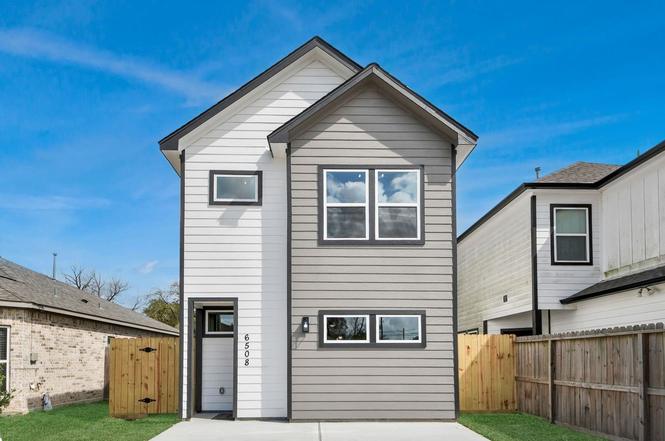
6510 Tuskegee St · Houston, TX
Flood risk 1/10 · Minimal
- FEMA flood zone
- X (unshaded)
- Chance of flooding over 30 yrs
- 0.0%
- Est. flood insurance / yr
- $507 – $1,088
Fire risk 1/10 · Minimal
- Est. fire insurance / yr
- $1,222 – $2,270
Heat risk 9/10 · Severe
- Hot days now (above 109°F)
- 7 days/yr
- Hot days in 30 yrs
- 23 days/yr
Wind risk 9/10 · Severe
- Chance of severe wind over 30 yrs
- 99.0%
Air-quality risk 3/10 · Minor
- Unhealthy air days now
- 3 days/yr
- Unhealthy air days in 30 yrs
- 4 days/yr
Risk factors via First Street. Map © Google.
Why this score? — see what drove the F grade
The composite is a weighted blend of 9 inputs, each scored 0–100. Each bar is that input's sub-score; the figure is the points it added to the 100-point composite (weight × sub-score).
- Cash flow +8.2/30.0
- ARV discount +7.5/15.0
- Condition / age +4.0/5.0
- Livability +3.7/5.0
- Rent growth +3.0/5.0
- Schools +2.7/10.0
- 1% rule +2.5/10.0
- DSCR +2.2/10.0
- Appreciation +0.0/10.0
$197,620
🖨 Deal sheet (PDF) 📄 Offer letter ✓ Due diligence
Listing remarks
Looking for an affordable home with an affordable monthly payment? This beautiful property has it all! Featuring 3 bedrooms and 3 full bathrooms, 9-foot ceilings, and lots of natural light, this home offers comfort and style. One bedroom with a full bath is conveniently located on the first floor (not the primary bedroom), perfect for guests or multi-generational living. Ideally located near freeways, shopping, downtown, and more, this home has everything you’re looking for. Don’t miss out!
Key facts
- 3,001 sq ft lot
- Built 2025
- Listed 35 days
Neighborhood map
What this means for you Summary
Snapshot
- This is a 3-bed/3.0-bath single-family listed at $198k. Condition is rated good.
Deal economics
- At list price, monthly cash flow is $-221 ($-3k/yr) — negative.
- The deal already cash-flows at list — no discount required.
- To meet the 1% rule (rent ≥ 1% of price), the offer needs to be $175k (11.5% below list).
- Recommended offer: $175k (11.5% below list) — sets the bar for 1% rule.
- Cap rate 5.1% vs local median 3.2% in Houston — top-decile yield for the area; either an underpriced asset or a hidden risk that comps aren't pricing in. Stress-test before assuming the spread holds.
Location & tenants
- Location reads 74/100 on livability (#184 in TX, #4,771 nationally) — a middle-class / working-renter tenant base. Strengths: amenities A+, cost of living A+, housing A+; Watch: crime F.
- Houston ISD (urban): math 27% / reading 35% proficiency, ranked #593 of 826 in TX (top 72%) — families likely to look elsewhere, expect single-tenant / working-renter base with shorter leases; 71% free/reduced lunch — lower-income household profile, screen leases tightly.
- Zoned schools: Highland Hts El (math 17% / reading 22%, grade F, #3,583 of 4,322 statewide, top 86%, 450 students, 98% FRL); Williams Middle (math 9% / reading 15%, grade F, #1,623 of 1,662 statewide, top 98%, 411 students, 98% FRL); Washington B T H S (math 27% / reading 25%, grade F, #1,234 of 1,632 statewide, top 76%, 878 students, 96% FRL) — zoned schools average 97% FRL vs 71% district-wide (26 pts higher); higher-poverty schools than district average — tighter screening recommended.
- Market conditions: Rents rising (+2.1%/yr); 680 active listings in the ZIP; 37 comparable units currently listed for rent nearby; rentals lingering (median 46d on market — plan ~5-8 weeks vacancy on turnover, expect pricing pressure); 51% of comp listings sitting > 30 days — soft ceiling on asking rent; lower-income renter base — watch delinquency; 29,883 units permitted in Harris County in 2024 (8,621 in 5+ unit buildings).
- At $1,749/mo this rent would consume 59% of the median local household income ($35k/yr) (locally 3210% of renters already pay >50% of income on rent) — very limited rent-growth headroom before tenants either downsize or default.
Forward outlook
- Local home prices are declining (-3.0%/yr); year-one equity from $2k of loan paydown is wiped out by about $7k of value loss. Plan a longer hold.
- Harris County population projected at +47% by 2050 — long-run rental-demand tailwind backs the buy-and-hold thesis.
Negotiation context
- It's been on market 35 days — a 3% lower offer ($192k) is reasonable based on typical stale-listing flexibility.
Risks & watch-outs
- Climate carrying-cost: severe wind risk, 99% chance of damaging wind over 30y; extreme-heat days projected 7→23/yr by 2055 (HVAC capex compounding) — expect insurance premiums to compound above CPI over the hold.
Questions for the listing agent
- What do current leases actually rent for vs. the listed asking? Can we see a recent rent roll and the last 12 months of T-12 income?
- It's been on market 35 days. Have you received any prior offers? Is the seller open to a 12% concession, seller financing, or rate buy-down credit?
- Is there a deadline driving the sale (1031 exchange, divorce, estate, relocation)? That informs how much negotiation room exists.
- Schools are D-rated, which usually means shorter tenancies and higher turnover. Who's the typical renter profile here, and what's been the actual vacancy rate?
- Crime grade is F in this area — have there been break-ins, vandalism, or insurance claims at this property in the last 3 years? What carrier currently insures it and at what premium?
- The area grade is low — what's the realistic commute time and amenity access for the typical tenant pool here? Any planned neighborhood developments (good or bad) we should know about?
- What's the average days-on-market for RENTAL listings here right now (not sales)? A rising rental-DOM trend means longer vacancies and softer asking-rent achievability than the comps imply.
- What's the recent tenant-quality profile in this submarket — average credit score on applications, eviction rate, late-payment / NSF rate, and stable-employment percentage? A property-management company in the area should have these aggregated.
- How much new for-sale + rental construction is in the pipeline within 1–3 miles? Heavy new supply typically softens prices + rents 12–24 months out; constrained supply supports both.
Investment metrics
- 1% rule
- 0.75% ✗
- Cap rate
- 5.15%
- Cash-on-cash
- -4.09%
- DSCR
- 0.82
- GRM
- 11.1
CMA / ARV
- ARV (on-the-fly)
- $231,903
- Comps found
- 12
Show comp detail 12 sales within ~0.75 mi
| Address | Dist | Beds/Ba | Sqft | Sold | Price | $/sf | Match |
|---|---|---|---|---|---|---|---|
| 6519 Arabella St | 0.06mi | 3/1.0 | 1,206 (-2%) | 14mo | $150,000 | $124 | 75 |
| 6827 Tuskegee | 0.33mi | 3/2.0 | 1,188 (-3%) | 8mo | $225,000 | $189 | 69 |
| 862 Rachel St | 0.39mi | 3/2.0 | 1,298 (+6%) | 4mo | $275,900 | $213 | 65 |
| 6828 Knox St | 0.38mi | 3/1.5 | 1,177 (-4%) | 8mo | $240,000 | $204 | 63 |
| 1315 Wilburforce St | 0.37mi | 2/1.0 (-1) | 1,232 (+0%) | 10mo | $396,000 | $321 | 60 |
| 6525 Sealey St | 0.67mi | 3/1.0 | 1,236 (+1%) | 4mo | $110,000 | $89 | 56 |
| 1055 Wheatley Oak Ln | 0.42mi | 3/2.5 | 1,384 (+13%) | 4mo | $299,990 | $217 | 53 |
| 6706 Tippett St | 0.57mi | 4/2.0 (+1) | 1,194 (-3%) | 9mo | $133,000 | $111 | 52 |
| 6538 Wheatley St Unit A | 0.20mi | 3/2.5 | 1,043 (-15%) | 15mo | $209,900 | $201 | 51 |
| 774 Green Meadow Ln | 0.74mi | 3/2.0 | 1,296 (+6%) | 14mo | $195,000 | $150 | 40 |
| 885 W Little York Rd | 0.61mi | 3/1.5 | 1,344 (+10%) | 12mo | $155,000 | $115 | 39 |
| 797 Millville Dr | 0.67mi | 3/2.0 | 1,348 (+10%) | 13mo | $249,900 | $185 | 37 |
Match score weights: distance 35% · size 25% · config 20% · recency 20%. Top-matched comps best support the ARV.
Projected returns pro-forma
-3.0% appreciation · 2.1% rent growth · sell at horizon
- IRR
- -24.2%
- Equity multiple
- 0.18×
- Total profit
- $-53,203
- Equity at exit
- $34,577
- IRR
- -22.1%
- Equity multiple
- -0.09×
- Total profit
- $-70,677
- Equity at exit
- $20,051
Cash invested: $64,933 (down + closing). Projections, not guarantees.
Landlord ↔ Tenant lean methodology
- Overall (STATE)
- 87 Strongly Landlord-Friendly
- State Texas
- 87 Strongly Landlord-Friendly · R+5
- County
- — inherits STATE
- City
- — inherits STATE
ZIP-level market 77091
- Home prices YoY
- -24.9%
- Rents YoY
- 2.1%
- Active inventory
- 680
- Price-to-rent
- 9.4×
Monthly cashflow live
- Estimated rent
- $1,749 high interval (Pro) →
- Mortgage (P&I)
- −$1,216
- Tax est. 1.5%
- −$290 /mo · $3,479/yr
- Insurance
- −$97
- HOA
- −$0
- Vacancy / Maint / Mgmt
- −$367
- Net cashflow
- $-221
Break-even live
Sensitivity live
| Price | -10% $-61 | -5% $-141 | +0% $-221 | +5% $-301 | +10% $-381 |
|---|---|---|---|---|---|
| Rent | -10% $-359 | -5% $-290 | +0% $-221 | +5% $-152 | +10% $-83 |
| Rate | -1.0pp $-104 | -0.5pp $-162 | base $-221 | +0.5pp $-281 | +1.0pp $-342 |
UW: 25.0% down · 7.5% · 30yr · 1.5% tax · 5.0% vac · 8.0% maint · 8.0% mgmt
Financing live
Cash to close
- Down payment
- $57,976
- Closing costs
- $6,957
- Reserves months
- —
- Total cash needed
- —
Loan-product check · same deal, 3 products live
Conventional
25% down · 7.5% · 30yr
- Down + closing
- —
- Monthly P&I
- —
- Monthly cashflow
- —
- DSCR
- —
- Eligible?
- —
Personal DTI + credit; lowest rate.
DSCR
20% down · 8.5% · 30yr
- Down + closing
- —
- Monthly P&I
- —
- Monthly cashflow
- —
- DSCR
- —
- Eligible?
- —
No personal income docs; deal must DSCR.
Hard money
10% down · 12.0% · 12mo
- Down + closing
- —
- Monthly P&I
- —
- Monthly cashflow
- —
- DSCR
- —
- Eligible?
- —
Short-term bridge; refi at stabilization.
Rent comps 37 comps
| Address | Beds | Baths | Sqft | Rent | $/sqft | DOM | Units | Dist |
|---|---|---|---|---|---|---|---|---|
| 833 Paul Quinn St Unit A Houston, TX | 3.0 | 2.5 | 1226 | $1,800 | $1.47 | 45d | 1 | 0.69mi |
| 831 Paul Quinn St Unit B Houston, TX | 3.0 | 2.5 | 1226 | $1,800 | $1.47 | 26d | 1 | 0.69mi |
| 5722 # E Unit Beall St unit Houston, TX | 3.0 | 2.5 | 1474 | $2,011 | $1.36 | 45d | 1 | 0.75mi |
| 5720 Beall St Unit C Houston, TX | 3.0 | 2.5 | 1474 | $2,006 | $1.36 | 45d | 1 | 0.76mi |
| 1200 W Tidwell Rd Houston, TX | 2.0–3.0 | 1.0–2.0 | 938 | $1,295 | $1.38 | 1d | 11 | 0.77mi |
| 1825 W Little York Rd Houston, TX | 2.0 | 1.0 | 787 | $880 | $1.12 | 45d | 1 | 0.85mi |
| 714 W Tidwell Rd Houston, TX | 2.0 | 1.0 | 1296 | $1,094 | $0.84 | 45d | 1 | 1.06mi |
| 1010 Junell St Unit A Houston, TX | 3.0 | 2.0 | 1040 | $1,550 | $1.49 | 26d | 1 | 1.09mi |
| 7486 N Shepherd Dr Houston, TX | 3.0 | 2.0 | 1177 | $1,290 | $1.10 | 45d | 1 | 1.12mi |
| 1007 Pinemont Dr Houston, TX | 2.0 | 2.0 | 985 | $1,774 | $1.80 | 45d | 1 | 1.18mi |
| 783 Fortune St Unit A Houston, TX | 3.0 | 2.5 | 1328 | $1,795 | $1.35 | 18d | 1 | 1.20mi |
| 1001 Pinemont Dr Unit 2165 Houston, TX | 2.0 | 2.0 | 1155 | $1,414 | $1.22 | 0d | 1 | 1.24mi |
| 1001 Pinemont Dr Unit 1058 Houston, TX | 2.0 | 2.0 | 1155 | $1,414 | $1.22 | 45d | 1 | 1.24mi |
| 1001 Pinemont Dr Unit 1038 Houston, TX | 2.0 | 2.0 | 1155 | $1,413 | $1.22 | 12d | 1 | 1.24mi |
| 1001 Pinemont Dr Unit 422 Houston, TX | 2.0 | 2.0 | 1155 | $1,389 | $1.20 | 9d | 1 | 1.24mi |
| 1001 Pinemont Dr Unit 2112 Houston, TX | 2.0 | 2.0 | 1155 | $1,373 | $1.19 | 0d | 1 | 1.24mi |
| 1001 Pinemont Dr Unit 96 Houston, TX | 2.0 | 2.0 | 1155 | $1,599 | $1.38 | 45d | 1 | 1.24mi |
| 8108 De Priest St Unit B Houston, TX | 3.0 | 2.5 | 1500 | $1,900 | $1.27 | 45d | 1 | 1.26mi |
| 8110 De Priest St Unit A Houston, TX | 3.0 | 2.5 | 1500 | $1,900 | $1.27 | 45d | 1 | 1.26mi |
| 8112 De Priest St Unit B Houston, TX | 3.0 | 2.5 | 1500 | $1,750 | $1.17 | 1d | 1 | 1.27mi |
| 929 Marjorie St Unit 1060806P Houston, TX | 3.0 | 2.0 | 1076 | $3,091 | $2.87 | 9d | 1 | 1.28mi |
| 8120 De Priest St Unit A Houston, TX | 3.0 | 2.5 | 1500 | $1,750 | $1.17 | 45d | 1 | 1.30mi |
| 8120 De Priest St Unit B Houston, TX | 3.0 | 2.5 | 1500 | $1,900 | $1.27 | 45d | 1 | 1.30mi |
| 8118 De Priest St Unit B Houston, TX | 3.0 | 2.5 | 1500 | $1,900 | $1.27 | 45d | 1 | 1.30mi |
| 8122 De Priest St Unit A Houston, TX | 3.0 | 3.5 | 1500 | $1,900 | $1.27 | 45d | 1 | 1.30mi |
| 312 W Sunnyside St Houston, TX | 2.0 | 1.0 | 894 | $1,001 | $1.12 | 45d | 1 | 1.33mi |
| 8306 De Priest St Unit A Houston, TX | 3.0 | 2.5 | 1500 | $1,900 | $1.27 | 22d | 1 | 1.33mi |
| 8310 De Priest St Unit B Houston, TX | 3.0 | 2.5 | 1500 | $1,900 | $1.27 | 22d | 1 | 1.34mi |
| 5121 Royal Heath Dr Houston, TX | 3.0 | 2.5 | 1435 | $2,215 | $1.54 | 0d | 1 | 1.34mi |
| 8312 De Priest St Unit A Houston, TX | 3.0 | 2.5 | 1500 | $1,900 | $1.27 | 22d | 1 | 1.35mi |
| 8312 De Priest St Unit B Houston, TX | 3.0 | 3.5 | 1500 | $1,900 | $1.27 | 22d | 1 | 1.35mi |
| 2602 Dalview St Unit B Houston, TX | 2.0 | 1.0 | 800 | $1,400 | $1.75 | 45d | 1 | 1.47mi |
| 301 W Little York Rd Unit 1722 Houston, TX | 2.0 | 2.0 | 1322 | $1,230 | $0.93 | 22d | 1 | 1.47mi |
| 603 W Donovan St Houston, TX | 3.0 | 1.0 | 948 | $1,250 | $1.32 | 45d | 1 | 1.48mi |
| 603 W Donovan St Houston, TX | 3.0 | 1.0 | 948 | $1,250 | $1.32 | 24d | 1 | 1.48mi |
| 603 W Donovan St Houston, TX | 2.0 | 1.0 | 828 | $1,069 | $1.29 | 26d | 1 | 1.48mi |
| 1464 Ferguson Way Houston, TX | 2.0 | 3.0 | 850 | $1,850 | $2.18 | 45d | 1 | 1.50mi |
Listing history 2 events
-
2026-04-14status Pending
-
2026-03-09$197,620 Active
ⓘ Source: listings_history table (triggers on properties + properties_extension) + one-shot
backfill from property_details.listing_events for pre-trigger history.
Climate risk First Street
- Flood 1/10 Low FEMA zone X (unshaded) · 0% chance over 30 yrs
- Wildfire 1/10 Low
- Heat 9/10 Extreme 7 d/yr ≥109°F today · 23 d/yr by 30 yrs out
- Wind 9/10 Extreme 99% chance of damaging wind over 30 yrs
- Air quality 3/10 Moderate 3 unhealthy d/yr today · 4 by 30 yrs out
Nearby sold comps map
Loading sold comps map…
Walkable amenities ~0.75 mi
Loading nearby amenities…
Taxation est. · year 1
- Rental income
- $20,985
- − Mortgage interest
- −$12,990
- − Property taxes
- −$3,479
- − Insurance
- −$1,160
- − Repairs & maintenance
- −$1,679
- − Management
- −$1,679
- − Depreciation
- −$6,746
- Taxable loss
- −$6,747
- Est. tax savings @ 24.0%
- +$1,619
- After-tax cash flow
- $-1,034/yr
For passive investors: Depreciation is non-cash, so a rental often shows a tax loss while cash-flowing — sheltering income. Rental losses are passive: they offset passive income freely, and up to $25,000/yr can offset ordinary (W-2) income if you actively participate and your MAGI is under $100k (phasing out to $0 by $150k); unused losses carry forward. On sale, claimed depreciation is recaptured at up to 25%, and gains may owe capital-gains tax (a 1031 exchange can defer both). Figures are a year-1 estimate at your 24.0% rate — not tax advice; consult a CPA.
Condition & rehab AI · 13 photos
This single-family home is in good condition with modern finishes and a well-maintained exterior. It offers a good balance of curb appeal and interior updates, making it an attractive option for both resale and rental.
Value-add opportunities
- Both Painting the exterior siding — Fresh paint can enhance curb appeal and property value
- Both Landscaping the front yard — A well-maintained front yard can improve curb appeal and property value
- Resale Updating the kitchen backsplash — A fresh backsplash can enhance the kitchen's aesthetic and appeal to potential buyers
- Both Adding smart home features — Smart home features can increase convenience and appeal to potential buyers
Renovation cost estimate screening
Value-add ROI direction
- Both Painting the exterior siding — Fresh paint can enhance curb appeal and property value ↑
- Both Landscaping the front yard — A well-maintained front yard can improve curb appeal and property value ↑
- Resale Updating the kitchen backsplash — A fresh backsplash can enhance the kitchen's aesthetic and appeal to potential buyers ↑
- Both Adding smart home features — Smart home features can increase convenience and appeal to potential buyers ↑
ⓘ Cost ranges are severity-bucket heuristics (US national rule-of-thumb). Get contractor quotes + a written scope before underwriting a rehab budget.
Schools (NCES district)
- District
- Houston ISD
- NCES district ID
- 4823640
- Math proficiency
- 27% ▼ -18.00%
- Reading proficiency
- 35% ▼ -6.00%
- Median HH income
- $46,054
- Composite
- 26.63/100
- National rank
- #7173
- State rank
- #593 of 826 in TX
Livability — Houston
- Score
- 74/100
- State rank
- #184
- US rank
- #4771
Category grades
Schools grade is shown separately in the Schools card above.
Census & demographics
- Census place
- Houston, TX
- County
- Harris County · 4,702,590 people
- City population
- 3,226,434
- Metro
- Houston-The Woodlands-Sugar Land, TX
- Population (ZIP)
- 28,728
- Household income
- $35,432
- Rent vs Own
- Severe rent burden
- 3210.0
Population outlook (Harris County) Hauer SSP2
- Today (2025)
- 5,571,493 people
- By 2030
- 6,089,821 · +9.3%
- By 2040
- 7,142,806 · +28.2%
- By 2050
- 8,185,864 · +46.9%
- By 2075
- 10,574,329 · +89.8%
- By 2100
- 12,109,958 · +117.4%
Race, ethnicity, and origin ACS 2023
- Neighborhood character
- Diverse neighborhood (Simpson 0.58)
- Race & ethnicity
- Hispanic / Latino 46% Black 45% Two or more races 15% White 7%
- Hispanic origin (detail)
- Mexican 29%
- Common ancestry
- Italian 1%
- Foreign-born
- 24% · Canada, Jamaica
- Languages at home
- 55% English-only · Spanish 41% French/Haitian/Cajun 2%
Political lean MEDSL · Harris
- 2024 margin
- Lean D (+5.5) · D 52.0% · R 46.4% · Other 1.6%
- 2008→2024 swing
- +3.9pp toward D · 2008: 1.6pp · 2024: 5.5pp
- All cycles
- 2024: D+5.5 2020: D+13.3 2016: D+12.4 2012: D+0.1 2008: D+1.6
Not yet ingested
- Civics
- —
Market trends
- HPI YoY
- ▼ -94.19%
- Current HPI
- 283.7523
- Rent YoY
- ▲ 2.10%
- Metro
- Houston-The Woodlands-Sugar Land, TX
- State GDP YoY
- ▲ 3.95%
- F500 in state
- 110
Industry mix (Fortune 500 HQ in TX)
| Industry | F500 HQs | Revenue |
|---|---|---|
| Energy | 16 | $1,198B |
|
||
| Technology | 5 | $198B |
|
||
| Engineering / Construction | 4 | $72B |
|
||
| Energy Services | 3 | $60B |
|
||
| Utilities | 3 | $41B |
|
||
| Healthcare | 2 | $330B |
|
||
Price history
2 events — show timeline
- 2026-04-14 Pending — HARMLS
- 2026-03-09 Listed $197,620 HARMLS
Cash-flow waterfall
monthlySold comps — $/sqft
last 12 mo · ≤1 miLoading sold comps…