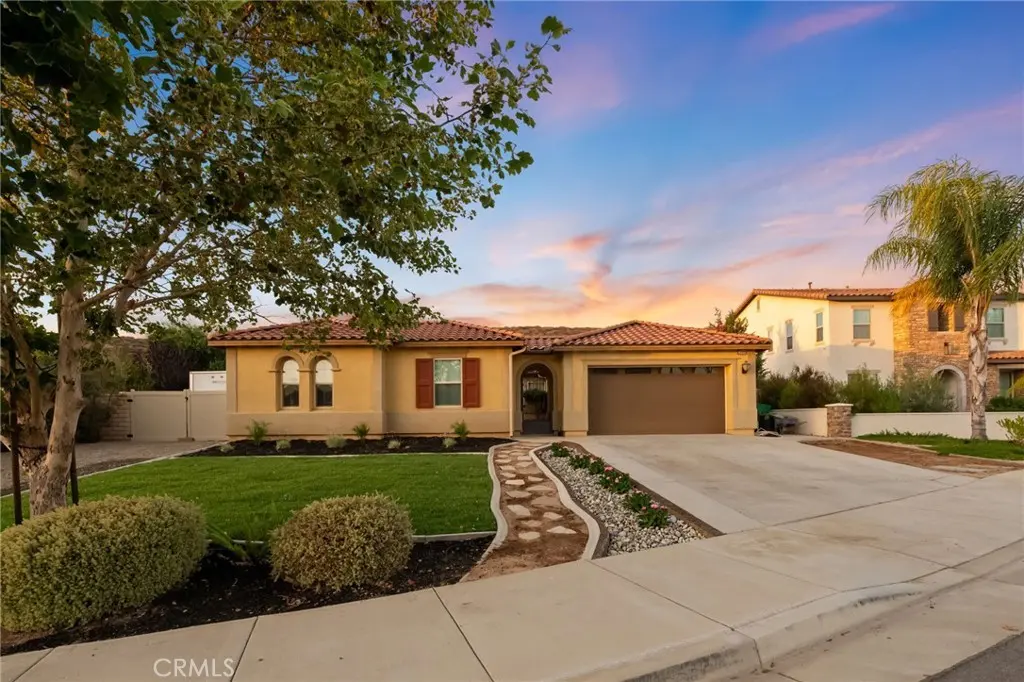
32696 Cougar Pass Ct · French Valley, CA
Flood risk 1/10 · Minimal
- FEMA flood zone
- D
- Chance of flooding over 30 yrs
- 0.0%
- Est. flood insurance / yr
- $544 – $1,084
Fire risk 7/10 · Major
- Est. fire insurance / yr
- $659 – $1,223
Heat risk 7/10 · Major
- Hot days now (above 104°F)
- 7 days/yr
- Hot days in 30 yrs
- 21 days/yr
Wind risk 1/10 · Minimal
- Chance of severe wind over 30 yrs
- —
Air-quality risk 4/10 · Minor
- Unhealthy air days now
- 6 days/yr
- Unhealthy air days in 30 yrs
- 7 days/yr
Risk factors via First Street. Map © Google.
Why this score? — see what drove the D- grade
The composite is a weighted blend of 9 inputs, each scored 0–100. Each bar is that input's sub-score; the figure is the points it added to the 100-point composite (weight × sub-score).
- Appreciation +10.0/10.0
- Cash flow +6.9/30.0
- Schools +5.7/10.0
- ARV discount +4.2/15.0
- Livability +3.0/5.0
- Condition / age +2.5/5.0
- Rent growth +2.3/5.0
- 1% rule +1.4/10.0
- DSCR +1.1/10.0
$939,000
🖨 Deal sheet (PDF) 📄 Offer letter ✓ Due diligence
Listing remarks MLS
A charming courtyard at the entry connects the outdoors to the modern interior of the single-story floor plan. The kitchen features a stainless steel appliance package, oversized culinary island with seating, granite countertops, walk-in pantry and abundant maple cabinetry. A large Great Room serves as the central gathering space and easily connects to the formal dining room and casual dining area. The master bedroom suite offers a spa-quality bath with soaking tub, separate enclosed shower and spacious walk-in closets.
Key facts
- Rv parking
- Spa
- Premium lot
Tags
Property features AI
Finance
- Other: Exclusions: garage refrigerator and separate freezer
- Financial info: Special assessments
- HOA & community: Part of an association (Walters management); Monthly association fee of $50; Association amenities include playground, barbecue/outdoor cooking area and picnic area; Community features include curbs, biking and a park
Exterior
- Parking: Attached 3-car garage; RV access/parking; 3 total parking spaces
- Utilities: 220V in garage; Electricity on property; Public sewer; District/public water; Cable available
- Home design: Attached property in a planned development; Single-story home; Main floor entry
- Construction: Concrete slab foundation
- Exterior features: House; Covered concrete patio; In-ground private heated pool with pebble finish, waterfall and tile; Patio home; Landscaped; Has view; Vinyl, brick wall and wrought iron fencing
Interior
- Kitchen: Garbage disposal; Microwave; Built-in range; Gas range; Double oven; Ice maker; Tankless water heater; Remodeled kitchen; Formal dining area and eating area in kitchen
- Bedrooms: Primary bedroom; Primary suite; Main floor primary bedroom; Main floor bedrooms (4 on main level)
- Flooring: Carpet; Laminate
- Bathrooms: 2 full bathrooms; 1 half bathroom; Double sinks in master bath
- Heating & cooling: Central heating (furnace); Central air conditioning; Whole house fan
- Interior features: Quartz counters; Block walls; Built-ins; Ceiling fans; Pantry; Recessed lighting; Open floor plan; Kitchen open to family room; Pots & pan drawers; Kitchen island; Soaking tub; Walk-in shower; Double sinks in bath(s); Bathtub; Shower; Has fireplace (gas, in living room); Whole house fan; Central cooling; Central furnace; One level (main floor entry)
- Laundry & utility: Has laundry; Gas dryer hookup
Neighborhood map
What this means for you Summary
Snapshot
- This is a 4-bed/2.5-bath single-family listed at $939k.
Deal economics
- At list price, monthly cash flow is $-1k ($-17k/yr) — negative.
- To cash-flow at today's rent, offer at most $691k (26.4% below list).
- To meet the 1% rule (rent ≥ 1% of price), the offer needs to be $596k (36.5% below list).
- Recommended offer: $596k (36.5% below list) — sets the bar for 1% rule.
- Cap rate 4.5% vs local median 3.5% in French Valley — meaningfully above typical; check what's discounted (condition, days-on-market, listing class) to confirm the premium yield is real.
Location & tenants
- Location reads 59/100 on livability (#655 in CA) — a working-class tenant base; expect higher turnover. Strengths: employment A+, housing A+; Watch: crime D-, amenities F, commute F.
- Temecula Valley Unified (urban): math 55% / reading 69% proficiency, ranked #173 of 1,400 in CA (top 12%) — acceptable for families but not a draw, mixed tenant base, ~2y average lease; only 17% free/reduced lunch — higher-income household profile.
- Zoned schools: Susan La Vorgna Elementary (810 students, 27% FRL); Bella Vista Middle (1,396 students, 26% FRL); Chaparral High (3,030 students, 27% FRL).
- Market conditions: Rents soft (-0.8%/yr); 353 active listings in the ZIP; 8 comparable units currently listed for rent nearby; rentals lingering (median 46d on market — plan ~5-8 weeks vacancy on turnover, expect pricing pressure); 50% of comp listings sitting > 30 days — soft ceiling on asking rent; high-income renter base; 9,195 units permitted in Riverside County in 2024 (1,512 in 5+ unit buildings).
- At $5,965/mo this rent would consume 54% of the median local household income ($133k/yr) (locally 591% of renters already pay >50% of income on rent) — very limited rent-growth headroom before tenants either downsize or default.
Forward outlook
- In year one you build about $100k of equity ($6k loan paydown + $94k appreciation (10.0% local appreciation)).
- Riverside County population projected at +22% by 2050 — long-run rental-demand tailwind backs the buy-and-hold thesis.
- By year 2, paydown + projected appreciation supports a ~$161k cash-out refi (75% LTV) — recoverable capital for the next deal without selling this one.
Negotiation context
- Only 12 days on market — expect competitive offers; lowballing is unlikely to land.
- 2 sale attempts since 9y ago with the ask held roughly flat each time — persistent listings suggest the price (not the market) is what's stuck; bring a comps-based counter.
- Current owner paid $491k; list at $939k implies a 91% gain — meaningful room to come down on a strong offer.
Risks & watch-outs
- Climate carrying-cost: major wildfire risk; extreme-heat days projected 7→21/yr by 2055 (HVAC capex compounding) — expect insurance premiums to compound above CPI over the hold.
Questions for the listing agent
- What do current leases actually rent for vs. the listed asking? Can we see a recent rent roll and the last 12 months of T-12 income?
- What does the HOA fee cover, when was the last increase, and are there any pending special assessments or reserve-fund shortfalls?
- Is there a deadline driving the sale (1031 exchange, divorce, estate, relocation)? That informs how much negotiation room exists.
- Schools are D-rated, which usually means shorter tenancies and higher turnover. Who's the typical renter profile here, and what's been the actual vacancy rate?
- Crime grade is D in this area — have there been break-ins, vandalism, or insurance claims at this property in the last 3 years? What carrier currently insures it and at what premium?
- The area grade is low — what's the realistic commute time and amenity access for the typical tenant pool here? Any planned neighborhood developments (good or bad) we should know about?
- What's the average days-on-market for RENTAL listings here right now (not sales)? A rising rental-DOM trend means longer vacancies and softer asking-rent achievability than the comps imply.
- What's the recent tenant-quality profile in this submarket — average credit score on applications, eviction rate, late-payment / NSF rate, and stable-employment percentage? A property-management company in the area should have these aggregated.
- How much new for-sale + rental construction is in the pipeline within 1–3 miles? Heavy new supply typically softens prices + rents 12–24 months out; constrained supply supports both.
Investment metrics
- 1% rule
- 0.64% ✗
- Cap rate
- 4.50%
- Cash-on-cash
- -6.41%
- DSCR
- 0.71
- GRM
- 13.1
CMA / ARV
- ARV (on-the-fly)
- $875,609
- Comps found
- 12
Show comp detail 12 sales within ~0.75 mi
| Address | Dist | Beds/Ba | Sqft | Sold | Price | $/sf | Match |
|---|---|---|---|---|---|---|---|
| 32743 Cherokee Rose | 0.23mi | 4/2.5 | 2,909 (0%) | 0mo | $910,000 | $313 | 89 |
| 35421 Birchbrook | 0.20mi | 3/2.5 (-1) | 2,909 (0%) | 3mo | $939,000 | $323 | 83 |
| 32507 Shadyview St | 0.43mi | 4/2.5 | 3,073 (+6%) | 2mo | $924,900 | $301 | 68 |
| 32502 Cherokee Rose St | 0.25mi | 3/2.5 (-1) | 2,560 (-12%) | 0mo | $815,000 | $318 | 63 |
| 32101 Daisy Dr | 0.57mi | 4/3.0 | 2,740 (-6%) | 1mo | $715,000 | $261 | 61 |
| 32143 Daisy Dr | 0.56mi | 4/3.0 | 2,740 (-6%) | 2mo | $825,000 | $301 | 60 |
| 33041 Cuvee Ct | 0.35mi | 4/4.0 | 2,641 (-9%) | 3mo | $826,000 | $313 | 60 |
| 32585 Presidio Hls | 0.43mi | 4/3.0 | 3,213 (+10%) | 3mo | $800,000 | $249 | 58 |
| 32684 Salvia Cir | 0.61mi | 4/2.5 | 3,157 (+8%) | 0mo | $750,000 | $238 | 57 |
| 32224 Geranium St | 0.54mi | 4/2.5 | 2,596 (-11%) | 0mo | $700,000 | $270 | 56 |
| 32526 Presidio Hls | 0.49mi | 5/3.0 (+1) | 3,213 (+10%) | 2mo | $785,000 | $244 | 51 |
| 32185 Bandelier | 0.72mi | 4/3.5 | 2,712 (-7%) | 3mo | $722,000 | $266 | 49 |
Match score weights: distance 35% · size 25% · config 20% · recency 20%. Top-matched comps best support the ARV.
Projected returns pro-forma
10.0% appreciation · 0.0% rent growth · sell at horizon
- IRR
- 19.0%
- Equity multiple
- 2.54×
- Total profit
- $404,345
- Equity at exit
- $845,926
- IRR
- 17.1%
- Equity multiple
- 5.68×
- Total profit
- $1,229,488
- Equity at exit
- $1,824,270
Cash invested: $262,920 (down + closing). Projections, not guarantees.
Landlord ↔ Tenant lean methodology
- Overall (STATE)
- 18 Strongly Tenant-Friendly
- State California
- 18 Strongly Tenant-Friendly · D+13
- County
- — inherits STATE
- City
- — inherits STATE
ZIP-level market 92596
- Home prices YoY
- 3.9%
- Rents YoY
- -0.8%
- Active inventory
- 353
- Price-to-rent
- 13.1×
Monthly cashflow live
- Estimated rent
- $5,965 high interval (Pro) →
- Mortgage (P&I)
- −$4,924
- Tax from tax record
- −$751 /mo · $9,011/yr
- Insurance
- −$391
- HOA
- −$50
- Vacancy / Maint / Mgmt
- −$1,253
- Net cashflow
- $-1,404
Break-even live
Sensitivity live
| Price | -10% $-873 | -5% $-1,139 | +0% $-1,404 | +5% $-1,670 | +10% $-1,936 |
|---|---|---|---|---|---|
| Rent | -10% $-1,876 | -5% $-1,640 | +0% $-1,404 | +5% $-1,169 | +10% $-933 |
| Rate | -1.0pp $-931 | -0.5pp $-1,165 | base $-1,404 | +0.5pp $-1,648 | +1.0pp $-1,895 |
UW: 25.0% down · 7.5% · 30yr · 1.5% tax · 5.0% vac · 8.0% maint · 8.0% mgmt
Financing live
Cash to close
- Down payment
- $234,750
- Closing costs
- $28,170
- Reserves months
- —
- Total cash needed
- —
Loan-product check · same deal, 3 products live
Conventional
25% down · 7.5% · 30yr
- Down + closing
- —
- Monthly P&I
- —
- Monthly cashflow
- —
- DSCR
- —
- Eligible?
- —
Personal DTI + credit; lowest rate.
DSCR
20% down · 8.5% · 30yr
- Down + closing
- —
- Monthly P&I
- —
- Monthly cashflow
- —
- DSCR
- —
- Eligible?
- —
No personal income docs; deal must DSCR.
Hard money
10% down · 12.0% · 12mo
- Down + closing
- —
- Monthly P&I
- —
- Monthly cashflow
- —
- DSCR
- —
- Eligible?
- —
Short-term bridge; refi at stabilization.
Rent comps 8 comps
| Address | Beds | Baths | Sqft | Rent | $/sqft | DOM | Units | Dist |
|---|---|---|---|---|---|---|---|---|
| 32640 Cougar Pass Ct Winchester, CA | 4.0 | 3.5 | 3800 | $8,600 | $2.26 | 45d | 1 | 0.09mi |
| 32689 Cottonwood Rd Winchester, CA | 4.0 | 2.5 | 3157 | $4,100 | $1.30 | 45d | 1 | 0.53mi |
| 34629 Foxberry Rd Winchester, CA | 5.0 | 5.5 | 3887 | $4,179 | $1.08 | 4d | 1 | 0.65mi |
| 34580 Sourwood Way Winchester, CA | 4.0 | 3.0 | 2800 | $3,200 | $1.14 | 45d | 1 | 0.76mi |
| 36395 Pistachio Dr Winchester, CA | 5.0 | 4.0 | 4020 | $4,500 | $1.12 | 45d | 1 | 1.12mi |
| 32907 Cambury Pl Winchester, CA | 5.0 | 4.0 | 2641 | $3,795 | $1.44 | 0d | 1 | 1.14mi |
| 35350 Marabella Ct Unit 35350 Winchester, CA | 3.0 | 2.5 | 1925 | $3,300 | $1.71 | 0d | 1 | 1.20mi |
| 36264 Capri Dr Winchester, CA | 4.0 | 2.5 | 1999 | $3,300 | $1.65 | 20d | 1 | 1.48mi |
HOA detail
- Monthly dues
- $50 · $600/yr
Listing history 8 events
-
2026-06-21days on market $939,000 Active 12 DOM
-
2026-06-18days on market $939,000 Active 9 DOM
-
2026-06-17days on market $939,000 Active 8 DOM
-
2026-06-16days on market $939,000 Active 7 DOM
-
2026-06-15days on market $939,000 Active 6 DOM
-
2026-06-13days on market $939,000 Active 4 DOM
-
2026-06-10remarks 699-char remark
-
2026-06-10$939,000 Active 1 DOM
ⓘ Source: listings_history table (triggers on properties + properties_extension) + one-shot
backfill from property_details.listing_events for pre-trigger history.
Tax reassessment forecast CA · Resets to sale price
- Current annual tax
- $9,011 · $751/mo
- Projected year-2 tax
- $9,011 · $751/mo
- Expected delta
- $0/yr ($0/mo · 0.0%)
ⓘ Screening estimate from a state-policy table — verify with the county assessor before closing.
Climate risk First Street
- Flood 1/10 Low FEMA zone D · 0% chance over 30 yrs
- Wildfire 7/10 Severe
- Heat 7/10 Severe 7 d/yr ≥104°F today · 21 d/yr by 30 yrs out
- Wind 1/10 Low
- Air quality 4/10 Moderate 6 unhealthy d/yr today · 7 by 30 yrs out
Nearby sold comps map
Loading sold comps map…
Walkable amenities ~0.75 mi
Loading nearby amenities…
Taxation est. · year 1
- Rental income
- $71,577
- − Mortgage interest
- −$52,599
- − Property taxes
- −$9,011
- − Insurance
- −$4,695
- − Repairs & maintenance
- −$5,726
- − Management
- −$5,726
- − HOA
- −$600
- − Depreciation
- −$27,316
- Taxable loss
- −$34,097
- Est. tax savings @ 24.0%
- +$8,183
- After-tax cash flow
- $-8,668/yr
For passive investors: Depreciation is non-cash, so a rental often shows a tax loss while cash-flowing — sheltering income. Rental losses are passive: they offset passive income freely, and up to $25,000/yr can offset ordinary (W-2) income if you actively participate and your MAGI is under $100k (phasing out to $0 by $150k); unused losses carry forward. On sale, claimed depreciation is recaptured at up to 25%, and gains may owe capital-gains tax (a 1031 exchange can defer both). Figures are a year-1 estimate at your 24.0% rate — not tax advice; consult a CPA.
Schools (NCES district)
- District
- Temecula Valley Unified
- NCES district ID
- 0600028
- Math proficiency
- 55% ▲ 1.00%
- Reading proficiency
- 69% ▲ 1.00%
- Median HH income
- $84,032
- Composite
- 57.48/100
- National rank
- #2264
- State rank
- #173 of 1400 in CA
Livability — French Valley
- Score
- 59/100
- State rank
- #655
- US rank
- #20351
Category grades
Schools grade is shown separately in the Schools card above.
Census & demographics
- Census place
- French Valley, CA
- County
- Riverside County · 2,287,001 people
- Metro
- Riverside-San Bernardino-Ontario, CA
- Population (ZIP)
- 38,981
- Household income
- $132,538
- Rent vs Own
- Severe rent burden
- 591.0
Population outlook (Riverside County) Hauer SSP2
- Today (2025)
- 2,664,475 people
- By 2030
- 2,802,692 · +5.2%
- By 2040
- 3,050,904 · +14.5%
- By 2050
- 3,256,783 · +22.2%
- By 2075
- 3,655,058 · +37.2%
- By 2100
- 3,766,594 · +41.4%
Race, ethnicity, and origin ACS 2023
- Neighborhood character
- Highly diverse neighborhood (Simpson 0.72)
- Race & ethnicity
- White 38% Hispanic / Latino 34% Two or more races 16% Asian 12% Black 6% Pacific Islander 2%
- Hispanic origin (detail)
- Mexican 29%
- Common ancestry
- Slovak 3% Italian 2% Portuguese 1%
- Foreign-born
- 14% · Canada, Vietnam
- Languages at home
- 76% English-only · Spanish 16% Tagalog/Filipino 4% Vietnamese 1%
Political lean MEDSL · Riverside
- 2024 margin
- Toss-up / Even · D 48.0% · R 49.3% · Other 2.6%
- 2008→2024 swing
- -3.6pp toward R · 2008: 2.3pp · 2024: -1.3pp
- All cycles
- 2024: R+1.3 2020: D+8.0 2016: D+4.3 2012: R+0.4 2008: D+2.3
Not yet ingested
- Civics
- —
Market trends
- HPI YoY
- ▲ 12.43%
- Current HPI
- 332.169
- Rent YoY
- ▼ -0.79%
- Metro
- Riverside-San Bernardino-Ontario, CA
- State GDP YoY
- ▲ 3.21%
- F500 in state
- 116
Industry mix (Fortune 500 HQ in CA)
| Industry | F500 HQs | Revenue |
|---|---|---|
| Technology | 27 | $1,492B |
|
||
| Financial Services | 3 | $174B |
|
||
| Retail | 3 | $44B |
|
||
| Insurance | 3 | $26B |
|
||
| Media / Entertainment | 2 | $115B |
|
||
| Pharmaceuticals / Biotech | 2 | $62B |
|
||
Price history
+93.9% since first listed6 events — show timeline
- 2026-06-09 Listed $939,000 CRMLS
- 2018-02-02 Sold (MLS) $490,742 CRMLS
- 2017-12-26 Pending — CRMLS
- 2017-12-18 Delisted — CRMLS
- 2017-11-27 Price Changed $495,742 CRMLS
- 2017-11-13 Listed $484,270 CRMLS
Property tax history
+28.8%/yrLatest (2025): $9,011 · +0.3% YoY. Source: county tax records.
Cash-flow waterfall
monthlySold comps — $/sqft
last 12 mo · ≤1 miLoading sold comps…