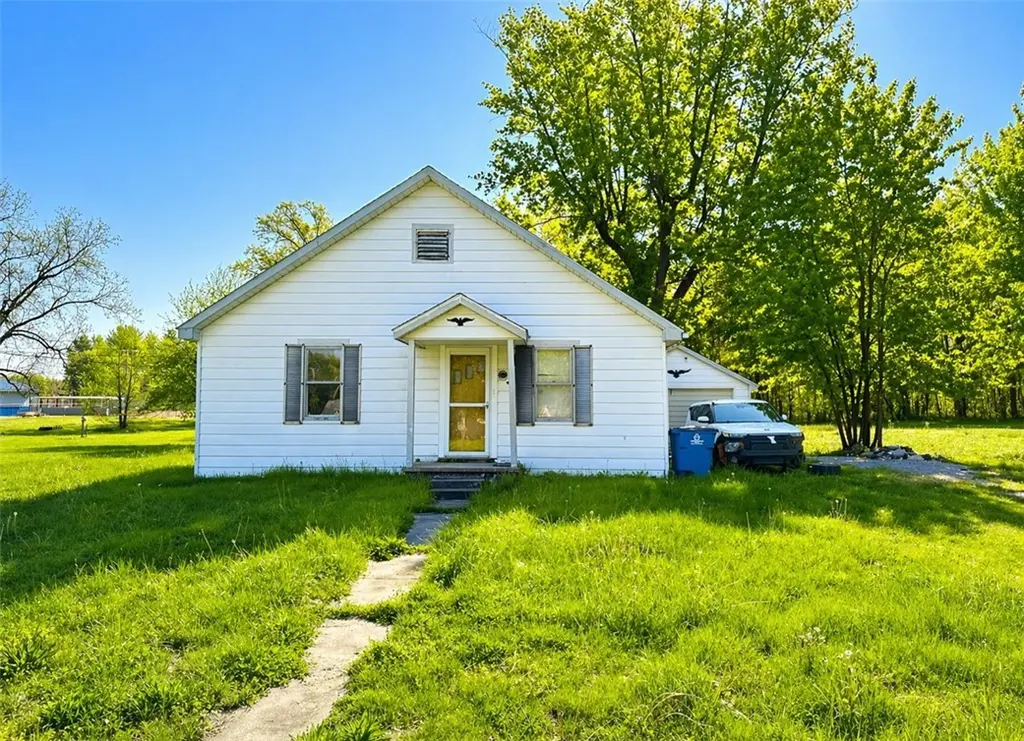
210 N Grant St · Martinsville, IL
Flood risk 1/10 · Minimal
- FEMA flood zone
- X (unshaded)
- Chance of flooding over 30 yrs
- 0.0%
- Est. flood insurance / yr
- $507 – $1,088
Fire risk 1/10 · Minimal
- Est. fire insurance / yr
- $804 – $1,492
Heat risk 4/10 · Minor
- Hot days now (above 104°F)
- 7 days/yr
- Hot days in 30 yrs
- 19 days/yr
Wind risk 2/10 · Minimal
- Chance of severe wind over 30 yrs
- 1.0%
Air-quality risk 2/10 · Minimal
- Unhealthy air days now
- 1 days/yr
- Unhealthy air days in 30 yrs
- 2 days/yr
Risk factors via First Street. Map © Google.
Why this score? — see what drove the B grade
The composite is a weighted blend of 9 inputs, each scored 0–100. Each bar is that input's sub-score; the figure is the points it added to the 100-point composite (weight × sub-score).
- Cash flow +30.0/30.0
- 1% rule +10.0/10.0
- DSCR +10.0/10.0
- ARV discount +7.5/15.0
- Appreciation +6.6/10.0
- Livability +3.1/5.0
- Rent growth +2.5/5.0
- Condition / age +2.5/5.0
- Schools +1.7/10.0
$34,900
🖨 Deal sheet (PDF) 📄 Offer letter ✓ Due diligence
Listing remarks
Opportunity awaits on the edge of Martinsville. This property offers a large parcel with an attached garage and plenty of potential. The home will require extensive renovation and is ready for someone with vision to bring it back to life. With the right updates, it could offer a 3 bedroom, 2 bathroom layout. Ideal for investors or buyers ready to take on a full renovation project.
Key facts
- Extensive renovation
- Large parcel
- Detached garage
Tags
Property features AI
Exterior
- Parking: Attached garage (1 garage space)
- Utilities: Public water; Sewer: Other
- Home design: Single-family residence; One story
- Construction: Construction materials: Other
- Exterior features: Shingle roof; Shed(s)
Interior
- Kitchen: No listed built-in kitchen appliances (none specified)
- Bedrooms: 6 total rooms (includes bedrooms and living spaces)
- Bathrooms: 2 full bathrooms
- Heating & cooling: Has heating (type listed as Other); Has cooling (type listed as Other)
- Interior features: Water heater; Crawl space basement
- Laundry & utility: Laundry on main level
Neighborhood map
What this means for you Summary
Snapshot
- This is a 3-bed/1.0-bath single-family listed at $35k.
Deal economics
- At list price, monthly cash flow is $683 ($8k/yr) — positive.
- The deal already cash-flows at list — no discount required.
- Meets the 1% rule at list price ($1k rent vs $35k).
- Recommended offer: $34k (3.0% below list) — sets the bar for market timing.
Location & tenants
- Location reads 61/100 on livability (#944 in IL) — a middle-class / working-renter tenant base. Strengths: crime A+, cost of living A+, housing A; Watch: amenities F, commute F, employment F.
- Martinsville CUSD 3C (rural): math 15% / reading 15% proficiency, ranked #778 of 919 in IL (top 85%) — low school quality limits family demand, transient renter base, plan for 1-2y turnover.
- Zoned schools: Martinsville Elem School (math 17% / reading 22%, grade F, #1,054 of 2,056 statewide, top 54%, 230 students, 0% FRL); Martinsville Jr- Sr High School (math 12% / reading 22%, grade F, #430 of 693 statewide, top 66%, 148 students, 0% FRL) — zoned schools average 0% FRL vs 44% district-wide (44 pts lower); this property's tenant base skews higher-income than the district average.
- Market conditions: 10 active listings in the ZIP; 1 units permitted in Clark County in 2024 (0 in 5+ unit buildings).
Forward outlook
- In year one you build about $1k of equity ($241 loan paydown + $1k appreciation (3.1% local appreciation)).
- Clark County population projected at -20% by 2050 — secular population decline; favor cash flow + early exit over multi-decade hold.
- At projected returns (3.1% appreciation + 3.0% rent growth), your $10k cash investment doubles in ~2 years — after that, you're playing with house money.
Negotiation context
- It's been on market 46 days — a 3% lower offer ($34k) is reasonable based on typical stale-listing flexibility.
- Current owner paid $25k; 40% above their basis — modest negotiation headroom, anchor on the comps not their cost.
Risks & watch-outs
- Watch-outs: built in 1940 — expect roof / HVAC / electrical / plumbing capex.
Questions for the listing agent
- It's been on market 46 days. Have you received any prior offers? Is the seller open to a 3% concession, seller financing, or rate buy-down credit?
- Built in 1940 — when were the roof, HVAC, electrical panel, plumbing, and water heater last replaced?
- Is there a deadline driving the sale (1031 exchange, divorce, estate, relocation)? That informs how much negotiation room exists.
- Schools are F-rated, which usually means shorter tenancies and higher turnover. Who's the typical renter profile here, and what's been the actual vacancy rate?
- What's the average days-on-market for RENTAL listings here right now (not sales)? A rising rental-DOM trend means longer vacancies and softer asking-rent achievability than the comps imply.
- What's the recent tenant-quality profile in this submarket — average credit score on applications, eviction rate, late-payment / NSF rate, and stable-employment percentage? A property-management company in the area should have these aggregated.
- How much new for-sale + rental construction is in the pipeline within 1–3 miles? Heavy new supply typically softens prices + rents 12–24 months out; constrained supply supports both.
Investment metrics
- 1% rule
- 3.34% ✓
- Cap rate
- 29.77%
- Cash-on-cash
- 83.84%
- DSCR
- 4.73
- GRM
- 2.5
CMA / ARV
- ARV (median comp)
- $73,818
- List price
- $34,900
- Delta
- -52.72%
- Verdict
- UNDERPRICED
- Comps
- 15 within 1.0 mi
Show comp detail 4 sales within ~0.75 mi
| Address | Dist | Beds/Ba | Sqft | Sold | Price | $/sf | Match |
|---|---|---|---|---|---|---|---|
| 309 N Ferrell St | 0.17mi | 3/1.0 | 1,380 (+1%) | 5mo | $106,400 | $77 | 86 |
| 22 N Grant St | 0.19mi | 4/1.0 (+1) | 1,445 (+6%) | 4mo | $36,500 | $25 | 73 |
| 113 E Ohio St | 0.25mi | 3/1.5 | 1,464 (+7%) | 10mo | $89,900 | $61 | 65 |
| 14 E Bond St | 0.32mi | 3/2.0 | 1,225 (-10%) | 20mo | $69,000 | $56 | 47 |
Match score weights: distance 35% · size 25% · config 20% · recency 20%. Top-matched comps best support the ARV.
Projected returns pro-forma
3.11% appreciation · 3.0% rent growth · sell at horizon
- IRR
- 88.3%
- Equity multiple
- 5.90×
- Total profit
- $47,912
- Equity at exit
- $15,914
- IRR
- 87.8%
- Equity multiple
- 12.19×
- Total profit
- $109,389
- Equity at exit
- $24,698
Cash invested: $9,772 (down + closing). Projections, not guarantees.
Landlord ↔ Tenant lean methodology
- Overall (STATE)
- 43 Moderately Tenant-Leaning
- State Illinois
- 43 Moderately Tenant-Leaning · D+7
- County
- — inherits STATE
- City
- — inherits STATE
ZIP-level market 62442
- Home prices YoY
- 2.9%
- Active inventory
- 10
- Price-to-rent
- 2.5×
Monthly cashflow live
- Estimated rent
- $1,165 medium interval (Pro) →
- Mortgage (P&I)
- −$183
- Tax from tax record
- −$40 /mo · $482/yr
- Insurance
- −$15
- HOA
- −$0
- Vacancy / Maint / Mgmt
- −$245
- Net cashflow
- $683
Break-even live
Sensitivity live
| Price | -10% $702 | -5% $693 | +0% $683 | +5% $673 | +10% $663 |
|---|---|---|---|---|---|
| Rent | -10% $591 | -5% $637 | +0% $683 | +5% $729 | +10% $775 |
| Rate | -1.0pp $700 | -0.5pp $692 | base $683 | +0.5pp $674 | +1.0pp $664 |
UW: 25.0% down · 7.5% · 30yr · 1.5% tax · 5.0% vac · 8.0% maint · 8.0% mgmt
Financing live
Cash to close
- Down payment
- $8,725
- Closing costs
- $1,047
- Reserves months
- —
- Total cash needed
- —
Loan-product check · same deal, 3 products live
Conventional
25% down · 7.5% · 30yr
- Down + closing
- —
- Monthly P&I
- —
- Monthly cashflow
- —
- DSCR
- —
- Eligible?
- —
Personal DTI + credit; lowest rate.
DSCR
20% down · 8.5% · 30yr
- Down + closing
- —
- Monthly P&I
- —
- Monthly cashflow
- —
- DSCR
- —
- Eligible?
- —
No personal income docs; deal must DSCR.
Hard money
10% down · 12.0% · 12mo
- Down + closing
- —
- Monthly P&I
- —
- Monthly cashflow
- —
- DSCR
- —
- Eligible?
- —
Short-term bridge; refi at stabilization.
Listing history 11 events
-
2026-06-09days on market $34,900 Active 46 DOM
-
2026-06-08days on market $34,900 Active 45 DOM
-
2026-06-07days on market $34,900 Active 44 DOM
-
2026-06-07days on market $34,900 Active 43 DOM
-
2026-06-04days on market $34,900 Active 40 DOM
-
2026-06-02days on market $34,900 Active 39 DOM
-
2026-06-01days on market $34,900 Active 38 DOM
-
2026-05-31days on market $34,900 Active 37 DOM
-
2026-05-31days on market $34,900 Active 36 DOM
-
2026-04-24$34,900 Active 383-char remark
-
2007-04-02soldstatus $25,000
ⓘ Source: listings_history table (triggers on properties + properties_extension) + one-shot
backfill from property_details.listing_events for pre-trigger history.
Tax reassessment forecast IL · Partial reset (capped growth)
- Current annual tax
- $482 · $40/mo
- Projected year-2 tax
- $637 · $53/mo
- Expected delta
- +$155/yr (+$13/mo · 32.2%)
ⓘ Screening estimate from a state-policy table — verify with the county assessor before closing.
Climate risk First Street
- Flood 1/10 Low FEMA zone X (unshaded) · 0% chance over 30 yrs
- Wildfire 1/10 Low
- Heat 4/10 Moderate 7 d/yr ≥104°F today · 19 d/yr by 30 yrs out
- Wind 2/10 Low 100% chance of damaging wind over 30 yrs
- Air quality 2/10 Low 1 unhealthy d/yr today · 2 by 30 yrs out
Nearby sold comps map
Loading sold comps map…
Walkable amenities ~0.75 mi
Loading nearby amenities…
Taxation est. · year 1
- Rental income
- $13,981
- − Mortgage interest
- −$1,955
- − Property taxes
- −$482
- − Insurance
- −$174
- − Repairs & maintenance
- −$1,119
- − Management
- −$1,119
- − Depreciation
- −$1,015
- Taxable income
- $8,118
- Est. tax owed @ 24.0%
- −$1,948
- After-tax cash flow
- $6,245/yr
For passive investors: Depreciation is non-cash, so a rental often shows a tax loss while cash-flowing — sheltering income. Rental losses are passive: they offset passive income freely, and up to $25,000/yr can offset ordinary (W-2) income if you actively participate and your MAGI is under $100k (phasing out to $0 by $150k); unused losses carry forward. On sale, claimed depreciation is recaptured at up to 25%, and gains may owe capital-gains tax (a 1031 exchange can defer both). Figures are a year-1 estimate at your 24.0% rate — not tax advice; consult a CPA.
Schools (NCES district)
- District
- Martinsville CUSD 3C
- NCES district ID
- 1724900
- Math proficiency
- 15% ▬ 0.00%
- Reading proficiency
- 15% ▼ -5.00%
- Median HH income
- $45,654
- Composite
- 16.8/100
- National rank
- #14220
- State rank
- #778 of 919 in IL
Livability — Martinsville
- Score
- 61/100
- State rank
- #944
- US rank
- #18392
Category grades
Schools grade is shown separately in the Schools card above.
Census & demographics
- Census place
- Martinsville, IL
- Population (ZIP)
- 2,629
Population outlook (Clark County) Hauer SSP2
- Today (2025)
- 14,978 people
- By 2030
- 14,380 · -4.0%
- By 2040
- 13,135 · -12.3%
- By 2050
- 11,920 · -20.4%
- By 2075
- 9,254 · -38.2%
- By 2100
- 6,737 · -55.0%
Race, ethnicity, and origin ACS 2023
- Neighborhood character
- Predominantly White (96%)
- Race & ethnicity
- White 96% Two or more races 3%
- Common ancestry
- Lithuanian 1% Iranian 1% Italian 1%
- Foreign-born
- 1%
- Languages at home
- 99% English-only · Other Indo-European 1%
Political lean MEDSL · Clark
- 2024 margin
- Solid R (+51.2) · D 23.5% · R 74.7% · Other 1.8%
- 2008→2024 swing
- -43.2pp toward R · 2008: -8.1pp · 2024: -51.2pp
- All cycles
- 2024: R+51.2 2020: R+50.7 2016: R+47.9 2012: R+32.5 2008: R+8.1
Not yet ingested
- Civics
- —
Market trends
- HPI YoY
- ▲ 3.11%
- Current HPI
- 110.8748
- Rent YoY
- —
- Metro
- —
- State GDP YoY
- ▲ 1.59%
- F500 in state
- 60
Industry mix (Fortune 500 HQ in IL)
| Industry | F500 HQs | Revenue |
|---|---|---|
| Insurance | 4 | $201B |
|
||
| Consumer Goods | 4 | $87B |
|
||
| Industrial Machinery | 3 | $64B |
|
||
| Healthcare | 2 | $55B |
|
||
| Retail / Pharmacy | 1 | $148B |
|
||
| Agriculture / Food | 1 | $86B |
|
||
Price history
+39.6% since first listed2 events — show timeline
- 2026-04-24 Listed $34,900 CIBR
- 2007-04-02 Sold (Public Records) $25,000 Public Records
Property tax history
-6.7%/yrLatest (2024): $482 · -67.1% YoY. Source: county tax records.
Cash-flow waterfall
monthlySold comps — $/sqft
last 12 mo · ≤1 miLoading sold comps…