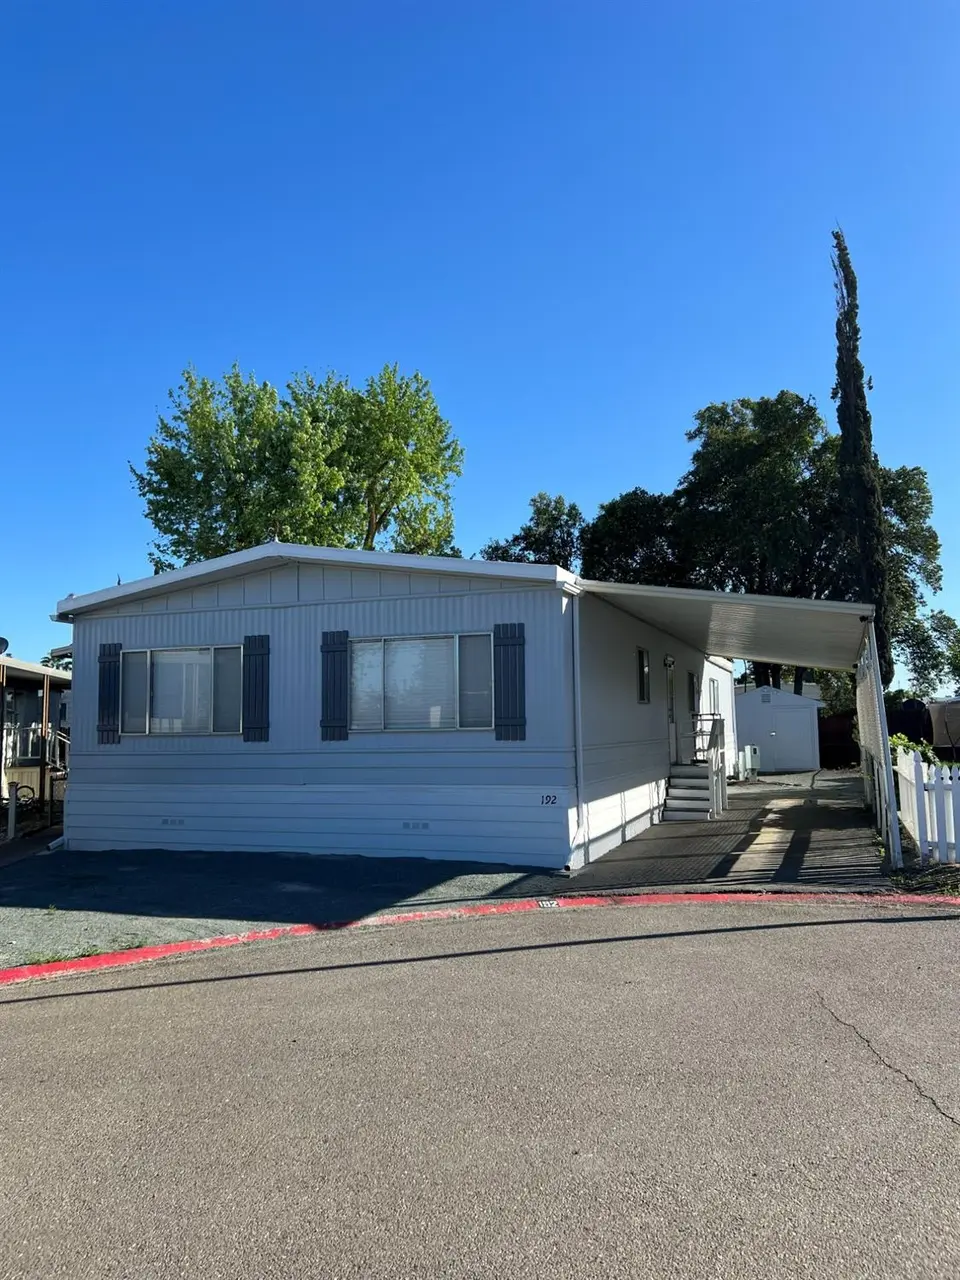
5100 N Highway · Stockton, CA
Flood risk 4/10 · Minor
- FEMA flood zone
- X
- Chance of flooding over 30 yrs
- 0.24%
- Est. flood insurance / yr
- $507 – $1,088
Fire risk 6/10 · Moderate
- Est. fire insurance / yr
- $659 – $1,223
Heat risk 7/10 · Major
- Hot days now (above 102°F)
- 7 days/yr
- Hot days in 30 yrs
- 14 days/yr
Wind risk 1/10 · Minimal
- Chance of severe wind over 30 yrs
- —
Air-quality risk 10/10 · Severe
- Unhealthy air days now
- 30 days/yr
- Unhealthy air days in 30 yrs
- 30 days/yr
Risk factors via First Street. Map © Google.
Why this score? — see what drove the D+ grade
The composite is a weighted blend of 9 inputs, each scored 0–100. Each bar is that input's sub-score; the figure is the points it added to the 100-point composite (weight × sub-score).
- Cash flow +22.0/30.0
- 1% rule +10.0/10.0
- DSCR +7.0/10.0
- Livability +2.9/5.0
- Schools +2.7/10.0
- Rent growth +2.5/5.0
- Condition / age +2.5/5.0
- ARV discount +0.0/15.0
- Appreciation +0.0/10.0
$169,900
🖨 Deal sheet (PDF) 📄 Offer letter ✓ Due diligence
Listing remarks
🚨🔥WELLCOME TO 5100 NORTH Highway 99 SPC 192 COMPLETELY REMODELED - LIKE A BRAND NEW MOBILE NEW HOME! 🔥🚨 Don't miss this incredible opportunity! This 3-bedroom, 2-bath mobile home (1,440 Sq Ft) has been fully renovated from the ground up - EVERYTHING IS NEW! From the foundation to the finishes, this home has been upgraded with modern design, quality materials, and attention to every detail. Just move in and enjoy! ✔️ Spacious and open layout ✔️ Side-by-side parking for 2 cars ✔️ Turnkey condition - no repairs needed 💥 SELLER IS READY TO MAKE A DEAL - ALL OFFERS WILL BE REVIEWED! 💥 This is your chance to own a beautiful, like-new home at an unbeatable value. Opportunities like this don't
Key facts
- 3,000 sq ft lot
- Parking
- Pool
Neighborhood map
What this means for you Summary
Snapshot
- This is a 3-bed/2.0-bath land listed at $170k.
Deal economics
- At list price, monthly cash flow is $269 ($3k/yr) — positive.
- The deal already cash-flows at list — no discount required.
- Meets the 1% rule at list price ($3k rent vs $170k).
- Recommended offer: $160k (6.0% below list) — sets the bar for market timing.
- Cap rate 8.2% vs local median 3.6% in Stockton — top-decile yield for the area; either an underpriced asset or a hidden risk that comps aren't pricing in. Stress-test before assuming the spread holds.
Location & tenants
- Location reads 57/100 on livability (#734 in CA) — a working-class tenant base; expect higher turnover. Strengths: housing A+, health & safety A, amenities A-; Watch: employment C-, crime F, commute F.
- Lodi Unified (urban): math 24% / reading 36% proficiency, ranked #325 of 517 in CA (top 63%) — families likely to look elsewhere, expect single-tenant / working-renter base with shorter leases.
- Zoned schools: Davis Elementary (math 8% / reading 27%, grade F, #1,335 of 1,571 statewide, top 85%, 327 students, 85% FRL); Morada Middle (math 19% / reading 27%, grade F, #376 of 498 statewide, top 76%, 746 students, 84% FRL); Ronald E. Mcnair High (math 24% / reading 50%, grade F, #578 of 1,170 statewide, top 51%, 1,768 students, 75% FRL) — zoned schools average 82% FRL vs 59% district-wide (23 pts higher); higher-poverty schools than district average — tighter screening recommended.
- Market conditions: 161 active listings in the ZIP; 4 comparable units currently listed for rent nearby; rentals leasing fast (median 5d on market — plan ~1-2 weeks tenant-placement turnaround); high-income renter base; 3,779 units permitted in San Joaquin County in 2024 (0 in 5+ unit buildings).
- This rent runs 32% of the median local income ($112k/yr) — at the standard rent-burdened threshold; future hikes will face affordability resistance.
Forward outlook
- Local home prices are declining (-3.0%/yr); year-one equity from $1k of loan paydown is wiped out by about $5k of value loss. Plan a longer hold.
- San Joaquin County population projected at +17% by 2050 — long-run rental-demand tailwind backs the buy-and-hold thesis.
Negotiation context
- It's been on market 75 days — a 6% lower offer ($160k) is reasonable based on typical stale-listing flexibility.
Risks & watch-outs
- Watch-outs: HOA is 31% of rent.
- Climate carrying-cost: major wildfire risk; extreme-heat days projected 7→14/yr by 2055 (HVAC capex compounding) — expect insurance premiums to compound above CPI over the hold.
Questions for the listing agent
- It's been on market 75 days. Have you received any prior offers? Is the seller open to a 6% concession, seller financing, or rate buy-down credit?
- Built in 1974 — when were the roof, HVAC, electrical panel, plumbing, and water heater last replaced?
- What does the HOA fee cover, when was the last increase, and are there any pending special assessments or reserve-fund shortfalls?
- Why hasn't it sold? Are there any deal-killer items the seller is aware of (foundation, flood, title, zoning, code violations)?
- Is there a deadline driving the sale (1031 exchange, divorce, estate, relocation)? That informs how much negotiation room exists.
- Schools are D-rated, which usually means shorter tenancies and higher turnover. Who's the typical renter profile here, and what's been the actual vacancy rate?
- Crime grade is F in this area — have there been break-ins, vandalism, or insurance claims at this property in the last 3 years? What carrier currently insures it and at what premium?
- The area grade is low — what's the realistic commute time and amenity access for the typical tenant pool here? Any planned neighborhood developments (good or bad) we should know about?
- What's the average days-on-market for RENTAL listings here right now (not sales)? A rising rental-DOM trend means longer vacancies and softer asking-rent achievability than the comps imply.
- What's the recent tenant-quality profile in this submarket — average credit score on applications, eviction rate, late-payment / NSF rate, and stable-employment percentage? A property-management company in the area should have these aggregated.
- How much new for-sale + rental construction is in the pipeline within 1–3 miles? Heavy new supply typically softens prices + rents 12–24 months out; constrained supply supports both.
Investment metrics
- 1% rule
- 1.76% ✓
- Cap rate
- 8.19%
- Cash-on-cash
- 6.79%
- DSCR
- 1.30
- GRM
- 4.7
CMA / ARV
- ARV (median comp)
- $119,377
- List price
- $169,900
- Delta
- 42.32%
- Verdict
- OVERPRICED
- Comps
- 3 within 1.0 mi
Projected returns pro-forma
-3.0% appreciation · 3.0% rent growth · sell at horizon
- IRR
- -5.5%
- Equity multiple
- 0.79×
- Total profit
- $-9,778
- Equity at exit
- $25,333
- IRR
- 4.5%
- Equity multiple
- 1.34×
- Total profit
- $16,040
- Equity at exit
- $14,690
Cash invested: $47,572 (down + closing). Projections, not guarantees.
Landlord ↔ Tenant lean methodology
- Overall (STATE)
- 18 Strongly Tenant-Friendly
- State California
- 18 Strongly Tenant-Friendly · D+13
- County
- — inherits STATE
- City
- — inherits STATE
ZIP-level market 95212
- Active inventory
- 161
- Price-to-rent
- 4.7×
Monthly cashflow live
- Estimated rent
- $2,992 medium interval (Pro) →
- Mortgage (P&I)
- −$891
- Tax est. 1.5%
- −$212 /mo · $2,548/yr
- Insurance
- −$71
- HOA
- −$920
- Vacancy / Maint / Mgmt
- −$628
- Net cashflow
- $269
Break-even live
Sensitivity live
| Price | -10% $387 | -5% $328 | +0% $269 | +5% $210 | +10% $152 |
|---|---|---|---|---|---|
| Rent | -10% $33 | -5% $151 | +0% $269 | +5% $387 | +10% $505 |
| Rate | -1.0pp $355 | -0.5pp $312 | base $269 | +0.5pp $225 | +1.0pp $180 |
UW: 25.0% down · 7.5% · 30yr · 1.5% tax · 5.0% vac · 8.0% maint · 8.0% mgmt
Financing live
Cash to close
- Down payment
- $42,475
- Closing costs
- $5,097
- Reserves months
- —
- Total cash needed
- —
Loan-product check · same deal, 3 products live
Conventional
25% down · 7.5% · 30yr
- Down + closing
- —
- Monthly P&I
- —
- Monthly cashflow
- —
- DSCR
- —
- Eligible?
- —
Personal DTI + credit; lowest rate.
DSCR
20% down · 8.5% · 30yr
- Down + closing
- —
- Monthly P&I
- —
- Monthly cashflow
- —
- DSCR
- —
- Eligible?
- —
No personal income docs; deal must DSCR.
Hard money
10% down · 12.0% · 12mo
- Down + closing
- —
- Monthly P&I
- —
- Monthly cashflow
- —
- DSCR
- —
- Eligible?
- —
Short-term bridge; refi at stabilization.
Rent comps 4 comps
| Address | Beds | Baths | Sqft | Rent | $/sqft | DOM | Units | Dist |
|---|---|---|---|---|---|---|---|---|
| 8033 Farin Ct Stockton, CA | 4.0 | 2.5 | 2013 | $2,700 | $1.34 | 25d | 1 | 1.20mi |
| 8224 Shay Cir Stockton, CA | 3.0 | 2.5 | 2108 | $2,700 | $1.28 | 4d | 1 | 1.23mi |
| 2554 Pine Brook Dr Stockton, CA | 4.0 | 3.0 | 2209 | $2,800 | $1.27 | 4d | 1 | 1.30mi |
| 4213 Kirsten Dr Stockton, CA | 4.0 | 2.5 | 1969 | $2,595 | $1.32 | 4d | 1 | 1.33mi |
HOA detail
- Monthly dues
- $920 · $11,040/yr
Listing history 17 events
-
2026-06-17status $169,900 Pending 75 DOM
-
2026-06-16days on market $169,900 Active 75 DOM
-
2026-06-15days on market $169,900 Active 74 DOM
-
2026-06-14days on market $169,900 Active 72 DOM
-
2026-06-10days on market $169,900 Active 69 DOM
-
2026-06-09days on market $169,900 Active 68 DOM
-
2026-06-08days on market $169,900 Active 67 DOM
-
2026-06-07days on market $169,900 Active 66 DOM
-
2026-06-05days on market $169,900 Active 63 DOM
-
2026-06-03days on market $169,900 Active 62 DOM
-
2026-06-03days on market $169,900 Active 61 DOM
-
2026-06-01days on market $169,900 Active 60 DOM
-
2026-05-31days on market $169,900 Active 59 DOM
-
1996-12-30soldstatus $182,500
-
1988-07-15soldstatus $2,782,000
-
1986-12-30soldstatus $2,023,000
-
1984-04-10soldstatus $730,000
ⓘ Source: listings_history table (triggers on properties + properties_extension) + one-shot
backfill from property_details.listing_events for pre-trigger history.
Climate risk First Street
- Flood 4/10 Moderate FEMA zone X · 24% chance over 30 yrs
- Wildfire 6/10 Major
- Heat 7/10 Severe 7 d/yr ≥102°F today · 14 d/yr by 30 yrs out
- Wind 1/10 Low
- Air quality 10/10 Extreme 30 unhealthy d/yr today · 30 by 30 yrs out
Nearby sold comps map
Loading sold comps map…
Walkable amenities ~0.75 mi
Loading nearby amenities…
Taxation est. · year 1
- Rental income
- $35,898
- − Mortgage interest
- −$9,517
- − Property taxes
- −$2,548
- − Insurance
- −$850
- − Repairs & maintenance
- −$2,872
- − Management
- −$2,872
- − HOA
- −$11,040
- − Depreciation
- −$4,943
- Taxable income
- $1,257
- Est. tax owed @ 24.0%
- −$302
- After-tax cash flow
- $2,928/yr
For passive investors: Depreciation is non-cash, so a rental often shows a tax loss while cash-flowing — sheltering income. Rental losses are passive: they offset passive income freely, and up to $25,000/yr can offset ordinary (W-2) income if you actively participate and your MAGI is under $100k (phasing out to $0 by $150k); unused losses carry forward. On sale, claimed depreciation is recaptured at up to 25%, and gains may owe capital-gains tax (a 1031 exchange can defer both). Figures are a year-1 estimate at your 24.0% rate — not tax advice; consult a CPA.
Schools (NCES district)
- District
- Lodi Unified
- NCES district ID
- 0622230
- Math proficiency
- 24% ▼ -8.00%
- Reading proficiency
- 36% ▼ -8.00%
- Median HH income
- $57,165
- Composite
- 26.84/100
- National rank
- #7108
- State rank
- #325 of 517 in CA
Livability — Stockton
- Score
- 57/100
- State rank
- #734
- US rank
- #21638
Category grades
Schools grade is shown separately in the Schools card above.
Census & demographics
- County
- San Joaquin County · 729,570 people
- City population
- 332,006
- Metro
- Stockton, CA
- Population (ZIP)
- 28,437
- Household income
- $111,720
- Rent vs Own
- Severe rent burden
- 414.0
Population outlook (San Joaquin County) Hauer SSP2
- Today (2025)
- 796,965 people
- By 2030
- 828,849 · +4.0%
- By 2040
- 885,611 · +11.1%
- By 2050
- 929,798 · +16.7%
- By 2075
- 994,578 · +24.8%
- By 2100
- 971,291 · +21.9%
Race, ethnicity, and origin ACS 2023
- Neighborhood character
- Highly diverse neighborhood (Simpson 0.70)
- Race & ethnicity
- Asian 43% Hispanic / Latino 24% White 22% Two or more races 12% Black 6% Native American 2%
- Hispanic origin (detail)
- Mexican 21%
- Common ancestry
- Italian 2% Slovak 2% Romanian 1%
- Foreign-born
- 31% · Canada, Vietnam, China
- Languages at home
- 49% English-only · Spanish 18% Other Asian/Pacific 10% Tagalog/Filipino 9%
Political lean MEDSL · San Joaquin
- 2024 margin
- Toss-up / Even · D 48.0% · R 48.9% · Other 3.0%
- 2008→2024 swing
- -11.6pp toward R · 2008: 10.7pp · 2024: -0.9pp
- All cycles
- 2024: R+0.9 2020: D+13.9 2016: D+12.9 2012: D+8.9 2008: D+10.7
Not yet ingested
- Civics
- —
Market trends
- HPI YoY
- ▼ -188.93%
- Current HPI
- 265.3844
- Rent YoY
- —
- Metro
- Stockton, CA
- State GDP YoY
- ▲ 3.21%
- F500 in state
- 116
Industry mix (Fortune 500 HQ in CA)
| Industry | F500 HQs | Revenue |
|---|---|---|
| Technology | 27 | $1,492B |
|
||
| Financial Services | 3 | $174B |
|
||
| Retail | 3 | $44B |
|
||
| Insurance | 3 | $26B |
|
||
| Media / Entertainment | 2 | $115B |
|
||
| Pharmaceuticals / Biotech | 2 | $62B |
|
||
Price history
-75.0% since first listed4 events — show timeline
- 1996-12-30 Sold (Public Records) $182,500 Public Records
- 1988-07-15 Sold (Public Records) $2,782,000 Public Records
- 1986-12-30 Sold (Public Records) $2,023,000 Public Records
- 1984-04-10 Sold (Public Records) $730,000 Public Records
Property tax history
+1.9%/yrLatest (2025): $186,508 · +1.8% YoY. Source: county tax records.
Cash-flow waterfall
monthlySold comps — $/sqft
last 12 mo · ≤1 miLoading sold comps…