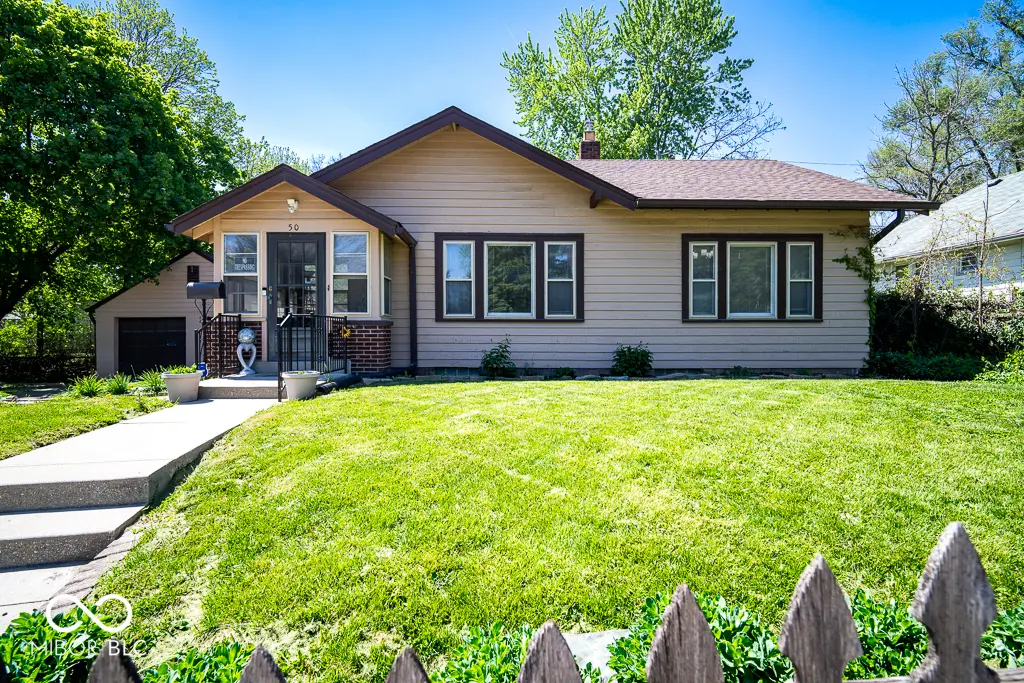
50 S Euclid Ave · Indianapolis city (balance), IN
Flood risk 6/10 · Moderate
- FEMA flood zone
- X (shaded)
- Chance of flooding over 30 yrs
- 0.75%
- Est. flood insurance / yr
- $473 – $860
Fire risk 1/10 · Minimal
- Est. fire insurance / yr
- $717 – $1,331
Heat risk 3/10 · Minor
- Hot days now (above 102°F)
- 7 days/yr
- Hot days in 30 yrs
- 19 days/yr
Wind risk 2/10 · Minimal
- Chance of severe wind over 30 yrs
- 1.0%
Air-quality risk 4/10 · Minor
- Unhealthy air days now
- 5 days/yr
- Unhealthy air days in 30 yrs
- 7 days/yr
Risk factors via First Street. Map © Google.
Why this score? — see what drove the D grade
The composite is a weighted blend of 9 inputs, each scored 0–100. Each bar is that input's sub-score; the figure is the points it added to the 100-point composite (weight × sub-score).
- Cash flow +16.6/30.0
- ARV discount +8.6/15.0
- DSCR +5.2/10.0
- Rent growth +4.3/5.0
- 1% rule +3.7/10.0
- Livability +2.5/5.0
- Condition / age +2.5/5.0
- Schools +1.4/10.0
- Appreciation +0.0/10.0
$141,000
🖨 Deal sheet (PDF) 📄 Offer letter ✓ Due diligence
Listing remarks MLS
Tired of renting? Great opportunity to purchase or a fantastic investment opportunity. Formal living room offers newer carpet and ceiling fan. Formal dining room w/newer carpet and a built-in china cabinet to show off your collectibles! Large kitchen that could easliy accommodate a small table for casual meals. Kitchen offers electric range/oven, hood, dishwasher, refrigerator and pantry. Enjoy the master bedroom with an en-suite bathroom and walk-in closet. After a busy day, relax either in your private, fenced-in backyard or the enclosed front porch looking onto wooded park across the street! Blank canvas with full, unfinished basement w/loads of storage. Two car detached garage. Great location!
Key facts
- 5,881 sq ft lot
- 2 garage spots
- Built 1924
Neighborhood map
What this means for you Summary
Snapshot
- This is a 3-bed/1.0-bath single-family listed at $141k.
Deal economics
- At list price, monthly cash flow is $85 ($1k/yr) — positive.
- The deal already cash-flows at list — no discount required.
- To meet the 1% rule (rent ≥ 1% of price), the offer needs to be $122k (13.3% below list).
- Recommended offer: $122k (13.3% below list) — sets the bar for 1% rule.
- Cap rate 7.0% vs local median 4.4% in Indianapolis city (balance) — top-decile yield for the area; either an underpriced asset or a hidden risk that comps aren't pricing in. Stress-test before assuming the spread holds.
Location & tenants
- Location reads: area grade D — affects rentability + tenant quality, not the cash-flow math above.
- Indianapolis Public Schools (urban): math 14% / reading 20% proficiency, ranked #286 of 301 in IN (top 95%) — low school quality limits family demand, transient renter base, plan for 1-2y turnover; 77% free/reduced lunch — lower-income household profile, screen leases tightly.
- Zoned schools: Frederick Douglass School 19 (math 9% / reading 13%, grade F, #909 of 994 statewide, top 92%, 444 students, 81% FRL); H L Harshman Middle School (math 3% / reading 16%, grade F, #316 of 330 statewide, top 96%, 549 students, 84% FRL).
- Market conditions: Rents rising fast (+7.3%/yr); 483 active listings in the ZIP; 40 comparable units currently listed for rent nearby; rentals at typical pace (median 26d on market — plan ~3-4 weeks tenant-placement turnaround); 40% of comp listings sitting > 30 days — soft ceiling on asking rent; 1,906 units permitted in Marion County in 2024 (621 in 5+ unit buildings).
Forward outlook
- Local home prices are declining (-3.0%/yr); year-one equity from $975 of loan paydown is wiped out by about $4k of value loss. Plan a longer hold.
- Marion County population projected at +18% by 2050 — long-run rental-demand tailwind backs the buy-and-hold thesis.
Negotiation context
- Only 2 days on market — expect competitive offers; lowballing is unlikely to land.
- 3 sale attempts since 22y ago with the ask held roughly flat each time — persistent listings suggest the price (not the market) is what's stuck; bring a comps-based counter.
- Current owner paid $90k; list at $141k implies a 57% gain — meaningful room to come down on a strong offer.
Risks & watch-outs
- Watch-outs: built in 1924 — expect roof / HVAC / electrical / plumbing capex.
- Climate carrying-cost: major flood risk — expect insurance premiums to compound above CPI over the hold.
Questions for the listing agent
- Built in 1924 — when were the roof, HVAC, electrical panel, plumbing, and water heater last replaced?
- Is there a deadline driving the sale (1031 exchange, divorce, estate, relocation)? That informs how much negotiation room exists.
- The area grade is low — what's the realistic commute time and amenity access for the typical tenant pool here? Any planned neighborhood developments (good or bad) we should know about?
- What's the average days-on-market for RENTAL listings here right now (not sales)? A rising rental-DOM trend means longer vacancies and softer asking-rent achievability than the comps imply.
- What's the recent tenant-quality profile in this submarket — average credit score on applications, eviction rate, late-payment / NSF rate, and stable-employment percentage? A property-management company in the area should have these aggregated.
- How much new for-sale + rental construction is in the pipeline within 1–3 miles? Heavy new supply typically softens prices + rents 12–24 months out; constrained supply supports both.
Investment metrics
- 1% rule
- 0.87% ✗
- Cap rate
- 7.02%
- Cash-on-cash
- 2.60%
- DSCR
- 1.12
- GRM
- 9.6
CMA / ARV
- ARV (on-the-fly)
- $144,670
- Comps found
- 11
Show comp detail 11 sales within ~0.75 mi
| Address | Dist | Beds/Ba | Sqft | Sold | Price | $/sf | Match |
|---|---|---|---|---|---|---|---|
| 4648 Brookville Rd | 0.34mi | 3/2.0 | 936 (+10%) | 3mo | $189,900 | $203 | 61 |
| 545 Dayton Ave | 0.65mi | 3/1.0 | 896 (+5%) | 6mo | $101,000 | $113 | 56 |
| 334 N Chester Ave | 0.44mi | 3/2.0 | 912 (+7%) | 13mo | $175,000 | $192 | 53 |
| 3919 Spann Ave | 0.68mi | 2/1.0 (-1) | 864 (+2%) | 10mo | $74,000 | $86 | 53 |
| 251 S Gale St | 0.68mi | 3/2.0 | 864 (+2%) | 15mo | $149,000 | $172 | 49 |
| 4113 Fletcher Ave | 0.70mi | 3/1.0 | 912 (+7%) | 15mo | $155,000 | $170 | 43 |
| 239 S Bradley Ave | 0.41mi | 2/1.0 (-1) | 936 (+10%) | 23mo | $109,500 | $117 | 40 |
| 111 N Gale St | 0.69mi | 2/1.0 (-1) | 754 (-11%) | 8mo | $127,000 | $168 | 38 |
| 4154 Hoyt Ave | 0.72mi | 3/1.0 | 912 (+7%) | 21mo | $157,500 | $173 | 37 |
| 212 S Sherman Dr | 0.48mi | 3/1.0 | 972 (+14%) | 22mo | $130,000 | $134 | 36 |
| 513 N Linwood Ave | 0.51mi | 2/1.0 (-1) | 962 (+13%) | 20mo | $166,500 | $173 | 32 |
Match score weights: distance 35% · size 25% · config 20% · recency 20%. Top-matched comps best support the ARV.
Projected returns pro-forma
-3.0% appreciation · 7.31% rent growth · sell at horizon
- IRR
- -7.9%
- Equity multiple
- 0.70×
- Total profit
- $-11,918
- Equity at exit
- $21,024
- IRR
- 6.1%
- Equity multiple
- 1.54×
- Total profit
- $21,269
- Equity at exit
- $12,191
Cash invested: $39,480 (down + closing). Projections, not guarantees.
Landlord ↔ Tenant lean methodology
- Overall (STATE)
- 90 Strongly Landlord-Friendly
- State Indiana
- 90 Strongly Landlord-Friendly · R+11
- County
- — inherits STATE
- City
- — inherits STATE
ZIP-level market 46201
- Home prices YoY
- -33.9%
- Rents YoY
- 7.3%
- Active inventory
- 483
- Price-to-rent
- 9.6×
Monthly cashflow live
- Estimated rent
- $1,222 high interval (Pro) →
- Mortgage (P&I)
- −$739
- Tax from tax record
- −$82 /mo · $981/yr
- Insurance
- −$59
- HOA
- −$0
- Vacancy / Maint / Mgmt
- −$257
- Net cashflow
- $85
Break-even live
Sensitivity live
| Price | -10% $165 | -5% $125 | +0% $85 | +5% $46 | +10% $6 |
|---|---|---|---|---|---|
| Rent | -10% $-11 | -5% $37 | +0% $85 | +5% $134 | +10% $182 |
| Rate | -1.0pp $156 | -0.5pp $121 | base $85 | +0.5pp $49 | +1.0pp $12 |
UW: 25.0% down · 7.5% · 30yr · 1.5% tax · 5.0% vac · 8.0% maint · 8.0% mgmt
Financing live
Cash to close
- Down payment
- $35,250
- Closing costs
- $4,230
- Reserves months
- —
- Total cash needed
- —
Loan-product check · same deal, 3 products live
Conventional
25% down · 7.5% · 30yr
- Down + closing
- —
- Monthly P&I
- —
- Monthly cashflow
- —
- DSCR
- —
- Eligible?
- —
Personal DTI + credit; lowest rate.
DSCR
20% down · 8.5% · 30yr
- Down + closing
- —
- Monthly P&I
- —
- Monthly cashflow
- —
- DSCR
- —
- Eligible?
- —
No personal income docs; deal must DSCR.
Hard money
10% down · 12.0% · 12mo
- Down + closing
- —
- Monthly P&I
- —
- Monthly cashflow
- —
- DSCR
- —
- Eligible?
- —
Short-term bridge; refi at stabilization.
Rent comps 40 comps
| Address | Beds | Baths | Sqft | Rent | $/sqft | DOM | Units | Dist |
|---|---|---|---|---|---|---|---|---|
| 4214 E Washington St Indianapolis, IN | 3.0 | 2.0 | 961 | $1,145 | $1.19 | 0d | 1 | 0.15mi |
| 4214 E Washington St Indianapolis, IN | 3.0 | 2.0 | 961 | $1,195 | $1.24 | 9d | 1 | 0.15mi |
| 4114 E Washington St Indianapolis, IN | 2.0 | 1.0 | 909 | $1,100 | $1.21 | 46d | 1 | 0.19mi |
| 4831 E Washington St Unit 4 Indianapolis, IN | 2.0 | 2.0 | 1000 | $995 | $0.99 | 25d | 1 | 0.36mi |
| 4919 Orion Ave Indianapolis, IN | 2.0 | 1.0 | 766 | $875 | $1.14 | 45d | 1 | 0.54mi |
| 412 N Bradley Ave Unit 3 Indianapolis, IN | 2.0 | 1.0 | 700 | $950 | $1.36 | 25d | 1 | 0.55mi |
| 622 N Linwood Ave Indianapolis, IN | 3.0 | 2.0 | 985 | $1,299 | $1.32 | 45d | 1 | 0.56mi |
| 706 N Bosart Ave Indianapolis, IN | 2.0 | 1.0 | 1000 | $1,070 | $1.07 | 25d | 1 | 0.61mi |
| 3622 E New York St Indianapolis, IN | 2.0 | 1.0 | 805 | $995 | $1.24 | 45d | 1 | 0.62mi |
| 83 N Ewing St Unit 83 Indianapolis, IN | 3.0 | 1.0 | 1016 | $1,199 | $1.18 | 0d | 1 | 0.62mi |
| 83 N Ewing St Unit 83 Indianapolis, IN | 3.0 | 1.0 | 1016 | $1,199 | $1.18 | 45d | 1 | 0.62mi |
| 528 S Bosart Ave Indianapolis, IN | 3.0 | 1.0 | 720 | $1,305 | $1.81 | 45d | 1 | 0.64mi |
| 729 N Bosart Ave Indianapolis, IN | 2.0 | 1.0 | 888 | $1,195 | $1.35 | 25d | 1 | 0.66mi |
| 810 N Euclid Ave Indianapolis, IN | 3.0 | 1.0 | 574 | $1,550 | $2.70 | 21d | 1 | 0.67mi |
| 628 N Riley Ave Indianapolis, IN | 2.0 | 1.5 | 948 | $1,295 | $1.37 | 25d | 1 | 0.71mi |
| 4417 Linwood Ct Indianapolis, IN | 2.0 | 1.0 | 780 | $929 | $1.19 | 5d | 15 | 0.71mi |
| 5131 E Burgess Ave Indianapolis, IN | 2.0 | 1.0 | 816 | $1,100 | $1.35 | 0d | 1 | 0.74mi |
| 5131 E Burgess Ave Indianapolis, IN | 2.0 | 1.0 | 816 | $1,100 | $1.35 | 45d | 1 | 0.74mi |
| 4 N Butler Ave Unit 11 Indianapolis, IN | 2.0 | 1.0 | 850 | $750 | $0.88 | 6d | 1 | 0.74mi |
| 4 N Butler Ave Unit 8 Indianapolis, IN | 2.0 | 1.0 | 850 | $800 | $0.94 | 45d | 1 | 0.74mi |
| 508 Emerson Ave Indianapolis, IN | 3.0 | 1.5 | 1094 | $1,150 | $1.05 | 15d | 1 | 0.75mi |
| 508 N Emerson Ave Unit 506 Indianapolis, IN | 2.0 | 1.0 | 950 | $950 | $1.00 | 16d | 1 | 0.75mi |
| 37 S Tuxedo St Indianapolis, IN | 3.0 | 1.0 | 950 | $1,150 | $1.21 | 45d | 1 | 0.75mi |
| 3906 Hoyt Ave Indianapolis, IN | 2.0 | 1.0 | 912 | $1,250 | $1.37 | 9d | 1 | 0.78mi |
| 861 N Drexel Ave Indianapolis, IN | 3.0 | 1.0 | 1000 | $1,200 | $1.20 | 9d | 1 | 0.78mi |
| 861 N Drexel Ave Unit 863 Indianapolis, IN | 3.0 | 1.0 | 1000 | $1,200 | $1.20 | 45d | 1 | 0.78mi |
| 822 N Bradley Ave Unit 822 Indianapolis, IN | 3.0 | 1.0 | 1100 | $1,200 | $1.09 | 45d | 1 | 0.81mi |
| 822 N Bradley Ave Unit 822 Indianapolis, IN | 3.0 | 1.0 | 1100 | $1,200 | $1.09 | 0d | 1 | 0.81mi |
| 5250 E Market St Unit 5252 Indianapolis, IN | 2.0 | 1.0 | 1000 | $1,350 | $1.35 | 16d | 1 | 0.83mi |
| 750 S Dequincy St Indianapolis, IN | 3.0 | 1.5 | 936 | $1,500 | $1.60 | 45d | 1 | 0.84mi |
| 953 N Linwood Ave Indianapolis, IN | 2.0 | 1.0 | 960 | $1,325 | $1.38 | 45d | 1 | 0.87mi |
| 3706 Hoyt Ave Indianapolis, IN | 3.0 | 1.0 | 960 | $1,500 | $1.56 | 15d | 1 | 0.88mi |
| 3702 Hoyt Ave Indianapolis, IN | 3.0 | 2.0 | 960 | $1,500 | $1.56 | 15d | 1 | 0.88mi |
| 270 S Lasalle St Indianapolis, IN | 3.0 | 2.0 | 562 | $1,329 | $2.36 | 9d | 1 | 0.89mi |
| 28 S Dearborn St Unit A Indianapolis, IN | 3.0 | 1.0 | 1100 | $1,400 | $1.27 | 12d | 1 | 0.89mi |
| 340 S Dearborn St Indianapolis, IN | 2.0 | 1.0 | 873 | $1,180 | $1.35 | 25d | 1 | 0.98mi |
| 822 N Emerson Ave Indianapolis, IN | 2.0 | 1.0 | 928 | $1,050 | $1.13 | 45d | 1 | 0.98mi |
| 301 S Gray St Indianapolis, IN | 2.0 | 1.0 | 841 | $1,025 | $1.22 | 25d | 1 | 0.98mi |
| 510 N Dearborn St Indianapolis, IN | 3.0 | 1.0 | 1008 | $1,350 | $1.34 | 45d | 1 | 1.02mi |
| 235 N Oakland Ave Indianapolis, IN | 2.0 | 1.0 | 800 | $1,000 | $1.25 | 45d | 1 | 1.03mi |
Listing history 7 events
-
2026-04-23status Pending
-
2026-04-21$141,000 Active
-
2022-03-30soldstatus $90,000 Closed 713-char remark
Show marketing remark (713 chars)
Tired of renting? Great opportunity to purchase or a fantastic investment opportunity. Formal living room offers newer carpet and ceiling fan. Formal dining room w/newer carpet and a built-in china cabinet to show off your collectibles! Large kitchen that could easliy accommodate a small table for casual meals. Kitchen offers electric range/oven, hood, dishwasher, refrigerator and pantry. Enjoy the master bedroom with an en-suite bathroom and walk-in closet. After a busy day, relax either in your private, fenced-in backyard or the enclosed front porch looking onto wooded park across the street! Blank canvas with full, unfinished basement w/loads of storage. Two car detached garage. Great location!
-
2022-03-25status Pending 713-char remark
Show marketing remark (713 chars)
Tired of renting? Great opportunity to purchase or a fantastic investment opportunity. Formal living room offers newer carpet and ceiling fan. Formal dining room w/newer carpet and a built-in china cabinet to show off your collectibles! Large kitchen that could easliy accommodate a small table for casual meals. Kitchen offers electric range/oven, hood, dishwasher, refrigerator and pantry. Enjoy the master bedroom with an en-suite bathroom and walk-in closet. After a busy day, relax either in your private, fenced-in backyard or the enclosed front porch looking onto wooded park across the street! Blank canvas with full, unfinished basement w/loads of storage. Two car detached garage. Great location!
-
2022-03-24$79,900 Active 713-char remark
Show marketing remark (713 chars)
Tired of renting? Great opportunity to purchase or a fantastic investment opportunity. Formal living room offers newer carpet and ceiling fan. Formal dining room w/newer carpet and a built-in china cabinet to show off your collectibles! Large kitchen that could easliy accommodate a small table for casual meals. Kitchen offers electric range/oven, hood, dishwasher, refrigerator and pantry. Enjoy the master bedroom with an en-suite bathroom and walk-in closet. After a busy day, relax either in your private, fenced-in backyard or the enclosed front porch looking onto wooded park across the street! Blank canvas with full, unfinished basement w/loads of storage. Two car detached garage. Great location!
-
2004-07-07soldstatus $51,000 413-char remark
Show marketing remark (413 chars)
Old world arch w/beautiful location make this home a real charmer. Located across from Pleasant Run Parkway, it has a fantastic view. 9' ceiling, glass enclosed front porch, arched doorways, built-in glass hutch in dini ng rm. Lots of windows for natural light. Large rooms w/huge walk-in closet in master bedroom. Well kept yard, waterproofed full basement could be more bedrooms. Investment or 1st time buyers!!
-
2004-05-10$56,000 413-char remark
Show marketing remark (413 chars)
Old world arch w/beautiful location make this home a real charmer. Located across from Pleasant Run Parkway, it has a fantastic view. 9' ceiling, glass enclosed front porch, arched doorways, built-in glass hutch in dini ng rm. Lots of windows for natural light. Large rooms w/huge walk-in closet in master bedroom. Well kept yard, waterproofed full basement could be more bedrooms. Investment or 1st time buyers!!
ⓘ Source: listings_history table (triggers on properties + properties_extension) + one-shot
backfill from property_details.listing_events for pre-trigger history.
Tax reassessment forecast IN · Partial reset (capped growth)
- Current annual tax
- $981 · $82/mo
- Projected year-2 tax
- $1,090 · $91/mo
- Expected delta
- +$109/yr (+$9/mo · 11.1%)
ⓘ Screening estimate from a state-policy table — verify with the county assessor before closing.
Climate risk First Street
- Flood 6/10 Major FEMA zone X (shaded) · 75% chance over 30 yrs
- Wildfire 1/10 Low
- Heat 3/10 Moderate 7 d/yr ≥102°F today · 19 d/yr by 30 yrs out
- Wind 2/10 Low 100% chance of damaging wind over 30 yrs
- Air quality 4/10 Moderate 5 unhealthy d/yr today · 7 by 30 yrs out
Nearby sold comps map
Loading sold comps map…
Walkable amenities ~0.75 mi
Loading nearby amenities…
Taxation est. · year 1
- Rental income
- $14,664
- − Mortgage interest
- −$7,898
- − Property taxes
- −$981
- − Insurance
- −$705
- − Repairs & maintenance
- −$1,173
- − Management
- −$1,173
- − Depreciation
- −$4,102
- Taxable loss
- −$1,369
- Est. tax savings @ 24.0%
- +$328
- After-tax cash flow
- $1,354/yr
For passive investors: Depreciation is non-cash, so a rental often shows a tax loss while cash-flowing — sheltering income. Rental losses are passive: they offset passive income freely, and up to $25,000/yr can offset ordinary (W-2) income if you actively participate and your MAGI is under $100k (phasing out to $0 by $150k); unused losses carry forward. On sale, claimed depreciation is recaptured at up to 25%, and gains may owe capital-gains tax (a 1031 exchange can defer both). Figures are a year-1 estimate at your 24.0% rate — not tax advice; consult a CPA.
Schools (NCES district)
- District
- Indianapolis Public Schools
- NCES district ID
- 1804770
- Math proficiency
- 14% ▼ -7.00%
- Reading proficiency
- 20% ▼ -3.00%
- Median HH income
- $32,034
- Composite
- 13.69/100
- National rank
- #9499
- State rank
- #286 of 301 in IN
Livability — Indianapolis city (balance)
No livability data for this city. (Only ~50 U.S. cities are tracked.)
Census & demographics
- Census place
- Indianapolis city (balance), IN
- County
- Marion County · 998,460 people
- City population
- 881,119
- Metro
- Indianapolis-Carmel-Anderson, IN
- Population (ZIP)
- 30,335
- Household income
- $49,195
- Rent vs Own
- Severe rent burden
- 1906.0
Population outlook (Marion County) Hauer SSP2
- Today (2025)
- 1,025,572 people
- By 2030
- 1,065,727 · +3.9%
- By 2040
- 1,141,577 · +11.3%
- By 2050
- 1,208,920 · +17.9%
- By 2075
- 1,367,288 · +33.3%
- By 2100
- 1,438,201 · +40.2%
Race, ethnicity, and origin ACS 2023
- Neighborhood character
- Diverse neighborhood (Simpson 0.63)
- Race & ethnicity
- White 53% Hispanic / Latino 23% Black 18% Two or more races 9%
- Hispanic origin (detail)
- Mexican 14% Puerto Rican 2%
- Common ancestry
- Slovak 2% Lithuanian 2% Italian 1%
- Foreign-born
- 9% · Canada
- Languages at home
- 81% English-only · Spanish 17%
Political lean MEDSL · Marion
- 2024 margin
- Strong D (+27.7) · D 63.0% · R 35.3% · Other 1.7%
- 2008→2024 swing
- -0.7pp no change · 2008: 28.4pp · 2024: 27.7pp
- All cycles
- 2024: D+27.7 2020: D+29.1 2016: D+22.8 2012: D+22.2 2008: D+28.4
Not yet ingested
- Civics
- —
Market trends
- HPI YoY
- ▼ -192.51%
- Current HPI
- 375.0969
- Rent YoY
- ▲ 7.31%
- Metro
- Indianapolis-Carmel-Anderson, IN
- State GDP YoY
- ▲ 2.90%
- F500 in state
- 18
Industry mix (Fortune 500 HQ in IN)
| Industry | F500 HQs | Revenue |
|---|---|---|
| Industrial Machinery | 2 | $37B |
|
||
| Healthcare | 1 | $177B |
|
||
| Pharmaceuticals | 1 | $45B |
|
||
| Metals / Steel | 1 | $18B |
|
||
| Agriculture | 1 | $17B |
|
||
| Packaging | 1 | $12B |
|
||
Price history
+151.8% since first listed7 events — show timeline
- 2026-04-23 Pending — MIBOR as Distributed by MLS Grid
- 2026-04-21 Listed $141,000 MIBOR as Distributed by MLS Grid
- 2022-03-30 Sold (MLS) $90,000 MIBOR as Distributed by MLS Grid
- 2022-03-25 Pending — MIBOR as Distributed by MLS Grid
- 2022-03-24 Listed $79,900 MIBOR as Distributed by MLS Grid
- 2004-07-07 Sold (MLS) $51,000 MIBOR as Distributed by MLS Grid
- 2004-05-10 Listed $56,000 MIBOR as Distributed by MLS Grid
Property tax history
+0.5%/yrLatest (2025): $981 · +52.7% YoY. Source: county tax records.
Cash-flow waterfall
monthlySold comps — $/sqft
last 12 mo · ≤1 miLoading sold comps…