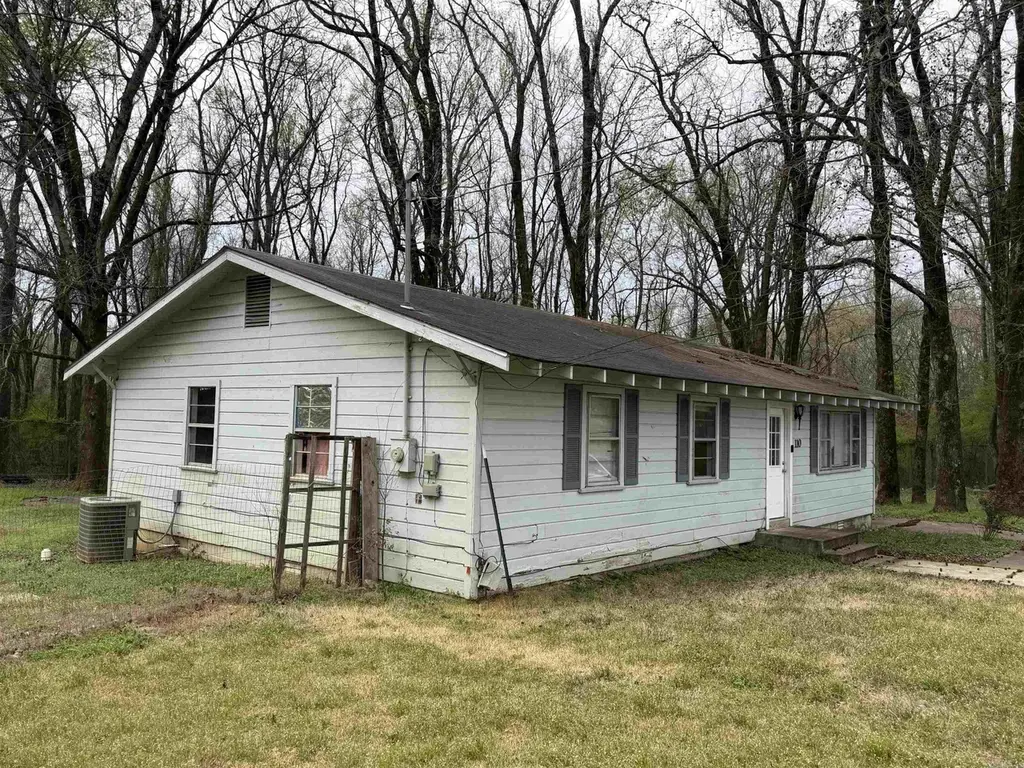
110 Perry St · Clarksville, AR
Flood risk 2/10 · Minimal
- FEMA flood zone
- X (unshaded)
- Chance of flooding over 30 yrs
- 0.05%
- Est. flood insurance / yr
- $507 – $1,088
Fire risk 5/10 · Moderate
- Est. fire insurance / yr
- $1,499 – $2,785
Heat risk 6/10 · Moderate
- Hot days now (above 112°F)
- 7 days/yr
- Hot days in 30 yrs
- 20 days/yr
Wind risk 2/10 · Minimal
- Chance of severe wind over 30 yrs
- 2.0%
Air-quality risk 1/10 · Minimal
- Unhealthy air days now
- 0 days/yr
- Unhealthy air days in 30 yrs
- 0 days/yr
Risk factors via First Street. Map © Google.
Why this score? — see what drove the B grade
The composite is a weighted blend of 9 inputs, each scored 0–100. Each bar is that input's sub-score; the figure is the points it added to the 100-point composite (weight × sub-score).
- Cash flow +30.0/30.0
- ARV discount +15.0/15.0
- DSCR +10.0/10.0
- 1% rule +8.4/10.0
- Livability +3.2/5.0
- Schools +2.6/10.0
- Rent growth +2.5/5.0
- Condition / age +2.5/5.0
- Appreciation +0.0/10.0
$99,900
🖨 Deal sheet 📄 Offer letter ✓ Due diligence
Listing remarks MLS
Possession subject to current lease. Solid 3-bedroom, 1-bath rental home with a current tenant paying $925 per month. Updates include new HVAC and partial plumbing replaced in 2017, along with new carpet in the bedrooms in 2025. The home features an eat-in kitchen with tiled countertops, gas range, and refrigerator. Additional highlights include a separate laundry room, fenced backyard, and large shade trees. A great investment opportunity with steady income potential
Key facts
- New carpet
- New hvac
- Eat-in kitchen
Tags
Neighborhood map
What this means for you Summary
Snapshot
- This is a 3-bed/1.0-bath single-family listed at $100k.
Deal economics
- At list price, monthly cash flow is $459 ($6k/yr) — positive.
- The deal already cash-flows at list — no discount required.
- Meets the 1% rule at list price ($1k rent vs $100k).
- Recommended offer: $91k (9.0% below list) — sets the bar for market timing.
- Cap rate 11.8% vs local median 4.6% in Clarksville — top-decile yield for the area; either an underpriced asset or a hidden risk that comps aren't pricing in. Stress-test before assuming the spread holds.
Location & tenants
- Location reads 65/100 on livability (#141 in AR) — a middle-class / working-renter tenant base. Strengths: cost of living A+, housing A+; Watch: schools D, crime D-, amenities F.
- Clarksville School District (town): math 29% / reading 34% proficiency, ranked #147 of 238 in AR (top 62%) — families likely to look elsewhere, expect single-tenant / working-renter base with shorter leases.
- Market conditions: 154 active listings in the ZIP; 12 units permitted in Johnson County in 2024 (0 in 5+ unit buildings).
Forward outlook
- Local home prices are declining (-3.0%/yr); year-one equity from $691 of loan paydown is wiped out by about $3k of value loss. Plan a longer hold.
- Johnson County population projected at +8% by 2050 — modest demand growth; plan on rents tracking national, not racing it.
- At projected returns (-3.0% appreciation + 3.0% rent growth), your $28k cash investment doubles in ~7 years — after that, you're playing with house money.
Negotiation context
- It's been on market 93 days — a 9% lower offer ($91k) is reasonable based on typical stale-listing flexibility.
- 5 sale attempts since 13y ago; this cycle's ask is 10146% above the opening price — seller raised mid-cycle; expect resistance to lowballs.
- Current owner paid $33k; list at $100k implies a 199% gain — meaningful room to come down on a strong offer.
Risks & watch-outs
- Climate carrying-cost: moderate wildfire risk; extreme-heat days projected 7→20/yr by 2055 (HVAC capex compounding) — expect insurance premiums to compound above CPI over the hold.
Questions for the listing agent
- It's been on market 93 days. Have you received any prior offers? Is the seller open to a 9% concession, seller financing, or rate buy-down credit?
- Built in 1960 — when were the roof, HVAC, electrical panel, plumbing, and water heater last replaced?
- Why hasn't it sold? Are there any deal-killer items the seller is aware of (foundation, flood, title, zoning, code violations)?
- Is there a deadline driving the sale (1031 exchange, divorce, estate, relocation)? That informs how much negotiation room exists.
- Schools are D-rated, which usually means shorter tenancies and higher turnover. Who's the typical renter profile here, and what's been the actual vacancy rate?
- Crime grade is D in this area — have there been break-ins, vandalism, or insurance claims at this property in the last 3 years? What carrier currently insures it and at what premium?
- What's the average days-on-market for RENTAL listings here right now (not sales)? A rising rental-DOM trend means longer vacancies and softer asking-rent achievability than the comps imply.
- What's the recent tenant-quality profile in this submarket — average credit score on applications, eviction rate, late-payment / NSF rate, and stable-employment percentage? A property-management company in the area should have these aggregated.
- How much new for-sale + rental construction is in the pipeline within 1–3 miles? Heavy new supply typically softens prices + rents 12–24 months out; constrained supply supports both.
Investment metrics
- 1% rule
- 1.34% ✓
- Cap rate
- 11.80%
- Cash-on-cash
- 19.68%
- DSCR
- 1.88
- GRM
- 6.2
CMA / ARV
- ARV (median comp)
- $121,866
- List price
- $99,900
- Delta
- -18.02%
- Verdict
- UNDERPRICED
- Comps
- 20 within 1.0 mi
Show comp detail 12 sales within ~0.75 mi
| Address | Dist | Beds/Ba | Sqft | Sold | Price | $/sf | Match |
|---|---|---|---|---|---|---|---|
| 106 Perry St | 0.02mi | 3/1.0 | 1,144 (-7%) | 23mo | $46,000 | $40 | 68 |
| 1005 W Taylor St | 0.42mi | 3/2.0 | 1,288 (+4%) | 3mo | $158,000 | $123 | 66 |
| 208 Cemetery St | 0.45mi | 3/1.0 | 1,216 (-1%) | 23mo | $75,000 | $62 | 58 |
| 903 Oakland St | 0.37mi | 3/2.5 | 1,350 (+10%) | 14mo | $170,000 | $126 | 49 |
| 1307 W Taylor St | 0.43mi | 3/2.0 | 1,372 (+11%) | 13mo | $178,500 | $130 | 46 |
| 307 Hayes St | 0.72mi | 2/1.0 (-1) | 1,232 (0%) | 18mo | $110,000 | $89 | 46 |
| 1302 W Taylor St | 0.45mi | 3/2.5 | 1,300 (+6%) | 22mo | $134,500 | $103 | 45 |
| 1309 Reynolds St | 0.74mi | 3/1.0 | 1,092 (-11%) | 6mo | $31,000 | $28 | 41 |
| 210 Cemetery St St | 0.43mi | 2/1.0 (-1) | 1,054 (-14%) | 14mo | $95,000 | $90 | 39 |
| 313 N Brown St | 0.73mi | 3/2.0 | 1,311 (+6%) | 18mo | $137,000 | $105 | 36 |
| 709 W Sevier St | 0.54mi | 2/1.0 (-1) | 1,072 (-13%) | 18mo | $126,500 | $118 | 33 |
| 308 S Cline Rd | 0.68mi | 3/2.0 | 1,414 (+15%) | 18mo | $110,000 | $78 | 25 |
Match score weights: distance 35% · size 25% · config 20% · recency 20%. Top-matched comps best support the ARV.
Projected returns pro-forma
-3.0% appreciation · 3.0% rent growth · sell at horizon
- IRR
- 11.7%
- Equity multiple
- 1.46×
- Total profit
- $13,000
- Equity at exit
- $14,895
- IRR
- 20.7%
- Equity multiple
- 2.74×
- Total profit
- $48,809
- Equity at exit
- $8,638
Cash invested: $27,972 (down + closing). Projections, not guarantees.
Landlord ↔ Tenant lean methodology
- Overall (STATE)
- 92 Strongly Landlord-Friendly
- State Arkansas
- 92 Strongly Landlord-Friendly · R+14
- County
- — inherits STATE
- City
- — inherits STATE
ZIP-level market 72830
- Home prices YoY
- -11.5%
- Active inventory
- 154
- Price-to-rent
- 6.2×
Monthly cashflow live
- Estimated rent
- $1,342 medium interval (Pro) →
- Mortgage (P&I)
- −$524
- Tax from tax record
- −$36 /mo · $429/yr
- Insurance
- −$42
- HOA
- −$0
- Vacancy / Maint / Mgmt
- −$282
- Net cashflow
- $459
Break-even live
UW: 25.0% down · 7.5% · 30yr · 1.5% tax · 5.0% vac · 8.0% maint · 8.0% mgmt
Financing live
Cash to close
- Down payment
- $24,975
- Closing costs
- $2,997
- Reserves months
- —
- Total cash needed
- —
Loan-product check · same deal, 3 products live
Conventional
25% down · 7.5% · 30yr
- Down + closing
- —
- Monthly P&I
- —
- Monthly cashflow
- —
- DSCR
- —
- Eligible?
- —
Personal DTI + credit; lowest rate.
DSCR
20% down · 8.5% · 30yr
- Down + closing
- —
- Monthly P&I
- —
- Monthly cashflow
- —
- DSCR
- —
- Eligible?
- —
No personal income docs; deal must DSCR.
Hard money
10% down · 12.0% · 12mo
- Down + closing
- —
- Monthly P&I
- —
- Monthly cashflow
- —
- DSCR
- —
- Eligible?
- —
Short-term bridge; refi at stabilization.
Listing history 29 events
-
2026-06-19days on market $99,900 Active 93 DOM
-
2026-06-18days on market $99,900 Active 92 DOM
-
2026-06-17days on market $99,900 Active 91 DOM
-
2026-06-16days on market $99,900 Active 90 DOM
-
2026-06-15days on market $99,900 Active 89 DOM
-
2026-06-14days on market $99,900 Active 87 DOM
-
2026-06-12days on market $99,900 Active 86 DOM
-
2026-06-09days on market $99,900 Active 83 DOM
-
2026-06-08days on market $99,900 Active 82 DOM
-
2026-06-07days on market $99,900 Active 81 DOM
-
2026-06-05days on market $99,900 Active 79 DOM
-
2026-06-04days on market $99,900 Active 77 DOM
-
2026-06-02days on market $99,900 Active 76 DOM
-
2026-06-01days on market $99,900 Active 75 DOM
-
2026-05-31days on market $99,900 Active 74 DOM
-
2026-05-31days on market $99,900 Active 73 DOM
-
2026-05-16$975
-
2026-03-18$99,900 New Listing 472-char remark
Show marketing remark (472 chars)
Possession subject to current lease. Solid 3-bedroom, 1-bath rental home with a current tenant paying $925 per month. Updates include new HVAC and partial plumbing replaced in 2017, along with new carpet in the bedrooms in 2025. The home features an eat-in kitchen with tiled countertops, gas range, and refrigerator. Additional highlights include a separate laundry room, fenced backyard, and large shade trees. A great investment opportunity with steady income potential
-
2024-12-08historical $950
-
2024-11-22price $950
-
2024-10-31$1,000
-
2024-10-15historical $1,000
-
2024-06-26$1,000
-
2016-11-08soldstatus $33,371
-
2016-11-08soldstatus $33,371
-
2013-05-10soldstatus $56,000 189-char remark
Show marketing remark (189 chars)
Need a nice home on a budget? Look no further! This 3 bedroom home has a great price and is a nice, neat and clean home. Ideal for a first timehome. Energy efficient home for a great price!
-
2013-05-10soldstatus $56,000
Show marketing remark (189 chars)
Need a nice home on a budget? Look no further! This 3 bedroom home has a great price and is a nice, neat and clean home. Ideal for a first timehome. Energy efficient home for a great price!
-
2013-05-01$58,900 189-char remark
Show marketing remark (189 chars)
Need a nice home on a budget? Look no further! This 3 bedroom home has a great price and is a nice, neat and clean home. Ideal for a first timehome. Energy efficient home for a great price!
-
2002-10-28soldstatus $43,000
ⓘ Source: listings_history table (triggers on properties + properties_extension) + one-shot
backfill from property_details.listing_events for pre-trigger history.
Tax reassessment forecast AR · Resets to sale price
- Current annual tax
- $429 · $36/mo
- Projected year-2 tax
- $639 · $53/mo
- Expected delta
- +$210/yr (+$17/mo · 48.9%)
ⓘ Screening estimate from a state-policy table — verify with the county assessor before closing.
Climate risk First Street
- Flood 2/10 Low FEMA zone X (unshaded) · 5% chance over 30 yrs
- Wildfire 5/10 Major
- Heat 6/10 Major 7 d/yr ≥112°F today · 20 d/yr by 30 yrs out
- Wind 2/10 Low 2% chance of damaging wind over 30 yrs
- Air quality 1/10 Low 0 unhealthy d/yr today · 0 by 30 yrs out
Nearby sold comps map
Loading sold comps map…
Walkable amenities ~0.75 mi
Loading nearby amenities…
Taxation est. · year 1
- Rental income
- $16,103
- − Mortgage interest
- −$5,596
- − Property taxes
- −$429
- − Insurance
- −$500
- − Repairs & maintenance
- −$1,288
- − Management
- −$1,288
- − Depreciation
- −$2,906
- Taxable income
- $4,095
- Est. tax owed @ 24.0%
- −$983
- After-tax cash flow
- $4,523/yr
For passive investors: Depreciation is non-cash, so a rental often shows a tax loss while cash-flowing — sheltering income. Rental losses are passive: they offset passive income freely, and up to $25,000/yr can offset ordinary (W-2) income if you actively participate and your MAGI is under $100k (phasing out to $0 by $150k); unused losses carry forward. On sale, claimed depreciation is recaptured at up to 25%, and gains may owe capital-gains tax (a 1031 exchange can defer both). Figures are a year-1 estimate at your 24.0% rate — not tax advice; consult a CPA.
Schools (NCES district)
- District
- Clarksville School District
- NCES district ID
- 0504380
- Math proficiency
- 29% ▼ -16.00%
- Reading proficiency
- 34% ▼ -5.00%
- Median HH income
- $33,344
- Composite
- 25.84/100
- National rank
- #7352
- State rank
- #147 of 238 in AR
Livability — Clarksville
- Score
- 65/100
- State rank
- #141
- US rank
- #12572
Category grades
Schools grade is shown separately in the Schools card above.
Census & demographics
- Census place
- Clarksville, AR
- Population (ZIP)
- 15,962
Population outlook (Johnson County) Hauer SSP2
- Today (2025)
- 27,452 people
- By 2030
- 28,003 · +2.0%
- By 2040
- 28,960 · +5.5%
- By 2050
- 29,627 · +7.9%
- By 2075
- 31,000 · +12.9%
- By 2100
- 31,173 · +13.6%
Race, ethnicity, and origin ACS 2023
- Neighborhood character
- Predominantly White (71%)
- Race & ethnicity
- White 71% Hispanic / Latino 18% Two or more races 9% Asian 4% Black 2%
- Hispanic origin (detail)
- Mexican 17%
- Common ancestry
- Slovak 2% Iranian 1% Lithuanian 1%
- Foreign-born
- 12% · Canada, Philippines, Vietnam
- Languages at home
- 84% English-only · Spanish 12% Other Asian/Pacific 2% German/W. Germanic 1%
Political lean MEDSL · Johnson
- 2024 margin
- Solid R (+51.4) · D 23.3% · R 74.7% · Other 2.0%
- 2008→2024 swing
- -28.4pp toward R · 2008: -23.1pp · 2024: -51.4pp
- All cycles
- 2024: R+51.4 2020: R+49.0 2016: R+40.6 2012: R+28.0 2008: R+23.1
Not yet ingested
- Civics
- —
Market trends
- HPI YoY
- ▼ -24.36%
- Current HPI
- 187.5114
- Rent YoY
- —
- Metro
- —
- State GDP YoY
- ▲ 3.80%
- F500 in state
- 10
Industry mix (Fortune 500 HQ in AR)
| Industry | F500 HQs | Revenue |
|---|---|---|
| Retail | 1 | $681B |
|
||
| Food / Agriculture | 1 | $53B |
|
||
| Retail / Energy | 1 | $22B |
|
||
| Transportation / Logistics | 1 | $12B |
|
||
| Energy | 1 | $4B |
|
||
Price history
+132.3% since first listed13 events — show timeline
- 2026-05-16 Listed for Rent $975 BUILDIUM
- 2026-03-18 Listed $99,900 CARMLS
- 2024-12-08 Rental Removed $950 BUILDIUM
- 2024-11-22 Price Changed $950 BUILDIUM
- 2024-10-31 Listed for Rent $1,000 BUILDIUM
- 2024-10-15 Rental Removed $1,000 BUILDIUM
- 2024-06-26 Listed for Rent $1,000 BUILDIUM
- 2016-11-08 Sold (Public Records) $33,371 Public Records
- 2016-11-08 Sold (Public Records) $33,371 Public Records
- 2013-05-10 Sold (Public Records) $56,000 Public Records
- 2013-05-10 Sold (MLS) $56,000 NWARMLS
- 2013-05-01 Listed $58,900 NWARMLS
- 2002-10-28 Sold (Public Records) $43,000 Public Records
Property tax history
+2.5%/yrLatest (2025): $429 · +9.9% YoY. Source: county tax records.
Cash-flow waterfall
monthlySold comps — $/sqft
last 12 mo · ≤1 miLoading sold comps…