509 W 14th Ave · Greenville, NC
Flood risk 1/10 · Minimal
- FEMA flood zone
- X (unshaded)
- Chance of flooding over 30 yrs
- 0.0%
- Est. flood insurance / yr
- $507 – $1,088
Fire risk 3/10 · Minor
- Est. fire insurance / yr
- $906 – $1,684
Heat risk 8/10 · Major
- Hot days now (above 107°F)
- 7 days/yr
- Hot days in 30 yrs
- 17 days/yr
Wind risk 8/10 · Major
- Chance of severe wind over 30 yrs
- 80.0%
Air-quality risk 3/10 · Minor
- Unhealthy air days now
- 3 days/yr
- Unhealthy air days in 30 yrs
- 3 days/yr
Risk factors via First Street. Map © Google.
Why this score? — see what drove the C grade
The composite is a weighted blend of 9 inputs, each scored 0–100. Each bar is that input's sub-score; the figure is the points it added to the 100-point composite (weight × sub-score).
- Cash flow +19.0/30.0
- ARV discount +15.0/15.0
- DSCR +6.0/10.0
- 1% rule +4.6/10.0
- Rent growth +3.9/5.0
- Livability +3.9/5.0
- Schools +3.6/10.0
- Condition / age +2.5/5.0
- Appreciation +0.0/10.0
$135,000
🖨 Deal sheet (PDF) 📄 Offer letter ✓ Due diligence
Listing remarks
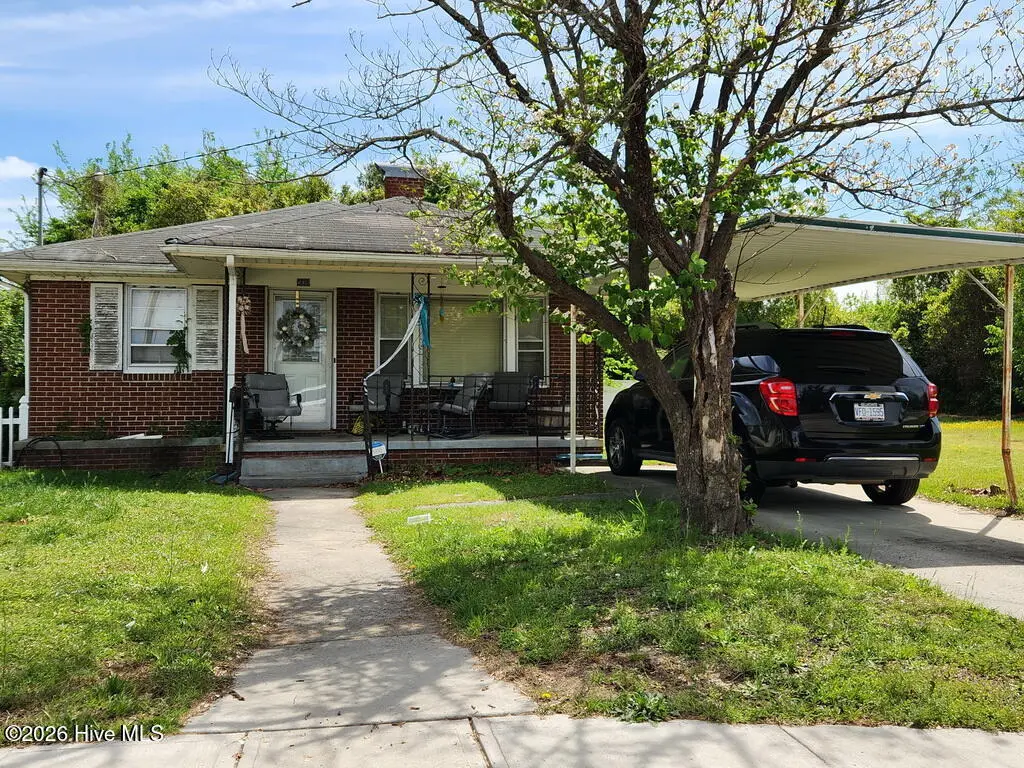
What a great opportunity to own a cute brick home with carport. This 3 bed and one bath would make a great starter home, just moments from the heart of Greenville and ECU. This property is occupied and available on auction.com.
Key facts
- Carport
- Brick home
- 4,792 sq ft lot
Tags
Property features AI
Finance
- Other: Zoning: R6
- HOA & community: No association amenities
Exterior
- Parking: Carport (1 space); Concrete parking surface
- Utilities: Public water; Sewer available; Water available
- Home design: Single family residence; One-story home; Entry level: 1
- Construction: Brick veneer and frame construction; Shingle roof
- Exterior features: Front porch; Partial fencing; Paved road access; Road frontage on city street and state road
Interior
- Bathrooms: 1 full bathroom
- Heating & cooling: Forced air heating; Wall or window cooling units
- Interior features: Crawl space basement; Total of 5 rooms; Has a view
Neighborhood map
What this means for you Summary
Snapshot
- This is a 3-bed/1.0-bath single-family listed at $135k.
Deal economics
- At list price, monthly cash flow is $141 ($2k/yr) — positive.
- The deal already cash-flows at list — no discount required.
- To meet the 1% rule (rent ≥ 1% of price), the offer needs to be $129k (4.4% below list).
- Recommended offer: $129k (4.4% below list) — sets the bar for 1% rule.
- Cap rate 7.5% vs local median 3.8% in Greenville — top-decile yield for the area; either an underpriced asset or a hidden risk that comps aren't pricing in. Stress-test before assuming the spread holds.
Location & tenants
- Location reads 77/100 on livability (#30 in NC, #2,977 nationally) — a middle-class / working-renter tenant base. Strengths: commute A+, cost of living A+, health & safety A+; Watch: crime F, employment F.
- Pitt County Schools (rural): math 41% / reading 44% proficiency, ranked #100 of 178 in NC (top 56%) — families likely to look elsewhere, expect single-tenant / working-renter base with shorter leases.
- Zoned schools: Elmhurst Elementary (math 27% / reading 37%, grade F, #908 of 1,410 statewide, top 67%, 460 students, 58% FRL); C M Eppes Middle (math 24% / reading 32%, grade F, #360 of 475 statewide, top 77%, 626 students, 99% FRL); Junius H Rose High (math 52% / reading 61%, grade C, #261 of 535 statewide, top 49%, 1,525 students, 50% FRL).
- Market conditions: Rents rising fast (+5.4%/yr); 350 active listings in the ZIP; 8 comparable units currently listed for rent nearby; rentals at typical pace (median 22d on market — plan ~3-4 weeks tenant-placement turnaround); 1,300 units permitted in Pitt County in 2024 (204 in 5+ unit buildings).
- This rent runs 32% of the median local income ($49k/yr) — at the standard rent-burdened threshold; future hikes will face affordability resistance.
Forward outlook
- Local home prices are declining (-3.0%/yr); year-one equity from $933 of loan paydown is wiped out by about $4k of value loss. Plan a longer hold.
- Pitt County population projected at +22% by 2050 — long-run rental-demand tailwind backs the buy-and-hold thesis.
Negotiation context
- It's been on market 53 days — a 3% lower offer ($131k) is reasonable based on typical stale-listing flexibility.
- Current owner paid $79k; list at $135k implies a 72% gain — meaningful room to come down on a strong offer.
Risks & watch-outs
- Watch-outs: built in 1957 — expect roof / HVAC / electrical / plumbing capex.
- Climate carrying-cost: severe wind risk, 80% chance of damaging wind over 30y; extreme-heat days projected 7→17/yr by 2055 (HVAC capex compounding) — expect insurance premiums to compound above CPI over the hold.
Questions for the listing agent
- It's been on market 53 days. Have you received any prior offers? Is the seller open to a 4% concession, seller financing, or rate buy-down credit?
- Built in 1957 — when were the roof, HVAC, electrical panel, plumbing, and water heater last replaced?
- Is there a deadline driving the sale (1031 exchange, divorce, estate, relocation)? That informs how much negotiation room exists.
- Crime grade is F in this area — have there been break-ins, vandalism, or insurance claims at this property in the last 3 years? What carrier currently insures it and at what premium?
- What's the average days-on-market for RENTAL listings here right now (not sales)? A rising rental-DOM trend means longer vacancies and softer asking-rent achievability than the comps imply.
- What's the recent tenant-quality profile in this submarket — average credit score on applications, eviction rate, late-payment / NSF rate, and stable-employment percentage? A property-management company in the area should have these aggregated.
- How much new for-sale + rental construction is in the pipeline within 1–3 miles? Heavy new supply typically softens prices + rents 12–24 months out; constrained supply supports both.
Investment metrics
- 1% rule
- 0.96% ✗
- Cap rate
- 7.54%
- Cash-on-cash
- 4.47%
- DSCR
- 1.20
- GRM
- 8.7
CMA / ARV
- ARV (on-the-fly)
- $204,120
- Comps found
- 12
Show comp detail 12 sales within ~0.75 mi
| Address | Dist | Beds/Ba | Sqft | Sold | Price | $/sf | Match |
|---|---|---|---|---|---|---|---|
| 1209 Fleming St | 0.19mi | 3/1.0 | 1,434 (-5%) | 10mo | $35,000 | $24 | 74 |
| 110 Paris Ave | 0.52mi | 3/1.0 | 1,406 (-7%) | 1mo | $80,000 | $57 | 63 |
| 909 Douglas Ave | 0.20mi | 3/2.5 | 1,354 (-10%) | 5mo | $219,000 | $162 | 63 |
| 710 Vanderbilt Ln | 0.18mi | 3/2.0 | 1,404 (-7%) | 15mo | $190,000 | $135 | 63 |
| 309 Conley St | 0.41mi | 3/1.5 | 1,670 (+10%) | 4mo | $72,000 | $43 | 59 |
| 901 Douglas Ave | 0.23mi | 3/2.0 | 1,352 (-11%) | 13mo | $219,000 | $162 | 57 |
| 624 Hudson St | 0.20mi | 3/2.5 | 1,348 (-11%) | 16mo | $229,000 | $170 | 54 |
| 1602 Myrtle St | 0.49mi | 3/1.0 | 1,334 (-12%) | 7mo | $43,000 | $32 | 52 |
| 808 Vanderbuilt Ln | 0.21mi | 3/2.5 | 1,338 (-12%) | 16mo | $224,000 | $167 | 51 |
| 618 Hudson St | 0.18mi | 4/2.0 (+1) | 1,338 (-12%) | 17mo | $221,000 | $165 | 50 |
| 407 Latham St | 0.34mi | 3/2.0 | 1,698 (+12%) | 12mo | $220,000 | $130 | 49 |
| 1519 Broad St | 0.68mi | 3/1.0 | 1,332 (-12%) | 9mo | $23,000 | $17 | 41 |
Match score weights: distance 35% · size 25% · config 20% · recency 20%. Top-matched comps best support the ARV.
Projected returns pro-forma
-3.0% appreciation · 5.44% rent growth · sell at horizon
- IRR
- -6.8%
- Equity multiple
- 0.74×
- Total profit
- $-9,676
- Equity at exit
- $20,129
- IRR
- 5.5%
- Equity multiple
- 1.45×
- Total profit
- $17,064
- Equity at exit
- $11,672
Cash invested: $37,800 (down + closing). Projections, not guarantees.
Landlord ↔ Tenant lean methodology
- Overall (STATE)
- 85 Strongly Landlord-Friendly
- State North Carolina
- 85 Strongly Landlord-Friendly · R+3
- County
- — inherits STATE
- City
- — inherits STATE
ZIP-level market 27834
- Rents YoY
- 5.4%
- Active inventory
- 350
- Price-to-rent
- 8.7×
Monthly cashflow live
- Estimated rent
- $1,290 high interval (Pro) →
- Mortgage (P&I)
- −$708
- Tax from tax record
- −$114 /mo · $1,372/yr
- Insurance
- −$56
- HOA
- −$0
- Vacancy / Maint / Mgmt
- −$271
- Net cashflow
- $141
Break-even live
Sensitivity live
| Price | -10% $217 | -5% $179 | +0% $141 | +5% $103 | +10% $64 |
|---|---|---|---|---|---|
| Rent | -10% $39 | -5% $90 | +0% $141 | +5% $192 | +10% $243 |
| Rate | -1.0pp $209 | -0.5pp $175 | base $141 | +0.5pp $106 | +1.0pp $70 |
UW: 25.0% down · 7.5% · 30yr · 1.5% tax · 5.0% vac · 8.0% maint · 8.0% mgmt
Financing live
Cash to close
- Down payment
- $33,750
- Closing costs
- $4,050
- Reserves months
- —
- Total cash needed
- —
Loan-product check · same deal, 3 products live
Conventional
25% down · 7.5% · 30yr
- Down + closing
- —
- Monthly P&I
- —
- Monthly cashflow
- —
- DSCR
- —
- Eligible?
- —
Personal DTI + credit; lowest rate.
DSCR
20% down · 8.5% · 30yr
- Down + closing
- —
- Monthly P&I
- —
- Monthly cashflow
- —
- DSCR
- —
- Eligible?
- —
No personal income docs; deal must DSCR.
Hard money
10% down · 12.0% · 12mo
- Down + closing
- —
- Monthly P&I
- —
- Monthly cashflow
- —
- DSCR
- —
- Eligible?
- —
Short-term bridge; refi at stabilization.
Rent comps 8 comps
| Address | Beds | Baths | Sqft | Rent | $/sqft | DOM | Units | Dist |
|---|---|---|---|---|---|---|---|---|
| 206 Hudson St Greenville, NC | 2.0 | 1.0 | 1150 | $900 | $0.78 | 22d | 1 | 0.23mi |
| 1001 Park Ave Greenville, NC | 3.0 | 1.0 | 1296 | $1,150 | $0.89 | 22d | 1 | 0.39mi |
| 550 Pitt-Greene Connector Greenville, NC | 4.0 | 1.0–4.0 | 1012 | $1,288 | $1.27 | 14d | 25 | 0.65mi |
| 701 Treybrooke Cir Greenville, NC | 1.0–2.0 | 1.5–2.0 | 1070 | $1,650 | $1.54 | 14d | 18 | 0.93mi |
| 600 Howell St Apt E Greenville, NC | 2.0 | 1.0 | 1050 | $815 | $0.78 | 22d | 1 | 0.98mi |
| 2511 Bluff View Ct Unit B Greenville, NC | 3.0 | 2.5 | 1403 | $1,495 | $1.07 | 22d | 1 | 1.35mi |
| 2513A Bluff View Ct Greenville, NC | 2.0 | 2.5 | 1188 | $1,175 | $0.99 | 22d | 1 | 1.37mi |
| 2604 Boone Ct Unit A Greenville, NC | 2.0 | 2.0 | 1068 | $1,299 | $1.22 | 22d | 1 | 1.47mi |
Listing history 19 events
-
2026-06-19days on market $135,000 Active 53 DOM
-
2026-06-18days on market $135,000 Active 52 DOM
-
2026-06-17days on market $135,000 Active 51 DOM
-
2026-06-16days on market $135,000 Active 50 DOM
-
2026-06-15days on market $135,000 Active 49 DOM
-
2026-06-13days on market $135,000 Active 46 DOM
-
2026-06-10days on market $135,000 Active 44 DOM
-
2026-06-09days on market $135,000 Active 43 DOM
-
2026-06-08days on market $135,000 Active 42 DOM
-
2026-06-07days on market $135,000 Active 41 DOM
-
2026-06-05days on market $135,000 Active 38 DOM
-
2026-06-03days on market $135,000 Active 37 DOM
-
2026-06-02days on market $135,000 Active 36 DOM
-
2026-06-01days on market $135,000 Active 35 DOM
-
2026-05-31days on market $135,000 Active 34 DOM
-
2026-05-30days on market $135,000 Active 33 DOM
-
2026-04-27$135,000 Active
-
2026-03-25soldstatus $78,700
-
1998-12-01soldstatus $40,000
ⓘ Source: listings_history table (triggers on properties + properties_extension) + one-shot
backfill from property_details.listing_events for pre-trigger history.
Tax reassessment forecast NC · Resets to sale price
- Current annual tax
- $1,372 · $114/mo
- Projected year-2 tax
- $1,372 · $114/mo
- Expected delta
- $0/yr ($0/mo · 0.0%)
ⓘ Screening estimate from a state-policy table — verify with the county assessor before closing.
Climate risk First Street
- Flood 1/10 Low FEMA zone X (unshaded) · 0% chance over 30 yrs
- Wildfire 3/10 Moderate
- Heat 8/10 Severe 7 d/yr ≥107°F today · 17 d/yr by 30 yrs out
- Wind 8/10 Severe 80% chance of damaging wind over 30 yrs
- Air quality 3/10 Moderate 3 unhealthy d/yr today · 3 by 30 yrs out
Nearby sold comps map
Loading sold comps map…
Walkable amenities ~0.75 mi
Loading nearby amenities…
Taxation est. · year 1
- Rental income
- $15,483
- − Mortgage interest
- −$7,562
- − Property taxes
- −$1,372
- − Insurance
- −$675
- − Repairs & maintenance
- −$1,239
- − Management
- −$1,239
- − Depreciation
- −$3,927
- Taxable loss
- −$530
- Est. tax savings @ 24.0%
- +$127
- After-tax cash flow
- $1,817/yr
For passive investors: Depreciation is non-cash, so a rental often shows a tax loss while cash-flowing — sheltering income. Rental losses are passive: they offset passive income freely, and up to $25,000/yr can offset ordinary (W-2) income if you actively participate and your MAGI is under $100k (phasing out to $0 by $150k); unused losses carry forward. On sale, claimed depreciation is recaptured at up to 25%, and gains may owe capital-gains tax (a 1031 exchange can defer both). Figures are a year-1 estimate at your 24.0% rate — not tax advice; consult a CPA.
Schools (NCES district)
- District
- Pitt County Schools
- NCES district ID
- 3700012
- Math proficiency
- 41% ▬ 0.00%
- Reading proficiency
- 44% ▲ 2.00%
- Median HH income
- $40,631
- Composite
- 35.67/100
- National rank
- #4877
- State rank
- #100 of 178 in NC
Livability — Greenville
- Score
- 77/100
- State rank
- #30
- US rank
- #2977
Category grades
Schools grade is shown separately in the Schools card above.
Census & demographics
- Census place
- Greenville, NC
- County
- Pitt County · 142,592 people
- City population
- 115,121
- Metro
- Greenville, NC
- Population (ZIP)
- 56,347
- Household income
- $48,935
- Rent vs Own
- Severe rent burden
- 3319.0
Population outlook (Pitt County) Hauer SSP2
- Today (2025)
- 194,585 people
- By 2030
- 203,756 · +4.7%
- By 2040
- 220,807 · +13.5%
- By 2050
- 236,614 · +21.6%
- By 2075
- 275,940 · +41.8%
- By 2100
- 300,058 · +54.2%
Race, ethnicity, and origin ACS 2023
- Neighborhood character
- Diverse neighborhood (Simpson 0.59)
- Race & ethnicity
- Black 54% White 33% Hispanic / Latino 8% Two or more races 3% Asian 2%
- Hispanic origin (detail)
- Mexican 7%
- Common ancestry
- Lithuanian 1% Slovak 1% Romanian 1%
- Foreign-born
- 7% · Canada, China
- Languages at home
- 91% English-only · Spanish 6% Other Asian/Pacific 1%
Political lean MEDSL · Pitt
- 2024 margin
- Lean D (+6.0) · D 52.5% · R 46.5% · Other 1.1%
- 2008→2024 swing
- -2.8pp toward R · 2008: 8.8pp · 2024: 6.0pp
- All cycles
- 2024: D+6.0 2020: D+9.4 2016: D+7.4 2012: D+6.7 2008: D+8.8
Not yet ingested
- Civics
- —
Market trends
- HPI YoY
- ▼ -187.99%
- Current HPI
- 190.6869
- Rent YoY
- ▲ 5.44%
- Metro
- Greenville, NC
- State GDP YoY
- ▲ 3.28%
- F500 in state
- 26
Industry mix (Fortune 500 HQ in NC)
| Industry | F500 HQs | Revenue |
|---|---|---|
| Financial Services | 2 | $213B |
|
||
| Retail | 2 | $95B |
|
||
| Industrial Conglomerate | 1 | $38B |
|
||
| Metals / Steel | 1 | $35B |
|
||
| Utilities | 1 | $30B |
|
||
| Industrial Machinery | 1 | $19B |
|
||
Price history
+237.5% since first listed3 events — show timeline
- 2026-04-27 Listed $135,000 Hive MLS
- 2026-03-25 Sold (Public Records) $78,700 Public Records
- 1998-12-01 Sold (Public Records) $40,000 Public Records
Property tax history
+13.3%/yrLatest (2025): $1,372 · +0.9% YoY. Source: county tax records.
Cash-flow waterfall
monthlySold comps — $/sqft
last 12 mo · ≤1 miLoading sold comps…