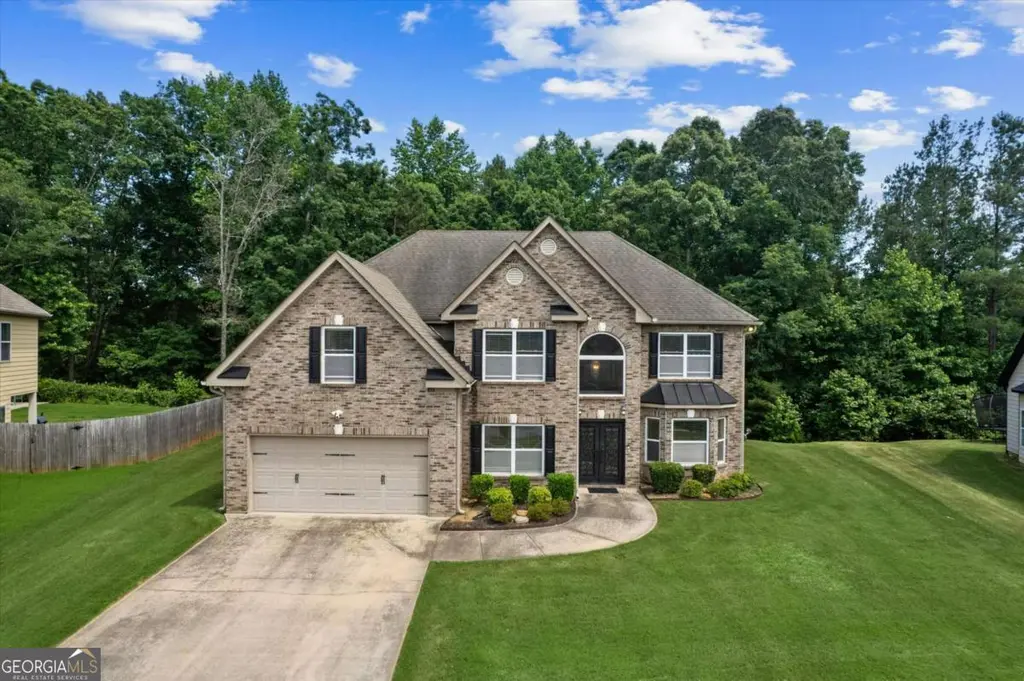
3995 Lucas Ln · Stonecrest, GA
Flood risk 1/10 · Minimal
- FEMA flood zone
- X (unshaded)
- Chance of flooding over 30 yrs
- 0.0%
- Est. flood insurance / yr
- $507 – $1,088
Fire risk 4/10 · Minor
- Est. fire insurance / yr
- $963 – $1,789
Heat risk 6/10 · Moderate
- Hot days now (above 106°F)
- 7 days/yr
- Hot days in 30 yrs
- 18 days/yr
Wind risk 4/10 · Minor
- Chance of severe wind over 30 yrs
- 24.0%
Air-quality risk 4/10 · Minor
- Unhealthy air days now
- 5 days/yr
- Unhealthy air days in 30 yrs
- 7 days/yr
Risk factors via First Street. Map © Google.
Why this score? — see what drove the D grade
The composite is a weighted blend of 9 inputs, each scored 0–100. Each bar is that input's sub-score; the figure is the points it added to the 100-point composite (weight × sub-score).
- Cash flow +14.6/30.0
- ARV discount +8.9/15.0
- DSCR +4.4/10.0
- Rent growth +3.6/5.0
- 1% rule +3.0/10.0
- Livability +2.5/5.0
- Condition / age +2.5/5.0
- Schools +2.1/10.0
- Appreciation +0.0/10.0
$405,000
🖨 Deal sheet 📄 Offer letter ✓ Due diligence
Listing remarks MLS
Welcome to 3995 Lucas Lane - where comfort, style, and value come together beautifully. This stunning home offers the perfect blend of modern updates and everyday functionality, featuring: - Upgraded cast iron French doors - Updated finishes and stylish details throughout - Beautiful foyer entry with upgraded flooring - Relaxing spa-like bathrooms with a jacuzzi tub - Exterior lighting that enhances curb appeal day and night - Generous yard space, perfect for entertaining or quiet evenings Enjoy spacious living areas designed with both comfort and entertaining in mind. Ideally located in the heart of Ellenwood, this home provides convenient access to major highways, shopping, and dining making it perfect for commuters and those who enjoy staying close to home.
Key facts
- Spa-like bathrooms
- Convenient access
- Exterior lighting
Tags
Property features AI
Finance
- Other: Road surface: asphalt; Directions: please use GPS; County: Dekalb, GA
- HOA & community: Homeowners association with $550 annual fee; Association fee includes grounds maintenance; Community located near shopping
Exterior
- Parking: Attached garage (2 spaces); Driveway parking; Garage faces front; Level driveway; Open parking available
- Utilities: Public water; Public sewer; 110-volt electric; Cable available; Electricity available; Sewer available; Water available
- Home design: Two levels; Brick-front with frame construction; Composition roof; Slab foundation; Resale property
- Construction: Brick front and frame construction; Composition roof; Slab foundation; Built with no common walls
- Exterior features: Private entrance; Patio
Interior
- Kitchen: Breakfast bar; Stained cabinets; Eat-in kitchen; Pantry; Solid surface countertops; Kitchen open to family room; Dishwasher; Electric range; Microwave; Disposal
- Bedrooms: Master bedroom on main level; One main-level bedroom; Four upper-level bedrooms
- Flooring: Carpet; Hardwood
- Bathrooms: Three full bathrooms; One half bathroom; Master bathroom with double vanity, separate tub and shower, and whirlpool tub
- Heating & cooling: Central heating; Heat pump; Hot water heating; Natural gas; Central air; Ceiling fans
- Interior features: Cathedral ceilings; Entrance foyer; High 9-ft ceilings on the lower level; Walk-in closets; Insulated windows; Factory-built fireplace in the family room
- Laundry & utility: Laundry on main level
Neighborhood map
What this means for you Summary
Snapshot
- This is a 5-bed/3.5-bath single-family listed at $405k.
Deal economics
- At list price, monthly cash flow is $96 ($1k/yr) — positive.
- The deal already cash-flows at list — no discount required.
- To meet the 1% rule (rent ≥ 1% of price), the offer needs to be $323k (20.4% below list).
- Recommended offer: $323k (20.4% below list) — sets the bar for 1% rule.
- Cap rate 6.6% vs local median 5.1% in Stonecrest — meaningfully above typical; check what's discounted (condition, days-on-market, listing class) to confirm the premium yield is real.
Location & tenants
- Location reads: area grade D — affects rentability + tenant quality, not the cash-flow math above.
- Dekalb County (suburban): math 19% / reading 28% proficiency, ranked #125 of 174 in GA (top 72%) — low school quality limits family demand, transient renter base, plan for 1-2y turnover; 68% free/reduced lunch — lower-income household profile, screen leases tightly.
- Zoned schools: Salem Middle School (math 5% / reading 16%, grade F, #429 of 470 statewide, top 91%, 988 students, 100% FRL); Martin Luther King- Jr. High School (math 8% / reading 22%, grade F, #297 of 424 statewide, top 74%, 1,440 students, 100% FRL) — zoned schools average 100% FRL vs 68% district-wide (32 pts higher); higher-poverty schools than district average — tighter screening recommended.
- Market conditions: Rents rising fast (+4.6%/yr); 244 active listings in the ZIP; 6 comparable units currently listed for rent nearby; rentals at typical pace (median 24d on market — plan ~3-4 weeks tenant-placement turnaround); solid renter incomes; 1,240 units permitted in DeKalb County in 2024 (385 in 5+ unit buildings).
- At $3,225/mo this rent would consume 49% of the median local household income ($80k/yr) (locally 864% of renters already pay >50% of income on rent) — very limited rent-growth headroom before tenants either downsize or default.
Forward outlook
- Local home prices are declining (-3.0%/yr); year-one equity from $3k of loan paydown is wiped out by about $12k of value loss. Plan a longer hold.
- DeKalb County population projected at +28% by 2050 — long-run rental-demand tailwind backs the buy-and-hold thesis.
Negotiation context
- Only 12 days on market — expect competitive offers; lowballing is unlikely to land.
- 10 sale attempts since 5y ago with the ask held roughly flat each time — persistent listings suggest the price (not the market) is what's stuck; bring a comps-based counter.
Risks & watch-outs
- Climate carrying-cost: extreme-heat days projected 7→18/yr by 2055 (HVAC capex compounding) — expect insurance premiums to compound above CPI over the hold.
Questions for the listing agent
- What does the HOA fee cover, when was the last increase, and are there any pending special assessments or reserve-fund shortfalls?
- Is there a deadline driving the sale (1031 exchange, divorce, estate, relocation)? That informs how much negotiation room exists.
- The area grade is low — what's the realistic commute time and amenity access for the typical tenant pool here? Any planned neighborhood developments (good or bad) we should know about?
- What's the average days-on-market for RENTAL listings here right now (not sales)? A rising rental-DOM trend means longer vacancies and softer asking-rent achievability than the comps imply.
- What's the recent tenant-quality profile in this submarket — average credit score on applications, eviction rate, late-payment / NSF rate, and stable-employment percentage? A property-management company in the area should have these aggregated.
- How much new for-sale + rental construction is in the pipeline within 1–3 miles? Heavy new supply typically softens prices + rents 12–24 months out; constrained supply supports both.
Investment metrics
- 1% rule
- 0.80% ✗
- Cap rate
- 6.58%
- Cash-on-cash
- 1.01%
- DSCR
- 1.04
- GRM
- 10.5
CMA / ARV
- ARV (on-the-fly)
- $417,928
- Comps found
- 12
Show comp detail 12 sales within ~0.75 mi
| Address | Dist | Beds/Ba | Sqft | Sold | Price | $/sf | Match |
|---|---|---|---|---|---|---|---|
| 4798 Macy Way | 0.11mi | 5/4.0 | 3,581 (+2%) | 1mo | $425,000 | $119 | 89 |
| 4024 Lucas Ln | 0.07mi | 5/3.0 | 3,306 (-6%) | 14mo | $414,111 | $125 | 73 |
| 3736 Busker Mill Ln | 0.52mi | 5/3.5 | 3,748 (+7%) | 4mo | $415,000 | $111 | 61 |
| 4588 Carissa Ct | 0.35mi | 4/4.0 (-1) | 3,878 (+10%) | 1mo | $420,000 | $108 | 58 |
| 3975 Broadleaf Walk | 0.42mi | 5/4.0 | 3,204 (-9%) | 11mo | $350,300 | $109 | 54 |
| 3963 Lucas Ln | 0.07mi | 4/2.5 (-1) | 3,014 (-14%) | 13mo | $382,500 | $127 | 53 |
| 4526 Warren Mill Trl | 0.66mi | 5/4.0 | 3,580 (+2%) | 14mo | $438,000 | $122 | 52 |
| 4549 Clarks Creek Ter | 0.46mi | 4/3.0 (-1) | 3,202 (-9%) | 10mo | $357,000 | $111 | 49 |
| 510 Bowden Dr | 0.51mi | 4/2.5 (-1) | 3,097 (-12%) | 1mo | $370,000 | $119 | 46 |
| 4094 S River Ln | 0.49mi | 5/3.0 | 3,109 (-12%) | 15mo | $345,000 | $111 | 44 |
| 4863 Amsler Rd | 0.72mi | 4/3.5 (-1) | 3,768 (+7%) | 12mo | $507,000 | $135 | 39 |
| 4704 Mayer Trce | 0.72mi | 4/2.5 (-1) | 3,095 (-12%) | 0mo | $354,900 | $115 | 38 |
Match score weights: distance 35% · size 25% · config 20% · recency 20%. Top-matched comps best support the ARV.
Projected returns pro-forma
-3.0% appreciation · 4.56% rent growth · sell at horizon
- IRR
- -13.2%
- Equity multiple
- 0.52×
- Total profit
- $-54,567
- Equity at exit
- $60,387
- IRR
- -2.3%
- Equity multiple
- 0.84×
- Total profit
- $-18,571
- Equity at exit
- $35,017
Cash invested: $113,400 (down + closing). Projections, not guarantees.
Landlord ↔ Tenant lean methodology
- Overall (STATE)
- 90 Strongly Landlord-Friendly
- State Georgia
- 90 Strongly Landlord-Friendly · R+3
- County
- — inherits STATE
- City
- — inherits STATE
ZIP-level market 30294
- Home prices YoY
- -25.0%
- Rents YoY
- 4.6%
- Active inventory
- 244
- Price-to-rent
- 10.5×
Monthly cashflow live
- Estimated rent
- $3,225 high interval (Pro) →
- Mortgage (P&I)
- −$2,124
- Tax from tax record
- −$114 /mo · $1,366/yr
- Insurance
- −$169
- HOA
- −$46
- Vacancy / Maint / Mgmt
- −$677
- Net cashflow
- $96
Break-even live
UW: 25.0% down · 7.5% · 30yr · 1.5% tax · 5.0% vac · 8.0% maint · 8.0% mgmt
Financing live
Cash to close
- Down payment
- $101,250
- Closing costs
- $12,150
- Reserves months
- —
- Total cash needed
- —
Loan-product check · same deal, 3 products live
Conventional
25% down · 7.5% · 30yr
- Down + closing
- —
- Monthly P&I
- —
- Monthly cashflow
- —
- DSCR
- —
- Eligible?
- —
Personal DTI + credit; lowest rate.
DSCR
20% down · 8.5% · 30yr
- Down + closing
- —
- Monthly P&I
- —
- Monthly cashflow
- —
- DSCR
- —
- Eligible?
- —
No personal income docs; deal must DSCR.
Hard money
10% down · 12.0% · 12mo
- Down + closing
- —
- Monthly P&I
- —
- Monthly cashflow
- —
- DSCR
- —
- Eligible?
- —
Short-term bridge; refi at stabilization.
Rent comps 6 comps
| Address | Beds | Baths | Sqft | Rent | $/sqft | DOM | Units | Dist |
|---|---|---|---|---|---|---|---|---|
| 4267 Azalea Walk Ellenwood, GA | 4.0 | 2.5 | 2912 | $2,890 | $0.99 | 24d | 1 | 0.72mi |
| 4611 River Rd Ellenwood, GA | 4.0 | 4.0 | 2564 | $2,181 | $0.85 | 24d | 1 | 0.77mi |
| 4402 Income Cir Ellenwood, GA | 5.0 | 4.5 | 4056 | $5,500 | $1.36 | 12d | 1 | 1.04mi |
| 4000 Wychwood Ln Ellenwood, GA | 4.0 | 2.5 | 2535 | $2,535 | $1.00 | 12d | 1 | 1.04mi |
| 3948 English Valley Dr Ellenwood, GA | 4.0 | 3.0 | 2492 | $2,590 | $1.04 | 12d | 1 | 1.17mi |
| 118 Gabion Loop Ellenwood, GA | 4.0 | 2.5 | 2564 | $2,500 | $0.98 | 24d | 1 | 1.32mi |
HOA detail
- Monthly dues
- $46 · $552/yr
Listing history 9 events
-
2026-06-18days on market $405,000 Active 12 DOM
-
2026-06-17days on market $405,000 Active 11 DOM
-
2026-06-16days on market $405,000 Active 10 DOM
-
2026-06-15days on market $405,000 Active 9 DOM
-
2026-06-13days on market $405,000 Active 7 DOM
-
2026-06-09days on market $405,000 Active 3 DOM
-
2026-06-08days on market $405,000 Active 2 DOM
-
2026-06-07remarks 693-char remark
-
2026-06-07$405,000 Active 1 DOM
ⓘ Source: listings_history table (triggers on properties + properties_extension) + one-shot
backfill from property_details.listing_events for pre-trigger history.
Tax reassessment forecast GA · Resets to sale price
- Current annual tax
- $1,366 · $114/mo
- Projected year-2 tax
- $3,726 · $310/mo
- Expected delta
- +$2,360/yr (+$197/mo · 172.8%)
ⓘ Screening estimate from a state-policy table — verify with the county assessor before closing.
Climate risk First Street
- Flood 1/10 Low FEMA zone X (unshaded) · 0% chance over 30 yrs
- Wildfire 4/10 Moderate
- Heat 6/10 Major 7 d/yr ≥106°F today · 18 d/yr by 30 yrs out
- Wind 4/10 Moderate 24% chance of damaging wind over 30 yrs
- Air quality 4/10 Moderate 5 unhealthy d/yr today · 7 by 30 yrs out
Nearby sold comps map
Loading sold comps map…
Walkable amenities ~0.75 mi
Loading nearby amenities…
Taxation est. · year 1
- Rental income
- $38,703
- − Mortgage interest
- −$22,686
- − Property taxes
- −$1,366
- − Insurance
- −$2,025
- − Repairs & maintenance
- −$3,096
- − Management
- −$3,096
- − HOA
- −$552
- − Depreciation
- −$11,782
- Taxable loss
- −$5,900
- Est. tax savings @ 24.0%
- +$1,416
- After-tax cash flow
- $2,562/yr
For passive investors: Depreciation is non-cash, so a rental often shows a tax loss while cash-flowing — sheltering income. Rental losses are passive: they offset passive income freely, and up to $25,000/yr can offset ordinary (W-2) income if you actively participate and your MAGI is under $100k (phasing out to $0 by $150k); unused losses carry forward. On sale, claimed depreciation is recaptured at up to 25%, and gains may owe capital-gains tax (a 1031 exchange can defer both). Figures are a year-1 estimate at your 24.0% rate — not tax advice; consult a CPA.
Schools (NCES district)
- District
- Dekalb County
- NCES district ID
- 1301740
- Math proficiency
- 19% ▼ -12.00%
- Reading proficiency
- 28% ▼ -7.00%
- Median HH income
- $51,448
- Composite
- 20.92/100
- National rank
- #8482
- State rank
- #125 of 174 in GA
Livability — Stonecrest
No livability data for this city. (Only ~50 U.S. cities are tracked.)
Census & demographics
- County
- Henry County · 316,359 people
- City population
- 106,165
- Metro
- Atlanta-Sandy Springs-Alpharetta, GA
- Population (ZIP)
- 41,983
- Household income
- $79,762
- Rent vs Own
- Severe rent burden
- 864.0
Population outlook (DeKalb County) Hauer SSP2
- Today (2025)
- 839,977 people
- By 2030
- 891,768 · +6.2%
- By 2040
- 988,894 · +17.7%
- By 2050
- 1,074,583 · +27.9%
- By 2075
- 1,245,026 · +48.2%
- By 2100
- 1,303,135 · +55.1%
Race, ethnicity, and origin ACS 2023
- Neighborhood character
- Predominantly Black (84%)
- Race & ethnicity
- Black 84% Hispanic / Latino 7% Two or more races 6% White 6% Asian 1%
- Hispanic origin (detail)
- Mexican 6%
- Common ancestry
- Hispanic 1%
- Foreign-born
- 7% · Canada, Vietnam
- Languages at home
- 91% English-only · Spanish 6% Vietnamese 1% French/Haitian/Cajun 1%
Political lean MEDSL · DeKalb
- 2024 margin
- Solid D (+64.8) · D 81.9% · R 17.1% · Other 1.0%
- 2008→2024 swing
- +6.1pp toward D · 2008: 58.6pp · 2024: 64.8pp
- All cycles
- 2024: D+64.8 2020: D+67.4 2016: D+64.8 2012: D+56.8 2008: D+58.6
Not yet ingested
- Civics
- —
Market trends
- HPI YoY
- ▼ -70.99%
- Current HPI
- 213.1999
- Rent YoY
- ▲ 4.56%
- Metro
- Atlanta-Sandy Springs-Alpharetta, GA
- State GDP YoY
- ▲ 2.66%
- F500 in state
- 28
Industry mix (Fortune 500 HQ in GA)
| Industry | F500 HQs | Revenue |
|---|---|---|
| Paper / Packaging | 2 | $29B |
|
||
| Retail | 1 | $160B |
|
||
| Transportation / Logistics | 1 | $91B |
|
||
| Airlines | 1 | $62B |
|
||
| Consumer Goods | 1 | $47B |
|
||
| Utilities | 1 | $25B |
|
||
Price history
+19.1% since first listed25 events — show timeline
- 2026-06-06 Listed $405,000 FMLS
- 2026-06-06 Listed $405,000 GAMLS
- 2021-09-13 Sold (MLS) $360,000 GAMLS
- 2021-09-13 Sold (MLS) $360,000 FMLS
- 2021-08-11 Pending — FMLS
- 2021-07-30 Contingent — FMLS
- 2021-07-30 Pending — GAMLS
- 2021-07-25 Price Changed $355,000 GAMLS
- 2021-07-25 Price Changed $355,000 FMLS
- 2021-07-25 Relisted — FMLS
- 2021-07-25 Relisted — GAMLS
- 2021-07-11 Contingent — FMLS
- 2021-07-11 Pending — GAMLS
- 2021-07-06 Relisted — FMLS
- 2021-07-06 Relisted — GAMLS
- 2021-07-02 Contingent — FMLS
- 2021-07-02 Pending — GAMLS
- 2021-06-29 Relisted — GAMLS
- 2021-06-29 Relisted — FMLS
- 2021-06-24 Contingent — FMLS
- 2021-06-24 Pending — GAMLS
- 2021-06-16 Price Changed $365,000 GAMLS
- 2021-06-16 Price Changed $365,000 FMLS
- 2021-06-08 Listed $340,000 GAMLS
- 2021-06-08 Listed $340,000 FMLS
Property tax history
+1.7%/yrLatest (2025): $1,366 · -71.3% YoY. Source: county tax records.
Cash-flow waterfall
monthlySold comps — $/sqft
last 12 mo · ≤1 miLoading sold comps…