22930 Hardy Ln · St. Robert, MO
Flood risk 1/10 · Minimal
- FEMA flood zone
- X (unshaded)
- Chance of flooding over 30 yrs
- 0.0%
- Est. flood insurance / yr
- $507 – $1,088
Fire risk 4/10 · Minor
- Est. fire insurance / yr
- $1,054 – $1,958
Heat risk 4/10 · Minor
- Hot days now (above 106°F)
- 7 days/yr
- Hot days in 30 yrs
- 19 days/yr
Wind risk 2/10 · Minimal
- Chance of severe wind over 30 yrs
- 1.0%
Air-quality risk 1/10 · Minimal
- Unhealthy air days now
- 0 days/yr
- Unhealthy air days in 30 yrs
- 0 days/yr
Risk factors via First Street. Map © Google.
Why this score? — see what drove the B grade
The composite is a weighted blend of 9 inputs, each scored 0–100. Each bar is that input's sub-score; the figure is the points it added to the 100-point composite (weight × sub-score).
- Cash flow +30.0/30.0
- 1% rule +10.0/10.0
- DSCR +10.0/10.0
- ARV discount +7.5/15.0
- Rent growth +5.0/5.0
- Schools +4.2/10.0
- Livability +2.5/5.0
- Condition / age +2.5/5.0
- Appreciation +0.0/10.0
$80,000
🖨 Deal sheet (PDF) 📄 Offer letter ✓ Due diligence
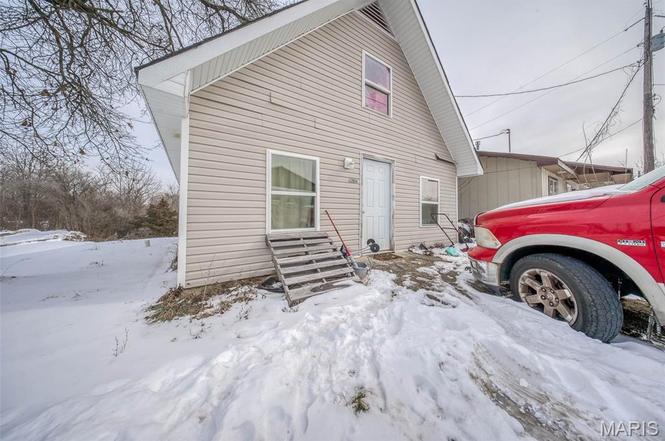
Listing remarks
This 3-bedroom, 1-bath home is ideally located near shopping, dining, and everyday conveniences, making it a desirable rental property. Currently tenant-occupied, it provides immediate rental income and presents an excellent opportunity for investors looking to expand their portfolio. With its prime location and strong rental potential, this property is well positioned to deliver consistent returns. Don’t miss this solid investment opportunity.
Key facts
- 7,840 sq ft lot
- Built 1970
- Listed 142 days
Property features AI
Exterior
- Utilities: Public water; Public sewer; 220 volt electric service; Electricity connected, Water connected, Sewer connected
- Home design: Single family residence; House with one and one-half levels; Private ownership
- Construction: Frame construction; Architectural shingle roof
- Exterior features: Front yard; Back yard; Gravel road frontage on a county road
Interior
- Kitchen: Range; Refrigerator; Kitchen facilities
- Bedrooms: 3 bedrooms total (1 on the main level, 2 on the upper level)
- Flooring: Varies
- Bathrooms: 1 full bathroom
- Heating & cooling: Baseboard heating (electric); Wall/window air conditioning units
- Interior features: Range, Refrigerator, Electric water heater; Lighting; Varied flooring
- Laundry & utility: Washer hookup; Electric dryer hookup
Neighborhood map
What this means for you Summary
Snapshot
- This is a 3-bed/1.0-bath single-family listed at $80k.
Deal economics
- At list price, monthly cash flow is $520 ($6k/yr) — positive.
- The deal already cash-flows at list — no discount required.
- Meets the 1% rule at list price ($1k rent vs $80k).
- Recommended offer: $70k (12.0% below list) — sets the bar for market timing.
- Cap rate 14.1% vs local median 4.5% in St. Robert — top-decile yield for the area; either an underpriced asset or a hidden risk that comps aren't pricing in. Stress-test before assuming the spread holds.
Location & tenants
- Location reads: area grade B — affects rentability + tenant quality, not the cash-flow math above.
- Waynesville R-VI (town): math 46% / reading 53% proficiency, ranked #41 of 324 in MO (top 13%) — families likely to look elsewhere, expect single-tenant / working-renter base with shorter leases.
- Zoned schools: Waynesville East Elem. (math 51% / reading 53%, grade C-, #231 of 1,115 statewide, top 24%, 929 students, 44% FRL); Waynesville Middle (math 43% / reading 59%, grade C, #62 of 391 statewide, top 16%, 865 students, 45% FRL); Waynesville Sr. High (math 37% / reading 53%, grade D-, #176 of 521 statewide, top 34%, 1,704 students, 39% FRL).
- Market conditions: Rents rising fast (+10.2%/yr); 132 active listings in the ZIP; 62 units permitted in Pulaski County in 2024 (0 in 5+ unit buildings).
Forward outlook
- Local home prices are declining (-3.0%/yr); year-one equity from $553 of loan paydown is wiped out by about $2k of value loss. Plan a longer hold.
- At projected returns (-3.0% appreciation + 8.0% rent growth), your $22k cash investment doubles in ~4 years — after that, you're playing with house money.
Negotiation context
- It's been on market 143 days — a 12% lower offer ($70k) is reasonable based on typical stale-listing flexibility.
- 2 sale attempts since 2y ago with the ask held roughly flat each time — persistent listings suggest the price (not the market) is what's stuck; bring a comps-based counter.
Questions for the listing agent
- It's been on market 143 days. Have you received any prior offers? Is the seller open to a 12% concession, seller financing, or rate buy-down credit?
- Built in 1970 — when were the roof, HVAC, electrical panel, plumbing, and water heater last replaced?
- Why hasn't it sold? Are there any deal-killer items the seller is aware of (foundation, flood, title, zoning, code violations)?
- Is there a deadline driving the sale (1031 exchange, divorce, estate, relocation)? That informs how much negotiation room exists.
- What's the average days-on-market for RENTAL listings here right now (not sales)? A rising rental-DOM trend means longer vacancies and softer asking-rent achievability than the comps imply.
- What's the recent tenant-quality profile in this submarket — average credit score on applications, eviction rate, late-payment / NSF rate, and stable-employment percentage? A property-management company in the area should have these aggregated.
- How much new for-sale + rental construction is in the pipeline within 1–3 miles? Heavy new supply typically softens prices + rents 12–24 months out; constrained supply supports both.
Investment metrics
- 1% rule
- 1.70% ✓
- Cap rate
- 14.09%
- Cash-on-cash
- 27.85%
- DSCR
- 2.24
- GRM
- 4.9
CMA / ARV
No comps found within radius.
Projected returns pro-forma
-3.0% appreciation · 8.0% rent growth · sell at horizon
- IRR
- 27.5%
- Equity multiple
- 2.22×
- Total profit
- $27,337
- Equity at exit
- $11,928
- IRR
- 37.9%
- Equity multiple
- 5.43×
- Total profit
- $99,175
- Equity at exit
- $6,917
Cash invested: $22,400 (down + closing). Projections, not guarantees.
Landlord ↔ Tenant lean methodology
- Overall (STATE)
- 81 Strongly Landlord-Friendly
- State Missouri
- 81 Strongly Landlord-Friendly · R+10
- County
- — inherits STATE
- City
- — inherits STATE
ZIP-level market 65584
- Home prices YoY
- -18.8%
- Rents YoY
- 10.2%
- Active inventory
- 132
- Price-to-rent
- 4.9×
Monthly cashflow live
- Estimated rent
- $1,358 medium interval (Pro) →
- Mortgage (P&I)
- −$420
- Tax est. 1.5%
- −$100 /mo · $1,200/yr
- Insurance
- −$33
- HOA
- −$0
- Vacancy / Maint / Mgmt
- −$285
- Net cashflow
- $520
Break-even live
Sensitivity live
| Price | -10% $575 | -5% $547 | +0% $520 | +5% $492 | +10% $464 |
|---|---|---|---|---|---|
| Rent | -10% $413 | -5% $466 | +0% $520 | +5% $573 | +10% $627 |
| Rate | -1.0pp $560 | -0.5pp $540 | base $520 | +0.5pp $499 | +1.0pp $478 |
UW: 25.0% down · 7.5% · 30yr · 1.5% tax · 5.0% vac · 8.0% maint · 8.0% mgmt
Financing live
Cash to close
- Down payment
- $20,000
- Closing costs
- $2,400
- Reserves months
- —
- Total cash needed
- —
Loan-product check · same deal, 3 products live
Conventional
25% down · 7.5% · 30yr
- Down + closing
- —
- Monthly P&I
- —
- Monthly cashflow
- —
- DSCR
- —
- Eligible?
- —
Personal DTI + credit; lowest rate.
DSCR
20% down · 8.5% · 30yr
- Down + closing
- —
- Monthly P&I
- —
- Monthly cashflow
- —
- DSCR
- —
- Eligible?
- —
No personal income docs; deal must DSCR.
Hard money
10% down · 12.0% · 12mo
- Down + closing
- —
- Monthly P&I
- —
- Monthly cashflow
- —
- DSCR
- —
- Eligible?
- —
Short-term bridge; refi at stabilization.
Listing history 19 events
-
2026-06-22days on market $80,000 Active 143 DOM
-
2026-06-21days on market $80,000 Active 142 DOM
-
2026-06-19days on market $80,000 Active 140 DOM
-
2026-06-18days on market $80,000 Active 139 DOM
-
2026-06-17days on market $80,000 Active 138 DOM
-
2026-06-16days on market $80,000 Active 137 DOM
-
2026-06-15days on market $80,000 Active 136 DOM
-
2026-06-14days on market $80,000 Active 134 DOM
-
2026-06-12days on market $80,000 Active 133 DOM
-
2026-06-09days on market $80,000 Active 130 DOM
-
2026-06-08days on market $80,000 Active 129 DOM
-
2026-06-07days on market $80,000 Active 128 DOM
-
2026-06-07days on market $80,000 Active 127 DOM
-
2026-06-02days on market $80,000 Active 123 DOM
-
2026-06-01days on market $80,000 Active 122 DOM
-
2026-05-31days on market $80,000 Active 121 DOM
-
2026-05-30days on market $80,000 Active 120 DOM
-
2026-01-30$80,000 Active
-
2024-12-06$105,000 Active
ⓘ Source: listings_history table (triggers on properties + properties_extension) + one-shot
backfill from property_details.listing_events for pre-trigger history.
Climate risk First Street
- Flood 1/10 Low FEMA zone X (unshaded) · 0% chance over 30 yrs
- Wildfire 4/10 Moderate
- Heat 4/10 Moderate 7 d/yr ≥106°F today · 19 d/yr by 30 yrs out
- Wind 2/10 Low 100% chance of damaging wind over 30 yrs
- Air quality 1/10 Low 0 unhealthy d/yr today · 0 by 30 yrs out
Nearby sold comps map
Loading sold comps map…
Walkable amenities ~0.75 mi
Loading nearby amenities…
Taxation est. · year 1
- Rental income
- $16,293
- − Mortgage interest
- −$4,481
- − Property taxes
- −$1,200
- − Insurance
- −$400
- − Repairs & maintenance
- −$1,303
- − Management
- −$1,303
- − Depreciation
- −$2,327
- Taxable income
- $5,278
- Est. tax owed @ 24.0%
- −$1,267
- After-tax cash flow
- $4,971/yr
For passive investors: Depreciation is non-cash, so a rental often shows a tax loss while cash-flowing — sheltering income. Rental losses are passive: they offset passive income freely, and up to $25,000/yr can offset ordinary (W-2) income if you actively participate and your MAGI is under $100k (phasing out to $0 by $150k); unused losses carry forward. On sale, claimed depreciation is recaptured at up to 25%, and gains may owe capital-gains tax (a 1031 exchange can defer both). Figures are a year-1 estimate at your 24.0% rate — not tax advice; consult a CPA.
Schools (NCES district)
- District
- Waynesville R-VI
- NCES district ID
- 2931440
- Math proficiency
- 46% ▼ -1.00%
- Reading proficiency
- 53% ▼ -1.00%
- Median HH income
- $50,147
- Composite
- 42.36/100
- National rank
- #3246
- State rank
- #41 of 324 in MO
Livability — St. Robert
No livability data for this city. (Only ~50 U.S. cities are tracked.)
Census & demographics
- County
- Pulaski County · 25,264 people
- Metro
- Fort Leonard Wood, MO
- Population (ZIP)
- 10,553
- Household income
- $63,328
- Rent vs Own
- Severe rent burden
- 368.0
Population outlook (Pulaski County) Hauer SSP2
- Today (2025)
- 54,214 people
- By 2030
- 54,723 · +0.9%
- By 2040
- 54,885 · +1.2%
- By 2050
- 55,467 · +2.3%
- By 2075
- 58,576 · +8.0%
- By 2100
- 61,179 · +12.8%
Race, ethnicity, and origin ACS 2023
- Neighborhood character
- Diverse neighborhood (Simpson 0.56)
- Race & ethnicity
- White 65% Two or more races 15% Hispanic / Latino 11% Black 10% Asian 4%
- Hispanic origin (detail)
- Mexican 2% Puerto Rican 4%
- Common ancestry
- Slovak 3% Lithuanian 2% Italian 2%
- Foreign-born
- 6% · South Korea, Canada, China
- Languages at home
- 85% English-only · Spanish 5% German/W. Germanic 4% Korean 4%
Political lean MEDSL · Pulaski
- 2024 margin
- Solid R (+50.3) · D 24.2% · R 74.5% · Other 1.3%
- 2008→2024 swing
- -21.6pp toward R · 2008: -28.7pp · 2024: -50.3pp
- All cycles
- 2024: R+50.3 2020: R+45.7 2016: R+51.7 2012: R+36.1 2008: R+28.7
Not yet ingested
- Civics
- —
Market trends
- HPI YoY
- ▼ -30.16%
- Current HPI
- 130.0726
- Rent YoY
- ▲ 10.20%
- Metro
- Fort Leonard Wood, MO
- State GDP YoY
- ▲ 1.84%
- F500 in state
- 20
Industry mix (Fortune 500 HQ in MO)
| Industry | F500 HQs | Revenue |
|---|---|---|
| Healthcare | 1 | $163B |
|
||
| Insurance | 1 | $21B |
|
||
| Industrial Technology | 1 | $17B |
|
||
| Retail | 1 | $16B |
|
||
| Industrial Distribution | 1 | $10B |
|
||
| Utilities | 1 | $9B |
|
||
Price history
-23.8% since first listed2 events — show timeline
- 2026-01-30 Listed $80,000 MARIS as Distributed by MLS Grid
- 2024-12-06 Listed $105,000 MARIS as Distributed by MLS Grid
Cash-flow waterfall
monthlySold comps — $/sqft
last 12 mo · ≤1 miLoading sold comps…