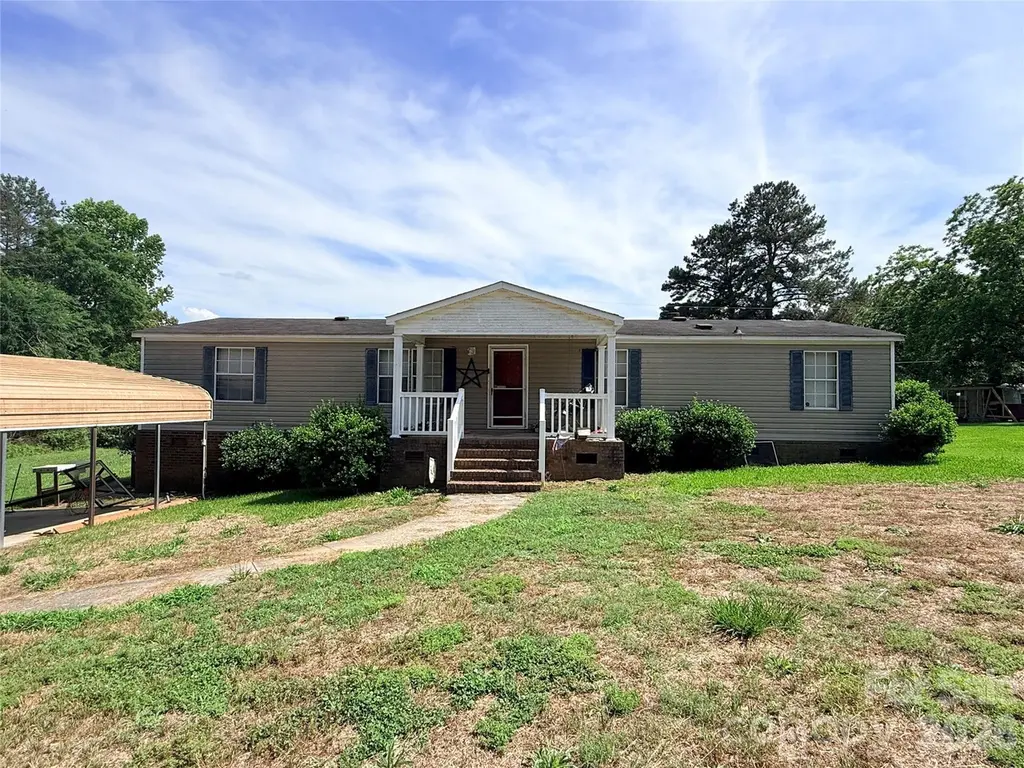
1796 Deaton Dr · Lancaster, SC
Flood risk 1/10 · Minimal
- FEMA flood zone
- X (unshaded)
- Chance of flooding over 30 yrs
- 0.0%
- Est. flood insurance / yr
- $507 – $1,088
Fire risk 1/10 · Minimal
- Est. fire insurance / yr
- $783 – $1,453
Heat risk 6/10 · Moderate
- Hot days now (above 106°F)
- 7 days/yr
- Hot days in 30 yrs
- 16 days/yr
Wind risk 6/10 · Moderate
- Chance of severe wind over 30 yrs
- 51.0%
Air-quality risk 2/10 · Minimal
- Unhealthy air days now
- 2 days/yr
- Unhealthy air days in 30 yrs
- 2 days/yr
Risk factors via First Street. Map © Google.
Why this score? — see what drove the C+ grade
The composite is a weighted blend of 9 inputs, each scored 0–100. Each bar is that input's sub-score; the figure is the points it added to the 100-point composite (weight × sub-score).
- Cash flow +27.1/30.0
- DSCR +9.4/10.0
- ARV discount +7.5/15.0
- 1% rule +6.0/10.0
- Schools +3.7/10.0
- Livability +2.8/5.0
- Rent growth +2.5/5.0
- Condition / age +2.5/5.0
- Appreciation +0.0/10.0
$160,000
🖨 Deal sheet (PDF) 📄 Offer letter ✓ Due diligence
Listing remarks
3 bedroom, 2 bath double wide featuring a split-bedroom floor plan, spacious living room plus separate den, and cathedral ceilings in the main living area. The kitchen offers ample cabinet space and opens to the living areas for an easy flow. Enjoy the covered front porch and manageable . 25-acre lot with convenient outdoor space. Great opportunity for buyers looking to make a home their own or add to an investment portfolio.
Key facts
- Covered front porch
- Separate den
- Cathedral ceilings
Tags
Property features AI
Finance
- HOA & community: No HOA
Exterior
- Parking: Detached carport; Metal carport; Driveway
- Utilities: County water; County sewer
- Home design: Manufactured doublewide single-family residence; One level; Crawl space foundation
- Construction: Vinyl exterior; Manufactured construction
- Exterior features: Front porch; Concrete and paved road access; Publicly maintained road
Interior
- Kitchen: Electric range
- Bedrooms: 3 bedrooms on the main level
- Bathrooms: 2 full bathrooms on the main level
- Heating & cooling: Electric heating; Central air conditioning
- Interior features: Den with fireplace; 8 total rooms
- Laundry & utility: Dedicated laundry room
Neighborhood map
What this means for you Summary
Snapshot
- This is a 4-bed/2.0-bath manufactured listed at $160k.
Deal economics
- At list price, monthly cash flow is $455 ($5k/yr) — positive.
- The deal already cash-flows at list — no discount required.
- Meets the 1% rule at list price ($2k rent vs $160k).
- Recommended offer: $158k (1.5% below list) — sets the bar for market timing.
- Cap rate 9.7% vs local median 3.5% in Lancaster — top-decile yield for the area; either an underpriced asset or a hidden risk that comps aren't pricing in. Stress-test before assuming the spread holds.
Location & tenants
- Location reads 55/100 on livability (#301 in SC) — a working-class tenant base; expect higher turnover. Strengths: cost of living A+, housing B+; Watch: crime F, amenities F, commute F.
- Lancaster 01 (rural): math 41% / reading 47% proficiency, ranked #26 of 80 in SC (top 32%) — families likely to look elsewhere, expect single-tenant / working-renter base with shorter leases.
- Zoned schools: Erwin Elementary (math 17% / reading 17%, grade F, #515 of 597 statewide, top 89%, 411 students, 100% FRL); Lancaster High (math 17% / reading 70%, grade F, #171 of 196 statewide, top 87%, 1,463 students, 86% FRL) — zoned schools average 93% FRL vs 47% district-wide (46 pts higher); higher-poverty schools than district average — tighter screening recommended.
- Zoned-school proficiency averages 30% at this address vs 44% district-wide (-14 pts) — the specific schools serving this property underperform the Lancaster 01 average; the district grade overstates school quality for this exact location.
- Market conditions: 685 active listings in the ZIP; 976 units permitted in Lancaster County in 2024 (0 in 5+ unit buildings).
- This rent runs 34% of the median local income ($63k/yr) — at the standard rent-burdened threshold; future hikes will face affordability resistance.
Forward outlook
- Local home prices are declining (-3.0%/yr); year-one equity from $1k of loan paydown is wiped out by about $5k of value loss. Plan a longer hold.
- Lancaster County population projected at +40% by 2050 — long-run rental-demand tailwind backs the buy-and-hold thesis.
- At projected returns (-3.0% appreciation + 3.0% rent growth), your $45k cash investment doubles in ~10 years — after that, you're playing with house money.
Negotiation context
- It's been on market 23 days — a 2% lower offer ($158k) is reasonable based on typical stale-listing flexibility.
Risks & watch-outs
- Climate carrying-cost: major wind risk, 51% chance of damaging wind over 30y; extreme-heat days projected 7→16/yr by 2055 (HVAC capex compounding) — expect insurance premiums to compound above CPI over the hold.
Questions for the listing agent
- Is there a deadline driving the sale (1031 exchange, divorce, estate, relocation)? That informs how much negotiation room exists.
- Crime grade is F in this area — have there been break-ins, vandalism, or insurance claims at this property in the last 3 years? What carrier currently insures it and at what premium?
- What's the average days-on-market for RENTAL listings here right now (not sales)? A rising rental-DOM trend means longer vacancies and softer asking-rent achievability than the comps imply.
- What's the recent tenant-quality profile in this submarket — average credit score on applications, eviction rate, late-payment / NSF rate, and stable-employment percentage? A property-management company in the area should have these aggregated.
- How much new for-sale + rental construction is in the pipeline within 1–3 miles? Heavy new supply typically softens prices + rents 12–24 months out; constrained supply supports both.
Investment metrics
- 1% rule
- 1.10% ✓
- Cap rate
- 9.70%
- Cash-on-cash
- 12.18%
- DSCR
- 1.54
- GRM
- 7.6
CMA / ARV
No comps found within radius.
Projected returns pro-forma
-3.0% appreciation · 3.0% rent growth · sell at horizon
- IRR
- 1.7%
- Equity multiple
- 1.07×
- Total profit
- $2,962
- Equity at exit
- $23,857
- IRR
- 11.3%
- Equity multiple
- 1.88×
- Total profit
- $39,565
- Equity at exit
- $13,834
Cash invested: $44,800 (down + closing). Projections, not guarantees.
Landlord ↔ Tenant lean methodology
- Overall (STATE)
- 90 Strongly Landlord-Friendly
- State South Carolina
- 90 Strongly Landlord-Friendly · R+6
- County
- — inherits STATE
- City
- — inherits STATE
ZIP-level market 29720
- Home prices YoY
- -28.2%
- Active inventory
- 685
- Price-to-rent
- 7.6×
Monthly cashflow live
- Estimated rent
- $1,762 medium interval (Pro) →
- Mortgage (P&I)
- −$839
- Tax from tax record
- −$32 /mo · $378/yr
- Insurance
- −$67
- HOA
- −$0
- Vacancy / Maint / Mgmt
- −$370
- Net cashflow
- $455
Break-even live
Sensitivity live
| Price | -10% $545 | -5% $500 | +0% $455 | +5% $410 | +10% $364 |
|---|---|---|---|---|---|
| Rent | -10% $316 | -5% $385 | +0% $455 | +5% $524 | +10% $594 |
| Rate | -1.0pp $535 | -0.5pp $495 | base $455 | +0.5pp $413 | +1.0pp $371 |
UW: 25.0% down · 7.5% · 30yr · 1.5% tax · 5.0% vac · 8.0% maint · 8.0% mgmt
Financing live
Cash to close
- Down payment
- $40,000
- Closing costs
- $4,800
- Reserves months
- —
- Total cash needed
- —
Loan-product check · same deal, 3 products live
Conventional
25% down · 7.5% · 30yr
- Down + closing
- —
- Monthly P&I
- —
- Monthly cashflow
- —
- DSCR
- —
- Eligible?
- —
Personal DTI + credit; lowest rate.
DSCR
20% down · 8.5% · 30yr
- Down + closing
- —
- Monthly P&I
- —
- Monthly cashflow
- —
- DSCR
- —
- Eligible?
- —
No personal income docs; deal must DSCR.
Hard money
10% down · 12.0% · 12mo
- Down + closing
- —
- Monthly P&I
- —
- Monthly cashflow
- —
- DSCR
- —
- Eligible?
- —
Short-term bridge; refi at stabilization.
Listing history 15 events
-
2026-06-21days on market $160,000 Active 23 DOM
-
2026-06-18days on market $160,000 Active 20 DOM
-
2026-06-17days on market $160,000 Active 19 DOM
-
2026-06-16days on market $160,000 Active 18 DOM
-
2026-06-15days on market $160,000 Active 17 DOM
-
2026-06-13days on market $160,000 Active 15 DOM
-
2026-06-09days on market $160,000 Active 11 DOM
-
2026-06-08days on market $160,000 Active 10 DOM
-
2026-06-07days on market $160,000 Active 9 DOM
-
2026-06-04days on market $160,000 Active 6 DOM
-
2026-06-03days on market $160,000 Active 5 DOM
-
2026-06-02days on market $160,000 Active 4 DOM
-
2026-06-01days on market $160,000 Active 3 DOM
-
2026-05-31days on market $160,000 Active 2 DOM
-
2026-05-28$160,000 Active
ⓘ Source: listings_history table (triggers on properties + properties_extension) + one-shot
backfill from property_details.listing_events for pre-trigger history.
Tax reassessment forecast SC · Resets to sale price
- Current annual tax
- $378 · $32/mo
- Projected year-2 tax
- $912 · $76/mo
- Expected delta
- +$534/yr (+$44/mo · 141.2%)
ⓘ Screening estimate from a state-policy table — verify with the county assessor before closing.
Climate risk First Street
- Flood 1/10 Low FEMA zone X (unshaded) · 0% chance over 30 yrs
- Wildfire 1/10 Low
- Heat 6/10 Major 7 d/yr ≥106°F today · 16 d/yr by 30 yrs out
- Wind 6/10 Major 51% chance of damaging wind over 30 yrs
- Air quality 2/10 Low 2 unhealthy d/yr today · 2 by 30 yrs out
Nearby sold comps map
Loading sold comps map…
Walkable amenities ~0.75 mi
Loading nearby amenities…
Taxation est. · year 1
- Rental income
- $21,145
- − Mortgage interest
- −$8,962
- − Property taxes
- −$378
- − Insurance
- −$800
- − Repairs & maintenance
- −$1,692
- − Management
- −$1,692
- − Depreciation
- −$4,655
- Taxable income
- $2,966
- Est. tax owed @ 24.0%
- −$712
- After-tax cash flow
- $4,746/yr
For passive investors: Depreciation is non-cash, so a rental often shows a tax loss while cash-flowing — sheltering income. Rental losses are passive: they offset passive income freely, and up to $25,000/yr can offset ordinary (W-2) income if you actively participate and your MAGI is under $100k (phasing out to $0 by $150k); unused losses carry forward. On sale, claimed depreciation is recaptured at up to 25%, and gains may owe capital-gains tax (a 1031 exchange can defer both). Figures are a year-1 estimate at your 24.0% rate — not tax advice; consult a CPA.
Schools (NCES district)
- District
- Lancaster 01
- NCES district ID
- 4502580
- Math proficiency
- 41% ▼ -7.00%
- Reading proficiency
- 47% ▼ -1.00%
- Median HH income
- $44,165
- Composite
- 37.23/100
- National rank
- #4462
- State rank
- #26 of 80 in SC
Livability — Lancaster
- Score
- 55/100
- State rank
- #301
- US rank
- #23178
Category grades
Schools grade is shown separately in the Schools card above.
Census & demographics
- County
- Lancaster County · 91,213 people
- City population
- 53,584
- Metro
- Charlotte-Concord-Gastonia, NC-SC
- Population (ZIP)
- 53,584
- Household income
- $62,969
- Rent vs Own
- Severe rent burden
- 1158.0
Population outlook (Lancaster County) Hauer SSP2
- Today (2025)
- 105,572 people
- By 2030
- 114,865 · +8.8%
- By 2040
- 132,268 · +25.3%
- By 2050
- 148,252 · +40.4%
- By 2075
- 182,540 · +72.9%
- By 2100
- 202,237 · +91.6%
Race, ethnicity, and origin ACS 2023
- Neighborhood character
- Majority White (62%)
- Race & ethnicity
- White 62% Black 26% Hispanic / Latino 8% Two or more races 5%
- Hispanic origin (detail)
- Mexican 4%
- Common ancestry
- Slovak 3% Serbian 2% Romanian 1%
- Foreign-born
- 6% · Canada
- Languages at home
- 91% English-only · Spanish 7% Other Indo-European 1%
Political lean MEDSL · Lancaster
- 2024 margin
- Strong R (+24.8) · D 37.0% · R 61.8% · Other 1.2%
- 2008→2024 swing
- -9.9pp toward R · 2008: -14.9pp · 2024: -24.8pp
- All cycles
- 2024: R+24.8 2020: R+22.8 2016: R+25.5 2012: R+18.0 2008: R+14.9
Not yet ingested
- Civics
- —
Market trends
- HPI YoY
- ▼ -95.90%
- Current HPI
- 244.328
- Rent YoY
- —
- Metro
- Charlotte-Concord-Gastonia, NC-SC
- State GDP YoY
- ▲ 4.51%
- F500 in state
- 2
Industry mix (Fortune 500 HQ in SC)
| Industry | F500 HQs | Revenue |
|---|---|---|
| Packaging | 1 | $7B |
|
||
Price history
1 event — show timeline
- 2026-05-28 Listed $160,000 CANOPYMLS as Distributed by MLS Grid
Property tax history
+1.8%/yrLatest (2025): $378 · +9.0% YoY. Source: county tax records.
Cash-flow waterfall
monthlySold comps — $/sqft
last 12 mo · ≤1 miLoading sold comps…