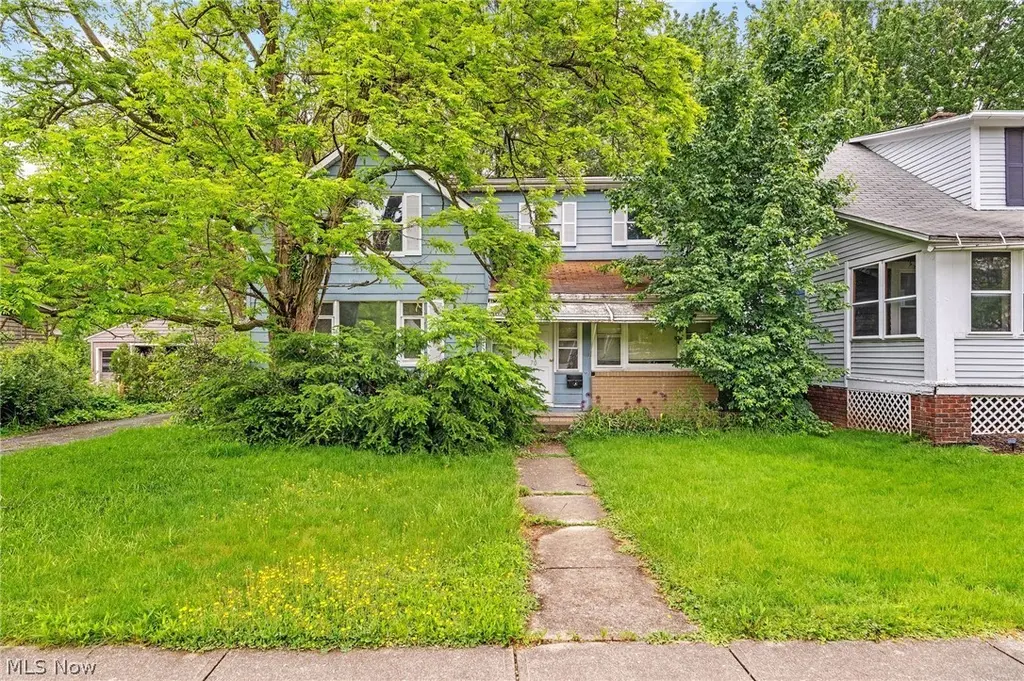
70 W 5th St · Berea, OH
Flood risk 1/10 · Minimal
- FEMA flood zone
- X (unshaded)
- Chance of flooding over 30 yrs
- 0.0%
- Est. flood insurance / yr
- $473 – $860
Fire risk 1/10 · Minimal
- Est. fire insurance / yr
- $713 – $1,323
Heat risk 3/10 · Minor
- Hot days now (above 96°F)
- 7 days/yr
- Hot days in 30 yrs
- 16 days/yr
Wind risk 1/10 · Minimal
- Chance of severe wind over 30 yrs
- —
Air-quality risk 2/10 · Minimal
- Unhealthy air days now
- 1 days/yr
- Unhealthy air days in 30 yrs
- 3 days/yr
Risk factors via First Street. Map © Google.
Why this score? — see what drove the B grade
The composite is a weighted blend of 9 inputs, each scored 0–100. Each bar is that input's sub-score; the figure is the points it added to the 100-point composite (weight × sub-score).
- Cash flow +30.0/30.0
- 1% rule +10.0/10.0
- DSCR +10.0/10.0
- ARV discount +7.5/15.0
- Schools +4.4/10.0
- Livability +4.0/5.0
- Rent growth +2.5/5.0
- Condition / age +2.5/5.0
- Appreciation +0.0/10.0
$115,000
🖨 Deal sheet 📄 Offer letter ✓ Due diligence
Listing remarks MLS
Large Home Freshly Painted In & Out, Country Kitchen, 24 Hrs To Show. .. Roof 5 Yrs. .. Enclosed Porch, Covered Patio Close To Campus Of Bw. .. Bring Offers!!
Key facts
- 9,147 sq ft lot
- 2 garage spots
- Built 1893
Property features AI
Finance
- HOA & community: Neighborhood playground
Exterior
- Parking: Detached 2-car garage; Paved driveway
- Utilities: Public water; Public sewer
- Home design: Two-story home; Vinyl siding exterior; Asphalt/fiberglass roof
- Construction: Built (year source: owner); Vinyl siding construction; Asphalt/fiberglass roof
- Exterior features: Covered, enclosed porch and patio; Backyard with chain link and wood fencing
Interior
- Kitchen: Kitchen with window treatments
- Bedrooms: Two main-level bedrooms; Additional bedrooms on first and second floors (total bedrooms listed across levels)
- Bathrooms: One full bathroom; One half bathroom; Two bathrooms located on the main level
- Heating & cooling: Forced-air heating (gas)
- Interior features: Partial unfinished basement; Window treatments in living areas and bedrooms
- Laundry & utility: Laundry area in basement
Neighborhood map
What this means for you Summary
Snapshot
- This is a 4-bed/1.0-bath single-family listed at $115k.
Deal economics
- At list price, monthly cash flow is $907 ($11k/yr) — positive.
- The deal already cash-flows at list — no discount required.
- Meets the 1% rule at list price ($2k rent vs $115k).
- Cap rate 15.8% vs local median 4.8% in Berea — top-decile yield for the area; either an underpriced asset or a hidden risk that comps aren't pricing in. Stress-test before assuming the spread holds.
Location & tenants
- Location reads 80/100 on livability (#136 in OH, #1,955 nationally) — a professional / high-income tenant draw. Strengths: crime A+, cost of living A+, housing A+; Watch: amenities D, commute F.
- Berea City (suburban): math 47% / reading 56% proficiency, ranked #414 of 656 in OH (top 63%) — acceptable for families but not a draw, mixed tenant base, ~2y average lease.
- Market conditions: 59 active listings in the ZIP; 4 comparable units currently listed for rent nearby; rentals leasing fast (median 11d on market — plan ~1-2 weeks tenant-placement turnaround); solid renter incomes; 1,441 units permitted in Cuyahoga County in 2024 (700 in 5+ unit buildings).
- This rent runs 34% of the median local income ($75k/yr) — at the standard rent-burdened threshold; future hikes will face affordability resistance.
Forward outlook
- Local home prices are declining (-3.0%/yr); year-one equity from $795 of loan paydown is wiped out by about $3k of value loss. Plan a longer hold.
- Cuyahoga County population projected to shrink 8% by 2050 — rents likely to lag national; underwrite the cash flow, not the appreciation.
- At projected returns (-3.0% appreciation + 3.0% rent growth), your $32k cash investment doubles in ~4 years — after that, you're playing with house money.
Negotiation context
- Only 1 days on market — expect competitive offers; lowballing is unlikely to land.
- 2 sale attempts since 27y ago with the ask held roughly flat each time — persistent listings suggest the price (not the market) is what's stuck; bring a comps-based counter.
- Current owner paid $94k; 22% above their basis — modest negotiation headroom, anchor on the comps not their cost.
Risks & watch-outs
- Watch-outs: built in 1893 — expect roof / HVAC / electrical / plumbing capex.
Questions for the listing agent
- Built in 1893 — when were the roof, HVAC, electrical panel, plumbing, and water heater last replaced?
- Is there a deadline driving the sale (1031 exchange, divorce, estate, relocation)? That informs how much negotiation room exists.
- Schools are A-rated — typically a magnet for longer-tenancy family renters. What's the average tenant stay here, and is there a school-zone premium baked into asking?
- What's the average days-on-market for RENTAL listings here right now (not sales)? A rising rental-DOM trend means longer vacancies and softer asking-rent achievability than the comps imply.
- What's the recent tenant-quality profile in this submarket — average credit score on applications, eviction rate, late-payment / NSF rate, and stable-employment percentage? A property-management company in the area should have these aggregated.
- How much new for-sale + rental construction is in the pipeline within 1–3 miles? Heavy new supply typically softens prices + rents 12–24 months out; constrained supply supports both.
Investment metrics
- 1% rule
- 1.87% ✓
- Cap rate
- 15.76%
- Cash-on-cash
- 33.80%
- DSCR
- 2.50
- GRM
- 4.4
CMA / ARV
- ARV (on-the-fly)
- $253,648
- Comps found
- 12
Show comp detail 12 sales within ~0.75 mi
| Address | Dist | Beds/Ba | Sqft | Sold | Price | $/sf | Match |
|---|---|---|---|---|---|---|---|
| 98 W Fifth Ave | 0.05mi | 4/1.5 | 1,404 (+6%) | 15mo | $243,000 | $173 | 74 |
| 96 Lincoln Ave | 0.18mi | 3/1.0 (-1) | 1,350 (+2%) | 16mo | $165,000 | $122 | 71 |
| 143 Baker St | 0.68mi | 3/2.0 (-1) | 1,256 (-5%) | 1mo | $300,000 | $239 | 49 |
| 584 Eastland Rd | 0.66mi | 4/3.0 | 1,420 (+7%) | 2mo | $286,900 | $202 | 48 |
| 200 Gibson St | 0.74mi | 3/1.0 (-1) | 1,256 (-5%) | 4mo | $225,000 | $179 | 48 |
| 262 Elmwood Dr | 0.58mi | 3/1.0 (-1) | 1,489 (+12%) | 1mo | $235,000 | $158 | 47 |
| 316 Rowan Dr | 0.74mi | 3/1.0 (-1) | 1,352 (+2%) | 13mo | $260,000 | $192 | 47 |
| 209 The Mall Dr | 0.59mi | 4/3.0 | 1,404 (+6%) | 11mo | $290,000 | $207 | 46 |
| 724 Shelley Pkwy | 0.59mi | 3/2.0 (-1) | 1,248 (-6%) | 12mo | $185,000 | $148 | 43 |
| 169 Fair St | 0.71mi | 3/2.0 (-1) | 1,282 (-4%) | 13mo | $269,900 | $211 | 41 |
| 87 Emerson Ave | 0.65mi | 3/2.0 (-1) | 1,400 (+5%) | 14mo | $242,000 | $173 | 40 |
| 716 N Rocky River Dr | 0.58mi | 3/2.0 (-1) | 1,188 (-10%) | 11mo | $227,275 | $191 | 37 |
Match score weights: distance 35% · size 25% · config 20% · recency 20%. Top-matched comps best support the ARV.
Projected returns pro-forma
-3.0% appreciation · 3.0% rent growth · sell at horizon
- IRR
- 29.1%
- Equity multiple
- 2.22×
- Total profit
- $39,166
- Equity at exit
- $17,147
- IRR
- 36.5%
- Equity multiple
- 4.37×
- Total profit
- $108,624
- Equity at exit
- $9,943
Cash invested: $32,200 (down + closing). Projections, not guarantees.
Landlord ↔ Tenant lean methodology
- Overall (STATE)
- 73 Landlord-Friendly
- State Ohio
- 73 Landlord-Friendly · R+6
- County
- — inherits STATE
- City
- — inherits STATE
ZIP-level market 44017
- Active inventory
- 59
- Price-to-rent
- 4.4×
Monthly cashflow live
- Estimated rent
- $2,154 medium interval (Pro) →
- Mortgage (P&I)
- −$603
- Tax est. 1.5%
- −$144 /mo · $1,725/yr
- Insurance
- −$48
- HOA
- −$0
- Vacancy / Maint / Mgmt
- −$452
- Net cashflow
- $907
Break-even live
UW: 25.0% down · 7.5% · 30yr · 1.5% tax · 5.0% vac · 8.0% maint · 8.0% mgmt
Financing live
Cash to close
- Down payment
- $28,750
- Closing costs
- $3,450
- Reserves months
- —
- Total cash needed
- —
Loan-product check · same deal, 3 products live
Conventional
25% down · 7.5% · 30yr
- Down + closing
- —
- Monthly P&I
- —
- Monthly cashflow
- —
- DSCR
- —
- Eligible?
- —
Personal DTI + credit; lowest rate.
DSCR
20% down · 8.5% · 30yr
- Down + closing
- —
- Monthly P&I
- —
- Monthly cashflow
- —
- DSCR
- —
- Eligible?
- —
No personal income docs; deal must DSCR.
Hard money
10% down · 12.0% · 12mo
- Down + closing
- —
- Monthly P&I
- —
- Monthly cashflow
- —
- DSCR
- —
- Eligible?
- —
Short-term bridge; refi at stabilization.
Rent comps 4 comps
| Address | Beds | Baths | Sqft | Rent | $/sqft | DOM | Units | Dist |
|---|---|---|---|---|---|---|---|---|
| 55 Barrett Rd Berea, OH | 3.0 | 1.0–2.0 | 798 | $1,445 | $1.81 | 10d | 1 | 0.46mi |
| 129 Riveredge Pkwy Berea, OH | 3.0 | 1.5 | 1767 | $1,800 | $1.02 | 43d | 1 | 0.85mi |
| 287 Edgewood Dr Berea, OH | 3.0 | 1.0 | 1284 | $1,800 | $1.40 | 1d | 1 | 1.08mi |
| 367 S Rocky River Dr Unit 1496132P Berea, OH | 4.0 | 2.0 | 1765 | $5,357 | $3.04 | 7d | 1 | 1.24mi |
Listing history 2 events
-
2026-06-07remarks 699-char remark
-
2026-06-07$115,000 Pending 1 DOM
ⓘ Source: listings_history table (triggers on properties + properties_extension) + one-shot
backfill from property_details.listing_events for pre-trigger history.
Climate risk First Street
- Flood 1/10 Low FEMA zone X (unshaded) · 0% chance over 30 yrs
- Wildfire 1/10 Low
- Heat 3/10 Moderate 7 d/yr ≥96°F today · 16 d/yr by 30 yrs out
- Wind 1/10 Low
- Air quality 2/10 Low 1 unhealthy d/yr today · 3 by 30 yrs out
Nearby sold comps map
Loading sold comps map…
Walkable amenities ~0.75 mi
Loading nearby amenities…
Taxation est. · year 1
- Rental income
- $25,850
- − Mortgage interest
- −$6,442
- − Property taxes
- −$1,725
- − Insurance
- −$575
- − Repairs & maintenance
- −$2,068
- − Management
- −$2,068
- − Depreciation
- −$3,345
- Taxable income
- $9,626
- Est. tax owed @ 24.0%
- −$2,310
- After-tax cash flow
- $8,574/yr
For passive investors: Depreciation is non-cash, so a rental often shows a tax loss while cash-flowing — sheltering income. Rental losses are passive: they offset passive income freely, and up to $25,000/yr can offset ordinary (W-2) income if you actively participate and your MAGI is under $100k (phasing out to $0 by $150k); unused losses carry forward. On sale, claimed depreciation is recaptured at up to 25%, and gains may owe capital-gains tax (a 1031 exchange can defer both). Figures are a year-1 estimate at your 24.0% rate — not tax advice; consult a CPA.
Schools (NCES district)
- District
- Berea City
- NCES district ID
- 3904360
- Math proficiency
- 47% ▼ -17.00%
- Reading proficiency
- 56% ▼ -7.00%
- Median HH income
- $51,921
- Composite
- 44.18/100
- National rank
- #2856
- State rank
- #414 of 656 in OH
Livability — Berea
- Score
- 80/100
- State rank
- #136
- US rank
- #1955
Category grades
Schools grade is shown separately in the Schools card above.
Census & demographics
- Census place
- Berea, OH
- County
- Cuyahoga County · 1,090,369 people
- City population
- 18,279
- Metro
- Cleveland-Elyria, OH
- Population (ZIP)
- 18,279
- Household income
- $75,231
- Rent vs Own
- Severe rent burden
- 356.0
Population outlook (Cuyahoga County) Hauer SSP2
- Today (2025)
- 1,244,621 people
- By 2030
- 1,230,093 · -1.2%
- By 2040
- 1,189,108 · -4.5%
- By 2050
- 1,145,706 · -7.9%
- By 2075
- 1,076,557 · -13.5%
- By 2100
- 978,987 · -21.3%
Race, ethnicity, and origin ACS 2023
- Neighborhood character
- Predominantly White (79%)
- Race & ethnicity
- White 79% Black 8% Two or more races 8% Hispanic / Latino 4% Asian 2%
- Common ancestry
- Romanian 11% Slovak 3% Serbian 2%
- Foreign-born
- 2% · Canada
- Languages at home
- 95% English-only · Spanish 1% Other Indo-European 1% Chinese 0%
Political lean MEDSL · Cuyahoga
- 2024 margin
- Solid D (+31.5) · D 65.4% · R 33.9%
- 2008→2024 swing
- -7.4pp toward R · 2008: 38.9pp · 2024: 31.5pp
- All cycles
- 2024: D+31.5 2020: D+34.1 2016: D+35.0 2012: D+38.7 2008: D+38.9
Not yet ingested
- Civics
- —
Market trends
- HPI YoY
- ▼ -139.89%
- Current HPI
- 208.8113
- Rent YoY
- —
- Metro
- Cleveland-Elyria, OH
- State GDP YoY
- ▲ 1.98%
- F500 in state
- 48
Industry mix (Fortune 500 HQ in OH)
| Industry | F500 HQs | Revenue |
|---|---|---|
| Insurance | 3 | $145B |
|
||
| Industrial Machinery | 3 | $49B |
|
||
| Financial Services | 3 | $24B |
|
||
| Consumer Goods | 2 | $93B |
|
||
| Aerospace / Defense | 2 | $47B |
|
||
| Utilities | 2 | $33B |
|
||
Price history
+21.2% since first listed6 events — show timeline
- 2026-06-05 Pending — MLSNOW
- 2026-06-04 Listed $115,000 MLSNOW
- 1999-11-02 Sold (MLS) $94,000 MLSNOW
- 1999-08-14 Listing Removed — MLSNOW
- 1999-07-22 Sold (Public Records) $94,000 Public Records
- 1999-05-13 Listed $94,900 MLSNOW
Property tax history
+7.4%/yrLatest (2025): $6,093 · +7.8% YoY. Source: county tax records.
Cash-flow waterfall
monthlySold comps — $/sqft
last 12 mo · ≤1 miLoading sold comps…