1733 San Bernadino Way Unit K406 · Pine Ridge, FL
Flood risk 4/10 · Minor
- FEMA flood zone
- X (shaded)
- Chance of flooding over 30 yrs
- 0.13%
- Est. flood insurance / yr
- $507 – $1,088
Fire risk 1/10 · Minimal
- Est. fire insurance / yr
- $947 – $1,759
Heat risk 10/10 · Severe
- Hot days now (above 107°F)
- 7 days/yr
- Hot days in 30 yrs
- 29 days/yr
Wind risk 10/10 · Severe
- Chance of severe wind over 30 yrs
- 99.0%
Air-quality risk 2/10 · Minimal
- Unhealthy air days now
- 2 days/yr
- Unhealthy air days in 30 yrs
- 2 days/yr
Risk factors via First Street. Map © Google.
Why this score? — see what drove the D grade
The composite is a weighted blend of 9 inputs, each scored 0–100. Each bar is that input's sub-score; the figure is the points it added to the 100-point composite (weight × sub-score).
- Cash flow +10.2/30.0
- ARV discount +7.5/15.0
- Appreciation +5.1/10.0
- Schools +5.0/10.0
- 1% rule +3.4/10.0
- Livability +3.4/5.0
- DSCR +2.9/10.0
- Rent growth +2.7/5.0
- Condition / age +2.5/5.0
$689,900
🖨 Deal sheet (PDF) 📄 Offer letter ✓ Due diligence
Listing remarks
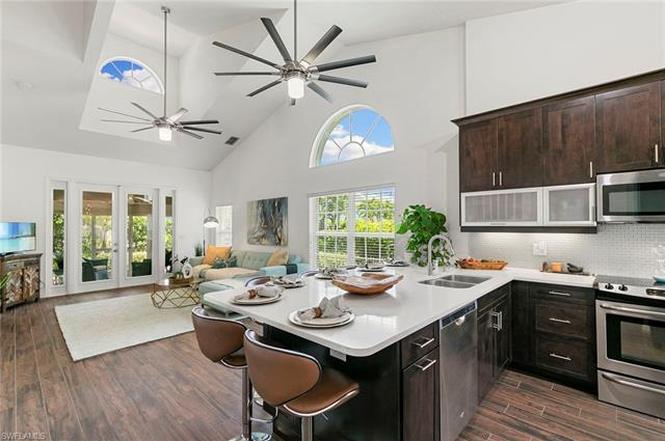
Enjoy relaxed, maintenance-free living in this beautifully updated three-bedroom-plus-den, 2.5-bath villa. This rarely available end unit is ideally on a cul-de-sac within Monterey, one of Naples sought-after communities. Cathedral ceilings and abundant natural light create a bright, open atmosphere throughout, enhancing the home’s inviting and spacious feel. A charming, sun-filled courtyard entry sets the tone for comfortable everyday living and offers space for container gardening. The kitchen delivers on style and function, featuring European frameless cabinetry, quartz countertops and a generous peninsula with breakfast bar seating, ideal for casual dining and effortless entertain
Key facts
- Quartz counters
- End unit villa
- Courtyard entry
Tags
Property features AI
Other
- Possession: Possession at closing
- Multi-unit information: Part of a complex with 420 units; Building contains 1 unit; Unit is one of 1 per floor; Building has 2 floors
Finance
- HOA & community: Mandatory HOA; Quarterly HOA fees; Master association managed professionally; Master association fee included for many services; Maintenance covers cable, internet/Wi-Fi, irrigation water, lawn/land maintenance, manager, recreation facilities, reserve, security, and street lights; Community amenities include clubhouse, community pool, exercise room, library, community room, tennis, pickleball, basketball, billiards, BBQ/picnic area, bike and jog path, play area, sidewalks and streetlights; Total annual recurring fees: $9,880; Total one-time fees: $1,750
Exterior
- Parking: Attached 1-car garage; Auto garage door
- Security: Gated community with guard at gate
- Utilities: Central water; Central sewer; Cable available
- Home design: Residential villa (attached); 2-story end unit; Rear exposure faces north
- Construction: Built in 1990; Concrete block and wood frame construction; Stucco exterior finish; Tile roof; Impact resistant windows and doors; Manual shutters
- Exterior features: Courtyard; Cul-de-sac; Zero lot line; Landscaped area view; Central irrigation
Interior
- Kitchen: Pantry; Breakfast bar; Eat-in kitchen; Dishwasher; Range; Microwave; Refrigerator/ice maker; Disposal
- Bedrooms: 3 bedrooms plus den; Master bedroom on ground level; Split bedroom layout
- Flooring: Carpet; Laminate; Tile
- Bathrooms: 2 full bathrooms; 1 half bathroom; Master bath with dual sinks and separate tub and shower
- Heating & cooling: Central electric heat; Central electric air conditioning; Ceiling fans
- Interior features: Cable prewire; Closet cabinets; Foyer; French doors; High-speed internet available; Laundry tub; Pantry; Smoke detectors; Volume ceiling; Walk-in closet; Window coverings; Open porch/lanai; Screened lanai/porch
- Laundry & utility: Washer and dryer included; Laundry in residence; Laundry tub
Neighborhood map
What this means for you Summary
Snapshot
- This is a 3-bed/2.5-bath condo listed at $690k.
Deal economics
- At list price, monthly cash flow is $-386 ($-5k/yr) — negative.
- To cash-flow at today's rent, offer at most $622k (9.9% below list).
- To meet the 1% rule (rent ≥ 1% of price), the offer needs to be $583k (15.5% below list).
- Recommended offer: $583k (15.5% below list) — sets the bar for 1% rule.
- Cap rate 5.6% vs local median 3.4% in Pine Ridge — top-decile yield for the area; either an underpriced asset or a hidden risk that comps aren't pricing in. Stress-test before assuming the spread holds.
Location & tenants
- Location reads 67/100 on livability (#565 in FL) — a middle-class / working-renter tenant base. Strengths: crime A+, housing A+, cost of living A-; Watch: health & safety C-, amenities F, commute F.
- Collier (suburban): math 60% / reading 56% proficiency, ranked #16 of 73 in FL (top 22%) — acceptable for families but not a draw, mixed tenant base, ~2y average lease.
- Zoned schools: Pelican Marsh Elementary School (math 87% / reading 83%, grade A+, #35 of 2,144 statewide, top 2%, 709 students, 29% FRL); Pine Ridge Middle School (math 74% / reading 70%, grade A, #52 of 571 statewide, top 10%, 832 students, 31% FRL); Barron Collier High School (math 62% / reading 68%, grade B, #76 of 667 statewide, top 11%, 1,650 students, 26% FRL) — zoned schools average 29% FRL vs 55% district-wide (26 pts lower); this property's tenant base skews higher-income than the district average.
- Zoned-school proficiency averages 74% at this address vs 58% district-wide (+16 pts) — the actual schools serving this property are materially stronger than the Collier average implies; a family-tenant draw the district grade alone would hide.
- Market conditions: Rents flat; 424 active listings in the ZIP; 40 comparable units currently listed for rent nearby; rentals at typical pace (median 25d on market — plan ~3-4 weeks tenant-placement turnaround); solid renter incomes; 3,520 units permitted in Collier County in 2024 (959 in 5+ unit buildings).
- At $5,828/mo this rent would consume 76% of the median local household income ($92k/yr) (locally 1712% of renters already pay >50% of income on rent) — very limited rent-growth headroom before tenants either downsize or default.
Forward outlook
- In year one you build about $7k of equity ($5k loan paydown + $2k appreciation (0.3% local appreciation)).
- Collier County population projected at +30% by 2050 — long-run rental-demand tailwind backs the buy-and-hold thesis.
- By year 6, paydown + projected appreciation supports a ~$44k cash-out refi (75% LTV) — recoverable capital for the next deal without selling this one.
Negotiation context
- It's been on market 252 days — a 12% lower offer ($607k) is reasonable based on typical stale-listing flexibility.
- Current owner paid $285k; list at $690k implies a 142% gain — meaningful room to come down on a strong offer.
Risks & watch-outs
- Climate carrying-cost: severe wind risk, 99% chance of damaging wind over 30y; extreme-heat days projected 7→29/yr by 2055 (HVAC capex compounding) — expect insurance premiums to compound above CPI over the hold.
Questions for the listing agent
- What do current leases actually rent for vs. the listed asking? Can we see a recent rent roll and the last 12 months of T-12 income?
- It's been on market 252 days. Have you received any prior offers? Is the seller open to a 16% concession, seller financing, or rate buy-down credit?
- What does the HOA fee cover, when was the last increase, and are there any pending special assessments or reserve-fund shortfalls?
- Any open or pending special assessments — roof, HVAC, plumbing, elevator, façade? What's the per-unit balance and payoff schedule, and is the seller paying it off at close or rolling it to the buyer?
- Why hasn't it sold? Are there any deal-killer items the seller is aware of (foundation, flood, title, zoning, code violations)?
- Is there a deadline driving the sale (1031 exchange, divorce, estate, relocation)? That informs how much negotiation room exists.
- Schools are F-rated, which usually means shorter tenancies and higher turnover. Who's the typical renter profile here, and what's been the actual vacancy rate?
- The area grade is low — what's the realistic commute time and amenity access for the typical tenant pool here? Any planned neighborhood developments (good or bad) we should know about?
- What's the average days-on-market for RENTAL listings here right now (not sales)? A rising rental-DOM trend means longer vacancies and softer asking-rent achievability than the comps imply.
- What's the recent tenant-quality profile in this submarket — average credit score on applications, eviction rate, late-payment / NSF rate, and stable-employment percentage? A property-management company in the area should have these aggregated.
- How much new apartment / multifamily construction is in the pipeline within 1–3 miles? Heavy new supply (>2% of stock underway) typically softens rents 12–24 months out; light construction supports rent growth.
Investment metrics
- 1% rule
- 0.84% ✗
- Cap rate
- 5.62%
- Cash-on-cash
- -2.39%
- DSCR
- 0.89
- GRM
- 9.9
CMA / ARV
No comps found within radius.
Projected returns pro-forma
0.29% appreciation · 0.92% rent growth · sell at horizon
- IRR
- -5.1%
- Equity multiple
- 0.76×
- Total profit
- $-46,841
- Equity at exit
- $210,558
- IRR
- -0.8%
- Equity multiple
- 0.91×
- Total profit
- $-17,009
- Equity at exit
- $261,418
Cash invested: $193,172 (down + closing). Projections, not guarantees.
Landlord ↔ Tenant lean methodology
- Overall (STATE)
- 87 Strongly Landlord-Friendly
- State Florida
- 87 Strongly Landlord-Friendly · R+3
- County
- — inherits STATE
- City
- — inherits STATE
ZIP-level market 34109
- Home prices YoY
- 0.1%
- Rents YoY
- 0.9%
- Active inventory
- 424
- Price-to-rent
- 9.9×
Monthly cashflow live
- Estimated rent
- $5,828 high interval (Pro) →
- Mortgage (P&I)
- −$3,618
- Tax from tax record
- −$261 /mo · $3,131/yr
- Insurance
- −$287
- HOA
- −$823
- Vacancy / Maint / Mgmt
- −$1,224
- Net cashflow
- $-386
Break-even live
Sensitivity live
| Price | -10% $5 | -5% $-190 | +0% $-386 | +5% $-581 | +10% $-776 |
|---|---|---|---|---|---|
| Rent | -10% $-846 | -5% $-616 | +0% $-386 | +5% $-155 | +10% $75 |
| Rate | -1.0pp $-38 | -0.5pp $-210 | base $-386 | +0.5pp $-564 | +1.0pp $-746 |
UW: 25.0% down · 7.5% · 30yr · 1.5% tax · 5.0% vac · 8.0% maint · 8.0% mgmt
Financing live
Cash to close
- Down payment
- $172,475
- Closing costs
- $20,697
- Reserves months
- —
- Total cash needed
- —
Loan-product check · same deal, 3 products live
Conventional
25% down · 7.5% · 30yr
- Down + closing
- —
- Monthly P&I
- —
- Monthly cashflow
- —
- DSCR
- —
- Eligible?
- —
Personal DTI + credit; lowest rate.
DSCR
20% down · 8.5% · 30yr
- Down + closing
- —
- Monthly P&I
- —
- Monthly cashflow
- —
- DSCR
- —
- Eligible?
- —
No personal income docs; deal must DSCR.
Hard money
10% down · 12.0% · 12mo
- Down + closing
- —
- Monthly P&I
- —
- Monthly cashflow
- —
- DSCR
- —
- Eligible?
- —
Short-term bridge; refi at stabilization.
Rent comps 40 comps
| Address | Beds | Baths | Sqft | Rent | $/sqft | DOM | Units | Dist |
|---|---|---|---|---|---|---|---|---|
| 6883 Redbay Park Rd #102 Naples, FL | 2.0 | 2.0 | 1570 | $2,700 | $1.72 | 25d | 1 | 0.16mi |
| 6910 Satinleaf Rd N #101 Naples, FL | 3.0 | 2.0 | 1616 | $6,000 | $3.71 | 25d | 1 | 0.19mi |
| 6914 Satinleaf Rd N #103 Naples, FL | 2.0 | 2.0 | 1404 | $6,200 | $4.42 | 25d | 1 | 0.21mi |
| 6800 Satinleaf Rd S #104 Naples, FL | 3.0 | 2.0 | 1616 | $3,200 | $1.98 | 25d | 1 | 0.21mi |
| 6816 Satinleaf Rd S #102 Naples, FL | 2.0 | 2.0 | 1282 | $5,000 | $3.90 | 25d | 1 | 0.24mi |
| 7128 Lemuria Cir Unit 702 Naples, FL | 3.0 | 3.5 | 2408 | $14,000 | $5.81 | 25d | 1 | 0.25mi |
| 6934 Rain Lily Ct #102 Naples, FL | 2.0 | 2.0 | 1282 | $4,500 | $3.51 | 25d | 1 | 0.27mi |
| 6934 Rain Lily Ct #103 Naples, FL | 2.0 | 2.0 | 1282 | $5,200 | $4.06 | 25d | 1 | 0.27mi |
| 7127 Blue Juniper Ct #201 Naples, FL | 3.0 | 2.0 | 2040 | $3,500 | $1.72 | 25d | 1 | 0.35mi |
| 1934 Timberline Dr Unit 1049713P Naples, FL | 3.0 | 2.0 | 2055 | $8,191 | $3.99 | 23d | 1 | 0.35mi |
| 7168 Lemuria Cir #1701 Naples, FL | 3.0 | 3.0 | 2408 | $4,250 | $1.76 | 23d | 1 | 0.38mi |
| 7117 Timberland Cir Naples, FL | 3.0 | 2.0 | 1749 | $3,995 | $2.28 | 15d | 1 | 0.40mi |
| 8139 Las Palmas Way Naples, FL | 3.0 | 3.0 | 2100 | $4,995 | $2.38 | 25d | 1 | 0.45mi |
| 7080 Timberland Cir Naples, FL | 3.0 | 2.0 | 1882 | $4,500 | $2.39 | 25d | 1 | 0.51mi |
| 6984 Burnt Sienna Cir Naples, FL | 3.0 | 2.0 | 1749 | $12,000 | $6.86 | 25d | 1 | 0.54mi |
| 8824 Ventura Way Naples, FL | 3.0 | 3.0 | 2078 | $8,000 | $3.85 | 25d | 1 | 0.60mi |
| 7159 Mill Pond Cir Naples, FL | 3.0 | 2.0 | 2487 | $3,500 | $1.41 | 15d | 1 | 0.61mi |
| 6855 Old Banyan Way Naples, FL | 2.0 | 2.0 | 1684 | $7,000 | $4.16 | 25d | 1 | 0.61mi |
| 7774 Jewel Ln #201 Naples, FL | 3.0 | 2.0 | 1299 | $2,800 | $2.16 | 25d | 1 | 0.63mi |
| 8864 Ventura Way Naples, FL | 3.0 | 3.0 | 2053 | $4,500 | $2.19 | 25d | 1 | 0.65mi |
| 7546 Mill Pond Cir Naples, FL | 3.0 | 2.0 | 1373 | $6,500 | $4.73 | 25d | 1 | 0.71mi |
| 6772 Southern Oak Ct Naples, FL | 4.0 | 2.5 | 2537 | $9,500 | $3.74 | 25d | 1 | 0.72mi |
| 7271 Mill Pond Cir Naples, FL | 3.0 | 2.0 | 1700 | $8,250 | $4.85 | 25d | 1 | 0.74mi |
| 8924 Ventura Way Naples, FL | 3.0 | 3.0 | 2098 | $14,000 | $6.67 | 25d | 1 | 0.76mi |
| 7287 Mill Pond Cir Naples, FL | 3.0 | 2.0 | 1355 | $3,800 | $2.80 | 25d | 1 | 0.76mi |
| 6853 Il Regalo Cir Naples, FL | 4.0 | 3.0 | 2602 | $7,500 | $2.88 | 25d | 1 | 0.80mi |
| 9024 Whimbrel Watch Ln #101 Naples, FL | 3.0 | 2.5 | 2060 | $7,500 | $3.64 | 25d | 1 | 0.82mi |
| 9066 Whimbrel Watch Ln #101 Naples, FL | 3.0 | 2.5 | 2060 | $4,750 | $2.31 | 25d | 1 | 0.89mi |
| 131 Cajeput Dr Naples, FL | 3.0 | 2.0 | 2092 | $7,500 | $3.59 | 25d | 1 | 0.89mi |
| 65 Emerald Woods Dr Unit E8 Naples, FL | 2.0 | 2.5 | 1360 | $2,400 | $1.76 | 25d | 1 | 0.96mi |
| 61 Emerald Woods Dr Unit D2 Naples, FL | 2.0 | 2.5 | 1360 | $3,200 | $2.35 | 25d | 1 | 0.98mi |
| 6545 Chestnut Cir Naples, FL | 2.0 | 2.0 | 2322 | $8,500 | $3.66 | 25d | 1 | 1.01mi |
| 2541 Citrus Lake Dr Unit A-205 Naples, FL | 3.0 | 2.0 | 1590 | $5,250 | $3.30 | 15d | 1 | 1.05mi |
| 322 Sugar Pine Ln #322 Naples, FL | 2.0 | 2.0 | 1311 | $2,350 | $1.79 | 25d | 1 | 1.08mi |
| 800 Meadowland Dr Unit H Naples, FL | 2.0 | 2.5 | 1432 | $2,700 | $1.89 | 15d | 1 | 1.08mi |
| 800 Meadowland Dr Unit N Naples, FL | 2.0 | 2.5 | 1432 | $5,500 | $3.84 | 23d | 1 | 1.08mi |
| 790 Meadowland Dr Unit 29-2 Naples, FL | 2.0 | 2.5 | 1432 | $6,000 | $4.19 | 15d | 1 | 1.10mi |
| 816 Turkey Oak Ln Naples, FL | 3.0 | 2.5 | 2231 | $25,000 | $11.21 | 25d | 1 | 1.11mi |
| 2608 Sailors Way #122 Naples, FL | 2.0 | 2.0 | 1387 | $5,500 | $3.97 | 25d | 1 | 1.11mi |
| 2611 Citrus Lake Dr Unit C-203 Naples, FL | 3.0 | 2.0 | 1710 | $5,500 | $3.22 | 15d | 1 | 1.12mi |
HOA detail condo
- Monthly dues
- $823 · $9,876/yr
- Assessments
- None detected in remarks — confirm with the listing agent.
Listing history 8 events
-
2026-05-08status Pending
-
2026-04-27status Pending With Contingencies
-
2026-02-24price $689,900
-
2025-10-08price $700,000
-
2025-08-18$710,000 Active
-
2013-12-26soldstatus $285,000
-
2003-08-04soldstatus $249,000
-
1989-07-01soldstatus $134,900
ⓘ Source: listings_history table (triggers on properties + properties_extension) + one-shot
backfill from property_details.listing_events for pre-trigger history.
Tax reassessment forecast FL · Resets to sale price
- Current annual tax
- $3,131 · $261/mo
- Projected year-2 tax
- $5,726 · $477/mo
- Expected delta
- +$2,595/yr (+$216/mo · 82.9%)
ⓘ Screening estimate from a state-policy table — verify with the county assessor before closing.
Climate risk First Street
- Flood 4/10 Moderate FEMA zone X (shaded) · 13% chance over 30 yrs
- Wildfire 1/10 Low
- Heat 10/10 Extreme 7 d/yr ≥107°F today · 29 d/yr by 30 yrs out
- Wind 10/10 Extreme 99% chance of damaging wind over 30 yrs
- Air quality 2/10 Low 2 unhealthy d/yr today · 2 by 30 yrs out
Nearby sold comps map
Loading sold comps map…
Walkable amenities ~0.75 mi
Loading nearby amenities…
Taxation est. · year 1
- Rental income
- $69,931
- − Mortgage interest
- −$38,645
- − Property taxes
- −$3,131
- − Insurance
- −$3,450
- − Repairs & maintenance
- −$5,594
- − Management
- −$5,594
- − HOA
- −$9,876
- − Depreciation
- −$20,070
- Taxable loss
- −$16,430
- Est. tax savings @ 24.0%
- +$3,943
- After-tax cash flow
- $-683/yr
For passive investors: Depreciation is non-cash, so a rental often shows a tax loss while cash-flowing — sheltering income. Rental losses are passive: they offset passive income freely, and up to $25,000/yr can offset ordinary (W-2) income if you actively participate and your MAGI is under $100k (phasing out to $0 by $150k); unused losses carry forward. On sale, claimed depreciation is recaptured at up to 25%, and gains may owe capital-gains tax (a 1031 exchange can defer both). Figures are a year-1 estimate at your 24.0% rate — not tax advice; consult a CPA.
Schools (NCES district)
- District
- Collier
- NCES district ID
- 1200330
- Math proficiency
- 60% ▼ -4.00%
- Reading proficiency
- 56% ▼ -2.00%
- Median HH income
- $58,275
- Composite
- 50.23/100
- National rank
- #1892
- State rank
- #16 of 73 in FL
Livability — Pine Ridge
- Score
- 67/100
- State rank
- #565
- US rank
- #10798
Category grades
Schools grade is shown separately in the Schools card above.
Census & demographics
- County
- Collier County · 396,295 people
- City population
- 18,514
- Metro
- Naples-Marco Island, FL
- Population (ZIP)
- 27,273
- Household income
- $92,259
- Rent vs Own
- Severe rent burden
- 1712.0
Population outlook (Collier County) Hauer SSP2
- Today (2025)
- 420,858 people
- By 2030
- 450,054 · +6.9%
- By 2040
- 502,232 · +19.3%
- By 2050
- 544,932 · +29.5%
- By 2075
- 627,203 · +49.0%
- By 2100
- 659,015 · +56.6%
Race, ethnicity, and origin ACS 2023
- Neighborhood character
- Predominantly White (78%)
- Race & ethnicity
- White 78% Hispanic / Latino 11% Two or more races 9% Black 4% Asian 4%
- Hispanic origin (detail)
- Mexican 1% Puerto Rican 1% Cuban 3%
- Common ancestry
- Romanian 5% Scotch-Irish 3% Lithuanian 2%
- Foreign-born
- 20% · Canada, Jamaica, Vietnam
- Languages at home
- 77% English-only · Spanish 10% Other Indo-European 5% Russian/Polish/Slavic 3%
Political lean MEDSL · Collier
- 2024 margin
- Solid R (+33.1) · D 33.1% · R 66.2%
- 2008→2024 swing
- -10.6pp toward R · 2008: -22.5pp · 2024: -33.1pp
- All cycles
- 2024: R+33.1 2020: R+24.7 2016: R+26.0 2012: R+30.1 2008: R+22.5
Not yet ingested
- Civics
- —
Market trends
- HPI YoY
- ▲ 0.29%
- Current HPI
- 279.357
- Rent YoY
- ▲ 0.92%
- Metro
- Naples-Marco Island, FL
- State GDP YoY
- ▲ 3.28%
- F500 in state
- 36
Industry mix (Fortune 500 HQ in FL)
| Industry | F500 HQs | Revenue |
|---|---|---|
| Industrial Technology | 2 | $29B |
|
||
| Insurance | 2 | $17B |
|
||
| Retail | 1 | $60B |
|
||
| Technology Distribution | 1 | $58B |
|
||
| Homebuilding | 1 | $35B |
|
||
| Technology Manufacturing | 1 | $35B |
|
||
Price history
+411.4% since first listed8 events — show timeline
- 2026-05-08 Pending — NAPLESMLS
- 2026-04-27 Pending — NAPLESMLS
- 2026-02-24 Price Changed $689,900 NAPLESMLS
- 2025-10-08 Price Changed $700,000 NAPLESMLS
- 2025-08-18 Listed $710,000 NAPLESMLS
- 2013-12-26 Sold (Public Records) $285,000 Public Records
- 2003-08-04 Sold (Public Records) $249,000 Public Records
- 1989-07-01 Sold (Public Records) $134,900 Public Records
Property tax history
+1.7%/yrLatest (2025): $3,131 · +2.4% YoY. Source: county tax records.
Cash-flow waterfall
monthlySold comps — $/sqft
last 12 mo · ≤1 miLoading sold comps…