 Multi-family
605 Grove St · Clifton, NJ
Flood risk 1/10 · Minimal
- FEMA flood zone
- X (unshaded)
- Chance of flooding over 30 yrs
- 0.0%
- Est. flood insurance / yr
- $507 – $1,088
Fire risk 1/10 · Minimal
- Est. fire insurance / yr
- $526 – $976
Heat risk 6/10 · Moderate
- Hot days now (above 100°F)
- 7 days/yr
- Hot days in 30 yrs
- 15 days/yr
Wind risk 6/10 · Moderate
- Chance of severe wind over 30 yrs
- 27.0%
Air-quality risk 4/10 · Minor
- Unhealthy air days now
- 3 days/yr
- Unhealthy air days in 30 yrs
- 5 days/yr
Risk factors via First Street. Map © Google.
Why this score? — see what drove the C+ grade
The composite is a weighted blend of 9 inputs, each scored 0–100. Each bar is that input's sub-score; the figure is the points it added to the 100-point composite (weight × sub-score).
- Cash flow +26.4/30.0
- DSCR +9.0/10.0
- 1% rule +8.9/10.0
- ARV discount +7.5/15.0
- Livability +3.9/5.0
- Schools +2.8/10.0
- Rent growth +2.5/5.0
- Condition / age +2.5/5.0
- Appreciation +0.0/10.0
$340,000
🖨 Deal sheet (PDF) 📄 Offer letter ✓ Due diligence
Multi-family units
County records classify this as Multi-Family (5+ Unit). Listing-text estimate: 1 unit. estimate disagrees with records
5+ unit building — per-unit beds/baths from public records are typically unavailable; the breakdown below (if shown) is an estimate from the listing text.
Listing remarks
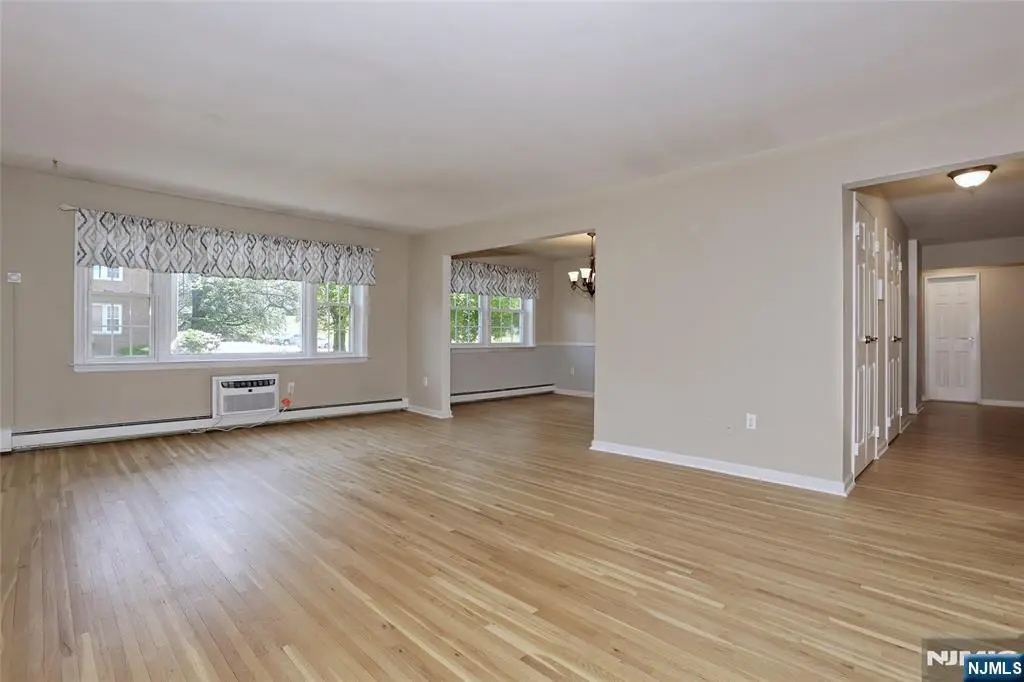
Nestled in a beautiful residential neighborhood near the Montclair border, Williamsburg South has much to offer. Amenities include impeccably maintained grounds, a picnic area with tables and grills and a sparkling in ground pool. Unit 2C is the largest model in the complex at just over 1,000 square feet. This end unit is filled with light in all rooms. Featuring a spacious living room, formal dining room with the potential for a 2nd bedroom and pristine kitchen with dining area. The main bedroom is large enough to accommodate a king sized bed as well as having three closets. There are double sinks in the bathroom, a tub with shower, triple mirror medicine cabinet and linen closet. You will
Key facts
- Picnic area
- Formal dining room
- Pristine kitchen
Tags
Property features AI
Finance
- HOA & community: Homeowners association with a $500 monthly fee
Exterior
- Home design: Condominium (residential); Property faces north; Building name: Williamsburg South
- Construction: Has full basement
- Exterior features: Community pool; Pets allowed
Interior
- Kitchen: Dishwasher; Microwave; Range/Oven; Refrigerator
- Bathrooms: 1 full bathroom
- Heating & cooling: Baseboard heating
- Interior features: Dishwasher; Microwave; Range/Oven; Refrigerator
- Laundry & utility: Laundry in basement (common area)
Neighborhood map
What this means for you Summary
Snapshot
- This is a 1-bed/1.0-bath multifamily listed at $340k.
Deal economics
- At list price, monthly cash flow is $892 ($11k/yr) — positive.
- The deal already cash-flows at list — no discount required.
- Meets the 1% rule at list price ($5k rent vs $340k).
- Cap rate 9.4% vs local median 2.7% in Clifton — top-decile yield for the area; either an underpriced asset or a hidden risk that comps aren't pricing in. Stress-test before assuming the spread holds.
Location & tenants
- Location reads 77/100 on livability (#110 in NJ, #2,833 nationally) — a middle-class / working-renter tenant base. Strengths: commute A+, employment A+, housing A+; Watch: amenities C-, cost of living F.
- Clifton Public School District (suburban): math 21% / reading 40% proficiency, ranked #332 of 472 in NJ (top 70%) — families likely to look elsewhere, expect single-tenant / working-renter base with shorter leases.
- Zoned schools: Clifton High School (math 19% / reading 41%, grade F, #284 of 399 statewide, top 72%, 3,059 students, 62% FRL) — zoned schools average 62% FRL vs 44% district-wide (18 pts higher); higher-poverty schools than district average — tighter screening recommended.
- Market conditions: 37 active listings in the ZIP; 19 comparable units currently listed for rent nearby; rentals at typical pace (median 19d on market — plan ~3-4 weeks tenant-placement turnaround); 860 units permitted in Passaic County in 2024 (614 in 5+ unit buildings).
Forward outlook
- Local home prices are declining (-3.0%/yr); year-one equity from $2k of loan paydown is wiped out by about $10k of value loss. Plan a longer hold.
- Passaic County population projected at +5% by 2050 — modest demand growth; plan on rents tracking national, not racing it.
- At projected returns (-3.0% appreciation + 3.0% rent growth), your $95k cash investment doubles in ~10 years — after that, you're playing with house money.
Negotiation context
- Only 1 days on market — expect competitive offers; lowballing is unlikely to land.
- 9 sale attempts since 7y ago with the ask held roughly flat each time — persistent listings suggest the price (not the market) is what's stuck; bring a comps-based counter.
- Current owner paid $210k; list at $340k implies a 62% gain — meaningful room to come down on a strong offer.
Risks & watch-outs
- Climate carrying-cost: major wind risk, 27% chance of damaging wind over 30y; extreme-heat days projected 7→15/yr by 2055 (HVAC capex compounding) — expect insurance premiums to compound above CPI over the hold.
Questions for the listing agent
- What does the HOA fee cover, when was the last increase, and are there any pending special assessments or reserve-fund shortfalls?
- Is there a deadline driving the sale (1031 exchange, divorce, estate, relocation)? That informs how much negotiation room exists.
- Schools are B-rated — typically a magnet for longer-tenancy family renters. What's the average tenant stay here, and is there a school-zone premium baked into asking?
- What's the average days-on-market for RENTAL listings here right now (not sales)? A rising rental-DOM trend means longer vacancies and softer asking-rent achievability than the comps imply.
- What's the recent tenant-quality profile in this submarket — average credit score on applications, eviction rate, late-payment / NSF rate, and stable-employment percentage? A property-management company in the area should have these aggregated.
- How much new apartment / multifamily construction is in the pipeline within 1–3 miles? Heavy new supply (>2% of stock underway) typically softens rents 12–24 months out; light construction supports rent growth.
Investment metrics
- 1% rule
- 1.39% ✓
- Cap rate
- 9.44%
- Cash-on-cash
- 11.24%
- DSCR
- 1.50
- GRM
- 6.0
CMA / ARV
No comps found within radius.
Projected returns pro-forma
-3.0% appreciation · 3.0% rent growth · sell at horizon
- IRR
- 0.6%
- Equity multiple
- 1.02×
- Total profit
- $2,082
- Equity at exit
- $50,695
- IRR
- 10.3%
- Equity multiple
- 1.80×
- Total profit
- $76,488
- Equity at exit
- $29,397
Cash invested: $95,200 (down + closing). Projections, not guarantees.
Landlord ↔ Tenant lean methodology
- Overall (STATE)
- 21 Tenant-Leaning
- State New Jersey
- 21 Tenant-Leaning · D+6
- County
- — inherits STATE
- City
- — inherits STATE
ZIP-level market 07013
- Active inventory
- 37
- Price-to-rent
- 12.0×
Monthly cashflow live
- Estimated rent
- $4,736 high interval (Pro) →
- Mortgage (P&I)
- −$1,783
- Tax est. 1.5%
- −$425 /mo · $5,100/yr
- Insurance
- −$142
- HOA
- −$500
- Vacancy / Maint / Mgmt
- −$995
- Net cashflow
- $892
Break-even live
Sensitivity live
| Price | -10% $1,127 | -5% $1,009 | +0% $892 | +5% $774 | +10% $657 |
|---|---|---|---|---|---|
| Rent | -10% $518 | -5% $705 | +0% $892 | +5% $1,079 | +10% $1,266 |
| Rate | -1.0pp $1,063 | -0.5pp $978 | base $892 | +0.5pp $804 | +1.0pp $714 |
2-unit breakdown (identical units grouped — click to expand)
| Units | Beds | Baths | Est. rent |
|---|---|---|---|
| 2× units | 1 | 1 | $4,736 |
| #1 | 1 | 1 | $2,368 |
| #2 | 1 | 1 | $2,368 |
| Total (2 units) | $4,736 | ||
UW: 25.0% down · 7.5% · 30yr · 1.5% tax · 5.0% vac · 8.0% maint · 8.0% mgmt
Financing live
Cash to close
- Down payment
- $85,000
- Closing costs
- $10,200
- Reserves months
- —
- Total cash needed
- —
Loan-product check · same deal, 3 products live
Conventional
25% down · 7.5% · 30yr
- Down + closing
- —
- Monthly P&I
- —
- Monthly cashflow
- —
- DSCR
- —
- Eligible?
- —
Personal DTI + credit; lowest rate.
DSCR
20% down · 8.5% · 30yr
- Down + closing
- —
- Monthly P&I
- —
- Monthly cashflow
- —
- DSCR
- —
- Eligible?
- —
No personal income docs; deal must DSCR.
Hard money
10% down · 12.0% · 12mo
- Down + closing
- —
- Monthly P&I
- —
- Monthly cashflow
- —
- DSCR
- —
- Eligible?
- —
Short-term bridge; refi at stabilization.
Rent comps 19 comps
| Address | Beds | Baths | Sqft | Rent | $/sqft | DOM | Units | Dist |
|---|---|---|---|---|---|---|---|---|
| 605 Grove St Unit D4 Clifton, NJ | 1.0 | 1.0 | — | $2,500 | — | 25d | 1 | 0.04mi |
| 565 Grove St Unit D-8 Clifton, NJ | 1.0 | 1.0 | — | $1,725 | — | 25d | 1 | 0.09mi |
| 168 Richfield Ter Clifton, NJ | 2.0 | 1.0 | 567 | $2,060 | $3.63 | 25d | 1 | 0.77mi |
| 1240 Van Houten Ave Unit 2A Clifton, NJ | 1.0 | 1.0 | — | $2,250 | — | 25d | 1 | 0.84mi |
| 140 Hepburn Rd Clifton, NJ | 2.0 | 1.0–2.0 | 997 | $2,462 | $2.47 | 4d | 14 | 0.94mi |
| 1 Kowal St Clifton, NJ | 2.0 | 1.0 | 680 | $2,372 | $3.49 | 25d | 3 | 1.05mi |
| 1 Kowal St Clifton, NJ | 1.0 | 1.0 | 775 | $2,450 | $3.16 | 21d | 1 | 1.05mi |
| 8 Quarry Dr Unit C1 Woodland Park, NJ | 2.0 | 2.0 | 1738 | $3,900 | $2.24 | 2d | 1 | 1.07mi |
| 28 George Russell Way #14 Clifton, NJ | 2.0 | 2.5 | — | $3,800 | — | 25d | 1 | 1.19mi |
| 28 Devonshire Dr Clifton, NJ | 2.0 | 2.5 | — | $3,800 | — | 18d | 1 | 1.23mi |
| 40 Surrey Ln Clifton, NJ | 1.0 | 1.0 | — | $1,300 | — | 25d | 1 | 1.28mi |
| 9203 Ravenscroft Rd Clifton, NJ | 2.0 | 2.0 | — | $3,200 | — | 2d | 1 | 1.35mi |
| 9203 Ravenscroft Rd Clifton, NJ | 2.0 | 2.0 | — | $3,200 | — | 2d | 1 | 1.35mi |
| 765 Clifton Ave Clifton, NJ | 1.0–2.0 | 1.0 | 717 | $2,370 | $3.30 | 14d | 3 | 1.45mi |
| 66 Mount Prospect Ave Unit 15 Clifton, NJ | 2.0 | 2.0 | — | $2,900 | — | 18d | 1 | 1.47mi |
| 66 Mount Prospect Ave Unit 4 Clifton, NJ | 2.0 | 2.0 | — | $2,700 | — | 8d | 1 | 1.47mi |
| 66 Mount Prospect Ave Unit 4 Clifton, NJ | 2.0 | 2.0 | — | $2,800 | — | 25d | 1 | 1.47mi |
| 120 Campbell Ave Clifton, NJ | 2.0 | 1.0 | — | $2,400 | — | 8d | 1 | 1.48mi |
| 9 Laurel Pl Montclair, NJ | 2.0 | 2.0 | — | $2,900 | — | 4d | 1 | 1.49mi |
HOA detail
- Monthly dues
- $500 · $6,000/yr
- Likely covers
- landscapingpool
Listing history 30 events
-
2026-05-28price $350,000
-
2026-05-28$340,000 Active
-
2025-08-14status Under Contract
-
2025-08-14soldstatus $210,000 Sold
-
2025-07-02$199,000 Active
-
2025-01-30soldstatus $205,000 Sold
-
2024-12-12status Under Contract
-
2024-12-05$199,000 Active
-
2023-04-01historical
-
2023-01-31soldstatus $255,000 Sold
-
2023-01-10status Under Contract
-
2022-12-06historical
-
2022-11-04soldstatus $172,000 Sold
-
2022-10-24$264,900 Active
-
2022-09-23status Under Contract
-
2022-08-23$160,000 Active
-
2022-08-23$160,000 Active
-
2020-10-20soldstatus $217,000 Sold
-
2020-09-02historical
-
2020-08-21price $219,000
-
2020-08-07$222,000 Active
-
2020-02-29soldstatus $150,000 Sold
-
2020-02-06historical
-
2019-12-06$149,000 Active
-
2019-07-31soldstatus $221,000 Sold
-
2019-06-25historical
-
2019-06-11$210,000 Active
-
2014-02-11soldstatus $155,550
-
2013-06-27soldstatus $123,000
-
2013-05-16soldstatus $177,000
ⓘ Source: listings_history table (triggers on properties + properties_extension) + one-shot
backfill from property_details.listing_events for pre-trigger history.
Climate risk First Street
- Flood 1/10 Low FEMA zone X (unshaded) · 0% chance over 30 yrs
- Wildfire 1/10 Low
- Heat 6/10 Major 7 d/yr ≥100°F today · 15 d/yr by 30 yrs out
- Wind 6/10 Major 27% chance of damaging wind over 30 yrs
- Air quality 4/10 Moderate 3 unhealthy d/yr today · 5 by 30 yrs out
Nearby sold comps map
Loading sold comps map…
Walkable amenities ~0.75 mi
Loading nearby amenities…
Taxation est. · year 1
- Rental income
- $56,832
- − Mortgage interest
- −$19,045
- − Property taxes
- −$5,100
- − Insurance
- −$1,700
- − Repairs & maintenance
- −$4,547
- − Management
- −$4,547
- − HOA
- −$6,000
- − Depreciation
- −$9,891
- Taxable income
- $6,003
- Est. tax owed @ 24.0%
- −$1,441
- After-tax cash flow
- $9,261/yr
For passive investors: Depreciation is non-cash, so a rental often shows a tax loss while cash-flowing — sheltering income. Rental losses are passive: they offset passive income freely, and up to $25,000/yr can offset ordinary (W-2) income if you actively participate and your MAGI is under $100k (phasing out to $0 by $150k); unused losses carry forward. On sale, claimed depreciation is recaptured at up to 25%, and gains may owe capital-gains tax (a 1031 exchange can defer both). Figures are a year-1 estimate at your 24.0% rate — not tax advice; consult a CPA.
Schools (NCES district)
- District
- Clifton Public School District
- NCES district ID
- 3403300
- Math proficiency
- 21% ▼ -18.00%
- Reading proficiency
- 40% ▼ -8.00%
- Median HH income
- $66,455
- Composite
- 28.12/100
- National rank
- #6820
- State rank
- #332 of 472 in NJ
Livability — Clifton
- Score
- 77/100
- State rank
- #110
- US rank
- #2833
Category grades
Schools grade is shown separately in the Schools card above.
Census & demographics
- Census place
- Clifton, NJ
- City population
- 53,240
- Population (ZIP)
- 29,419
Population outlook (Passaic County) Hauer SSP2
- Today (2025)
- 525,915 people
- By 2030
- 532,160 · +1.2%
- By 2040
- 543,670 · +3.4%
- By 2050
- 554,326 · +5.4%
- By 2075
- 584,728 · +11.2%
- By 2100
- 598,978 · +13.9%
Race, ethnicity, and origin ACS 2023
- Neighborhood character
- Diverse neighborhood (Simpson 0.59)
- Race & ethnicity
- White 58% Hispanic / Latino 26% Two or more races 13% Asian 10% Black 2%
- Hispanic origin (detail)
- Mexican 3% Puerto Rican 6% Cuban 3% Dominican 4%
- Common ancestry
- Romanian 14% Subsaharan African 2% Russian 1%
- Foreign-born
- 33% · Canada, Jamaica, South Korea
- Languages at home
- 53% English-only · Spanish 19% Russian/Polish/Slavic 9% Other Indo-European 8%
Political lean MEDSL · Passaic
- 2024 margin
- Toss-up / Even · D 46.9% · R 49.8% · Other 3.3%
- 2008→2024 swing
- -24.6pp toward R · 2008: 21.7pp · 2024: -2.9pp
- All cycles
- 2024: R+2.9 2020: D+16.5 2016: D+21.8 2012: D+27.3 2008: D+21.7
Not yet ingested
- Civics
- —
Market trends
- HPI YoY
- ▼ -293.07%
- Current HPI
- 294.2089
- Rent YoY
- —
- Metro
- —
- State GDP YoY
- ▲ 2.05%
- F500 in state
- 34
Industry mix (Fortune 500 HQ in NJ)
| Industry | F500 HQs | Revenue |
|---|---|---|
| Consumer Goods | 3 | $31B |
|
||
| Pharmaceuticals | 2 | $153B |
|
||
| Technology | 2 | $21B |
|
||
| Insurance | 2 | $20B |
|
||
| Healthcare | 2 | $19B |
|
||
| Financial Services | 1 | $70B |
|
||
Price history
+97.7% since first listed30 events — show timeline
- 2026-05-28 Price Changed $350,000 NJMLS
- 2026-05-28 Listed $340,000 NJMLS
- 2025-08-14 Pending — GSMLS
- 2025-08-14 Sold (MLS) $210,000 GSMLS
- 2025-07-02 Listed $199,000 GSMLS
- 2025-01-30 Sold (MLS) $205,000 GSMLS
- 2024-12-12 Pending — GSMLS
- 2024-12-05 Listed $199,000 GSMLS
- 2023-04-01 Delisted — NJMLS
- 2023-01-31 Sold (MLS) $255,000 GSMLS
- 2023-01-10 Pending — GSMLS
- 2022-12-06 Rental Removed — NJMLS
- 2022-11-04 Sold (MLS) $172,000 GSMLS
- 2022-10-24 Listed $264,900 GSMLS
- 2022-09-23 Pending — GSMLS
- 2022-08-23 Listed $160,000 GSMLS
- 2022-08-23 Listed $160,000 NJMLS
- 2020-10-20 Sold (MLS) $217,000 GSMLS
- 2020-09-02 Delisted — GSMLS
- 2020-08-21 Price Changed $219,000 GSMLS
- 2020-08-07 Listed $222,000 GSMLS
- 2020-02-29 Sold (MLS) $150,000 GSMLS
- 2020-02-06 Delisted — GSMLS
- 2019-12-06 Listed $149,000 GSMLS
- 2019-07-31 Sold (MLS) $221,000 GSMLS
- 2019-06-25 Delisted — GSMLS
- 2019-06-11 Listed $210,000 GSMLS
- 2014-02-11 Sold (MLS) $155,550 GSMLS
- 2013-06-27 Sold (MLS) $123,000 GSMLS
- 2013-05-16 Sold (MLS) $177,000 GSMLS
Cash-flow waterfall
monthlySold comps — $/sqft
last 12 mo · ≤1 miLoading sold comps…