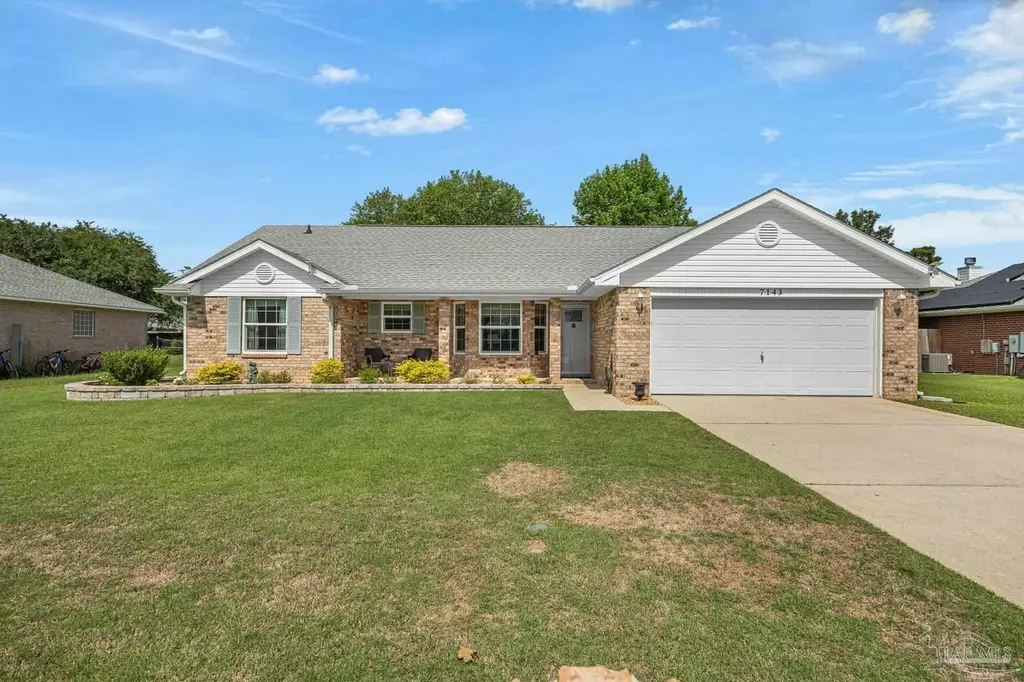
7143 Clearwood Rd · Bellview, FL
Flood risk 1/10 · Minimal
- FEMA flood zone
- X (unshaded)
- Chance of flooding over 30 yrs
- 0.0%
- Est. flood insurance / yr
- $507 – $1,088
Fire risk 3/10 · Minor
- Est. fire insurance / yr
- $947 – $1,759
Heat risk 10/10 · Severe
- Hot days now (above 105°F)
- 6 days/yr
- Hot days in 30 yrs
- 18 days/yr
Wind risk 9/10 · Severe
- Chance of severe wind over 30 yrs
- 99.0%
Air-quality risk 1/10 · Minimal
- Unhealthy air days now
- 0 days/yr
- Unhealthy air days in 30 yrs
- 0 days/yr
Risk factors via First Street. Map © Google.
Why this score? — see what drove the D grade
The composite is a weighted blend of 9 inputs, each scored 0–100. Each bar is that input's sub-score; the figure is the points it added to the 100-point composite (weight × sub-score).
- Cash flow +12.7/30.0
- ARV discount +12.7/15.0
- DSCR +3.8/10.0
- Rent growth +3.6/5.0
- Schools +3.6/10.0
- Livability +3.4/5.0
- Condition / age +2.5/5.0
- 1% rule +2.4/10.0
- Appreciation +0.0/10.0
$287,500
🖨 Deal sheet (PDF) 📄 Offer letter ✓ Due diligence
Listing remarks MLS
MANY LARGE HOMESITES AVAILABLE IN A NEW PHASE** OF WOODSIDE ESTATES II
Key facts
- Spacious living area
- Updated kitchen
- Peaceful setting
Tags
Property features AI
Finance
- HOA & community: No homeowners association
Exterior
- Parking: Attached 2-car garage; Two covered parking spaces; Front entrance access to garage
- Utilities: Public water; Septic tank sewer; Copper electrical wiring
- Home design: Single-family home (not attached); One story; Resale property; Homesteaded; Ridge vent for ventilation
- Construction: Frame construction; Shingle roof; Slab foundation; Built area approximately 1,579 square feet
- Exterior features: Covered patio/porch; Irrigation sprinkler system; Rain gutters; Full backyard fencing; Yard building (outbuilding); Paved, county-maintained road access
Interior
- Kitchen: Updated kitchen with laminate counters; New cabinets and new stainless steel appliances; Built-in microwave; Dishwasher; Disposal; Refrigerator
- Bedrooms: Master bedroom on the first floor; Additional bedrooms on the first floor
- Flooring: Tile flooring; Laminate flooring
- Bathrooms: Two full bathrooms; Shower recently updated (6–10 years ago)
- Heating & cooling: Central heating; Central air conditioning; Ceiling fans for cooling
- Interior features: Ceiling fans; Impact resistant windows
- Laundry & utility: Washer and dryer included; Laundry located inside; Electric water heater
Neighborhood map
What this means for you Summary
Snapshot
- This is a 3-bed/3.0-bath single-family listed at $288k.
Deal economics
- At list price, monthly cash flow is $-32 ($-379/yr) — negative.
- To cash-flow at today's rent, offer at most $282k (1.9% below list).
- To meet the 1% rule (rent ≥ 1% of price), the offer needs to be $212k (26.2% below list).
- Recommended offer: $212k (26.2% below list) — sets the bar for 1% rule.
Location & tenants
- Location reads 67/100 on livability (#561 in FL) — a middle-class / working-renter tenant base. Strengths: cost of living A+, housing A+; Watch: amenities F, commute F, health & safety F.
- Escambia (suburban): math 40% / reading 45% proficiency, ranked #56 of 73 in FL (top 77%) — families likely to look elsewhere, expect single-tenant / working-renter base with shorter leases.
- Zoned schools: Beulah Elementary School (math 53% / reading 57%, grade C, #872 of 2,144 statewide, top 42%, 946 students, 57% FRL); Bellview Middle School (math 17% / reading 23%, grade F, #558 of 571 statewide, top 98%, 992 students, 76% FRL); Pine Forest High School (math 20% / reading 32%, grade F, #494 of 667 statewide, top 75%, 1,870 students, 62% FRL).
- Market conditions: Rents rising fast (+4.4%/yr); 421 active listings in the ZIP; 5 comparable units currently listed for rent nearby; rentals at typical pace (median 25d on market — plan ~3-4 weeks tenant-placement turnaround); solid renter incomes; 1,479 units permitted in Escambia County in 2024 (0 in 5+ unit buildings).
- This rent runs 34% of the median local income ($75k/yr) — at the standard rent-burdened threshold; future hikes will face affordability resistance.
Forward outlook
- Local home prices are declining (-3.0%/yr); year-one equity from $2k of loan paydown is wiped out by about $9k of value loss. Plan a longer hold.
- Escambia County population projected at +13% by 2050 — modest demand growth; plan on rents tracking national, not racing it.
Negotiation context
- Only 1 days on market — expect competitive offers; lowballing is unlikely to land.
- 2 sale attempts since 25y ago with the ask held roughly flat each time — persistent listings suggest the price (not the market) is what's stuck; bring a comps-based counter.
- Current owner paid $22k; list at $288k implies a 1178% gain — meaningful room to come down on a strong offer.
Risks & watch-outs
- Climate carrying-cost: severe wind risk, 99% chance of damaging wind over 30y; extreme-heat days projected 6→18/yr by 2055 (HVAC capex compounding) — expect insurance premiums to compound above CPI over the hold.
Questions for the listing agent
- What do current leases actually rent for vs. the listed asking? Can we see a recent rent roll and the last 12 months of T-12 income?
- Is there a deadline driving the sale (1031 exchange, divorce, estate, relocation)? That informs how much negotiation room exists.
- Schools are D-rated, which usually means shorter tenancies and higher turnover. Who's the typical renter profile here, and what's been the actual vacancy rate?
- The area grade is low — what's the realistic commute time and amenity access for the typical tenant pool here? Any planned neighborhood developments (good or bad) we should know about?
- What's the average days-on-market for RENTAL listings here right now (not sales)? A rising rental-DOM trend means longer vacancies and softer asking-rent achievability than the comps imply.
- What's the recent tenant-quality profile in this submarket — average credit score on applications, eviction rate, late-payment / NSF rate, and stable-employment percentage? A property-management company in the area should have these aggregated.
- How much new for-sale + rental construction is in the pipeline within 1–3 miles? Heavy new supply typically softens prices + rents 12–24 months out; constrained supply supports both.
Investment metrics
- 1% rule
- 0.74% ✗
- Cap rate
- 6.16%
- Cash-on-cash
- -0.47%
- DSCR
- 0.98
- GRM
- 11.3
CMA / ARV
- ARV (on-the-fly)
- $325,274
- Comps found
- 2
Show comp detail 2 sales within ~0.75 mi
| Address | Dist | Beds/Ba | Sqft | Sold | Price | $/sf | Match |
|---|---|---|---|---|---|---|---|
| 7088 Woodside Dr | 0.16mi | 4/2.0 (+1) | 1,783 (+13%) | 21mo | $328,000 | $184 | 45 |
| 7504 Beulah School Rd | 0.75mi | 3/2.0 | 1,642 (+4%) | 24mo | $339,000 | $206 | 35 |
Match score weights: distance 35% · size 25% · config 20% · recency 20%. Top-matched comps best support the ARV.
Projected returns pro-forma
-3.0% appreciation · 4.42% rent growth · sell at horizon
- IRR
- -15.8%
- Equity multiple
- 0.43×
- Total profit
- $-45,665
- Equity at exit
- $42,867
- IRR
- -5.4%
- Equity multiple
- 0.63×
- Total profit
- $-29,939
- Equity at exit
- $24,858
Cash invested: $80,500 (down + closing). Projections, not guarantees.
Landlord ↔ Tenant lean methodology
- Overall (STATE)
- 87 Strongly Landlord-Friendly
- State Florida
- 87 Strongly Landlord-Friendly · R+3
- County
- — inherits STATE
- City
- — inherits STATE
ZIP-level market 32526
- Home prices YoY
- -28.3%
- Rents YoY
- 4.4%
- Active inventory
- 421
- Price-to-rent
- 11.3×
Monthly cashflow live
- Estimated rent
- $2,121 high interval (Pro) →
- Mortgage (P&I)
- −$1,508
- Tax from tax record
- −$80 /mo · $960/yr
- Insurance
- −$120
- HOA
- −$0
- Vacancy / Maint / Mgmt
- −$445
- Net cashflow
- $-32
Break-even live
Sensitivity live
| Price | -10% $131 | -5% $50 | +0% $-32 | +5% $-113 | +10% $-194 |
|---|---|---|---|---|---|
| Rent | -10% $-199 | -5% $-115 | +0% $-32 | +5% $52 | +10% $136 |
| Rate | -1.0pp $113 | -0.5pp $42 | base $-32 | +0.5pp $-106 | +1.0pp $-182 |
UW: 25.0% down · 7.5% · 30yr · 1.5% tax · 5.0% vac · 8.0% maint · 8.0% mgmt
Financing live
Cash to close
- Down payment
- $71,875
- Closing costs
- $8,625
- Reserves months
- —
- Total cash needed
- —
Loan-product check · same deal, 3 products live
Conventional
25% down · 7.5% · 30yr
- Down + closing
- —
- Monthly P&I
- —
- Monthly cashflow
- —
- DSCR
- —
- Eligible?
- —
Personal DTI + credit; lowest rate.
DSCR
20% down · 8.5% · 30yr
- Down + closing
- —
- Monthly P&I
- —
- Monthly cashflow
- —
- DSCR
- —
- Eligible?
- —
No personal income docs; deal must DSCR.
Hard money
10% down · 12.0% · 12mo
- Down + closing
- —
- Monthly P&I
- —
- Monthly cashflow
- —
- DSCR
- —
- Eligible?
- —
Short-term bridge; refi at stabilization.
Rent comps 5 comps
| Address | Beds | Baths | Sqft | Rent | $/sqft | DOM | Units | Dist |
|---|---|---|---|---|---|---|---|---|
| 6550 Paso Fino Dr Pensacola, FL | 3.0 | 2.0 | 1899 | $2,050 | $1.08 | 22d | 1 | 0.91mi |
| 6081 Secretariat Way Pensacola, FL | 4.0 | 2.0 | 1783 | $2,125 | $1.19 | 25d | 1 | 1.30mi |
| 7748 Alydar Loop Pensacola, FL | 4.0 | 2.0 | 1787 | $1,950 | $1.09 | 25d | 1 | 1.33mi |
| 7024 Tepin Ct Pensacola, FL | 4.0 | 2.0 | 1433 | $2,000 | $1.40 | 25d | 1 | 1.45mi |
| 6161 Native Dancer Way Pensacola, FL | 4.0 | 2.0 | 1787 | $1,895 | $1.06 | 25d | 1 | 1.47mi |
Listing history 5 events
-
2026-05-15status Pending
-
2026-05-14$287,500 Active
-
2001-06-04soldstatus $22,500
-
2001-05-31soldstatus $22,500 70-char remark
Show marketing remark (70 chars)
MANY LARGE HOMESITES AVAILABLE IN A NEW PHASE** OF WOODSIDE ESTATES II
-
2001-04-25$22,500 70-char remark
Show marketing remark (70 chars)
MANY LARGE HOMESITES AVAILABLE IN A NEW PHASE** OF WOODSIDE ESTATES II
ⓘ Source: listings_history table (triggers on properties + properties_extension) + one-shot
backfill from property_details.listing_events for pre-trigger history.
Tax reassessment forecast FL · Resets to sale price
- Current annual tax
- $960 · $80/mo
- Projected year-2 tax
- $2,386 · $199/mo
- Expected delta
- +$1,426/yr (+$119/mo · 148.6%)
ⓘ Screening estimate from a state-policy table — verify with the county assessor before closing.
Climate risk First Street
- Flood 1/10 Low FEMA zone X (unshaded) · 0% chance over 30 yrs
- Wildfire 3/10 Moderate
- Heat 10/10 Extreme 6 d/yr ≥105°F today · 18 d/yr by 30 yrs out
- Wind 9/10 Extreme 99% chance of damaging wind over 30 yrs
- Air quality 1/10 Low 0 unhealthy d/yr today · 0 by 30 yrs out
Nearby sold comps map
Loading sold comps map…
Walkable amenities ~0.75 mi
Loading nearby amenities…
Taxation est. · year 1
- Rental income
- $25,457
- − Mortgage interest
- −$16,104
- − Property taxes
- −$960
- − Insurance
- −$1,438
- − Repairs & maintenance
- −$2,037
- − Management
- −$2,037
- − Depreciation
- −$8,364
- Taxable loss
- −$5,482
- Est. tax savings @ 24.0%
- +$1,316
- After-tax cash flow
- $937/yr
For passive investors: Depreciation is non-cash, so a rental often shows a tax loss while cash-flowing — sheltering income. Rental losses are passive: they offset passive income freely, and up to $25,000/yr can offset ordinary (W-2) income if you actively participate and your MAGI is under $100k (phasing out to $0 by $150k); unused losses carry forward. On sale, claimed depreciation is recaptured at up to 25%, and gains may owe capital-gains tax (a 1031 exchange can defer both). Figures are a year-1 estimate at your 24.0% rate — not tax advice; consult a CPA.
Schools (NCES district)
- District
- Escambia
- NCES district ID
- 1200510
- Math proficiency
- 40% ▼ -9.00%
- Reading proficiency
- 45% ▼ -4.00%
- Median HH income
- $44,649
- Composite
- 36.04/100
- National rank
- #4773
- State rank
- #56 of 73 in FL
Livability — Bellview
- Score
- 67/100
- State rank
- #561
- US rank
- #10731
Category grades
Schools grade is shown separately in the Schools card above.
Census & demographics
- County
- Escambia County · 301,722 people
- Metro
- Pensacola-Ferry Pass-Brent, FL
- Population (ZIP)
- 44,680
- Household income
- $75,098
- Rent vs Own
- Severe rent burden
- 1166.0
Population outlook (Escambia County) Hauer SSP2
- Today (2025)
- 334,637 people
- By 2030
- 345,779 · +3.3%
- By 2040
- 364,828 · +9.0%
- By 2050
- 378,514 · +13.1%
- By 2075
- 403,220 · +20.5%
- By 2100
- 386,125 · +15.4%
Race, ethnicity, and origin ACS 2023
- Neighborhood character
- Predominantly White (66%)
- Race & ethnicity
- White 66% Black 19% Two or more races 8% Hispanic / Latino 5% Asian 3%
- Common ancestry
- Lithuanian 2% Slovak 2% Serbian 2%
- Foreign-born
- 5% · Canada, China
- Languages at home
- 94% English-only · Spanish 2% Tagalog/Filipino 1% Other Indo-European 1%
Political lean MEDSL · Escambia
- 2024 margin
- R (+19.5) · D 39.7% · R 59.2% · Other 1.1%
- 2008→2024 swing
- -0.2pp no change · 2008: -19.3pp · 2024: -19.5pp
- All cycles
- 2024: R+19.5 2020: R+15.1 2016: R+20.6 2012: R+20.6 2008: R+19.3
Not yet ingested
- Civics
- —
Market trends
- HPI YoY
- ▼ -99.68%
- Current HPI
- 252.6406
- Rent YoY
- ▲ 4.42%
- Metro
- Pensacola-Ferry Pass-Brent, FL
- State GDP YoY
- ▲ 3.28%
- F500 in state
- 36
Industry mix (Fortune 500 HQ in FL)
| Industry | F500 HQs | Revenue |
|---|---|---|
| Industrial Technology | 2 | $29B |
|
||
| Insurance | 2 | $17B |
|
||
| Retail | 1 | $60B |
|
||
| Technology Distribution | 1 | $58B |
|
||
| Homebuilding | 1 | $35B |
|
||
| Technology Manufacturing | 1 | $35B |
|
||
Price history
+1177.8% since first listed5 events — show timeline
- 2026-05-15 Pending — PARMLS
- 2026-05-14 Listed $287,500 PARMLS
- 2001-06-04 Sold (Public Records) $22,500 Public Records
- 2001-05-31 Sold (MLS) $22,500 PARMLS
- 2001-04-25 Listed $22,500 PARMLS
Property tax history
-1.0%/yrLatest (2025): $960 · +25.9% YoY. Source: county tax records.
Cash-flow waterfall
monthlySold comps — $/sqft
last 12 mo · ≤1 miLoading sold comps…