815 Kissell Rd · Wilmer, TX
Flood risk 1/10 · Minimal
- FEMA flood zone
- X (unshaded)
- Chance of flooding over 30 yrs
- 0.0%
- Est. flood insurance / yr
- $507 – $1,088
Fire risk 4/10 · Minor
- Est. fire insurance / yr
- $1,222 – $2,270
Heat risk 8/10 · Major
- Hot days now (above 112°F)
- 7 days/yr
- Hot days in 30 yrs
- 24 days/yr
Wind risk 6/10 · Moderate
- Chance of severe wind over 30 yrs
- 27.0%
Air-quality risk 2/10 · Minimal
- Unhealthy air days now
- 1 days/yr
- Unhealthy air days in 30 yrs
- 1 days/yr
Risk factors via First Street. Map © Google.
Why this score? — see what drove the A- grade
The composite is a weighted blend of 9 inputs, each scored 0–100. Each bar is that input's sub-score; the figure is the points it added to the 100-point composite (weight × sub-score).
- Cash flow +28.2/30.0
- ARV discount +15.0/15.0
- DSCR +10.0/10.0
- 1% rule +9.5/10.0
- Appreciation +6.9/10.0
- Livability +3.0/5.0
- Schools +2.8/10.0
- Rent growth +2.5/5.0
- Condition / age +2.5/5.0
$110,000
🖨 Deal sheet (PDF) 📄 Offer letter ✓ Due diligence
Listing remarks
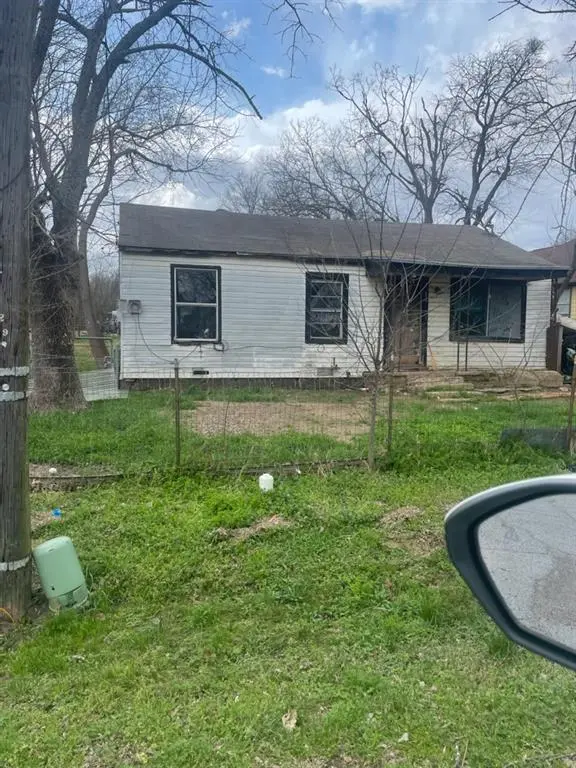
Single-family home featuring on a generous 0.2-acre lot. The smaller footprint allows for an efficient renovation, while the large lot offers ample room for outdoor improvements, potential expansion, or enhanced curb appeal. The home requires TLC and is perfectly suited. Conveniently located near major highway access, it ensures long-term rental appeal and an easy commute. Sold strictly AS-IS. Property is boarded up.
Key facts
- 0.2-acre lot
- Easy commute
- Enhanced curb appeal
Tags
Property features AI
Finance
- Financial info: Listing is cash only; No second mortgage indicated
- HOA & community: No association
Exterior
- Parking: No covered parking or carport; no designated parking features listed
- Utilities: City water; City sewer; Not in a municipal utility district
- Home design: Single-family residence; One story; Entry level: Main level
- Construction: Frame construction; Pillar/post/pier foundation; Built in 1955
- Exterior features: Lot under 0.5 acre (approximately 0.205 acres); City sewer and city water
Interior
- Kitchen: No appliances included
- Bedrooms: Two bedrooms (both on the main level)
- Flooring: Vinyl flooring
- Bathrooms: One full bathroom
- Interior features: Four total rooms; One living area; One dining area; Other interior features
- Laundry & utility: No laundry appliances listed
Neighborhood map
What this means for you Summary
Snapshot
- This is a 2-bed/1.0-bath single-family listed at $110k.
Deal economics
- At list price, monthly cash flow is $348 ($4k/yr) — positive.
- The deal already cash-flows at list — no discount required.
- Meets the 1% rule at list price ($2k rent vs $110k).
- Recommended offer: $107k (3.0% below list) — sets the bar for market timing.
- Cap rate 10.1% vs local median 4.8% in Wilmer — top-decile yield for the area; either an underpriced asset or a hidden risk that comps aren't pricing in. Stress-test before assuming the spread holds.
Location & tenants
- Location reads 60/100 on livability (#1,054 in TX) — a middle-class / working-renter tenant base. Strengths: cost of living A+, housing A+; Watch: crime C-, amenities F, commute F.
- Dallas ISD (urban): math 31% / reading 36% proficiency, ranked #559 of 826 in TX (top 68%) — families likely to look elsewhere, expect single-tenant / working-renter base with shorter leases; 83% free/reduced lunch — lower-income household profile, screen leases tightly.
- Zoned schools: Eddie Bernice Johnson Stem Academy (math 27% / reading 27%, grade F, #2,791 of 4,322 statewide, top 68%, 502 students, 92% FRL).
- Market conditions: 42 active listings in the ZIP; 5 comparable units currently listed for rent nearby; rentals leasing fast (median 0d on market — plan ~1-2 weeks tenant-placement turnaround); 12,577 units permitted in Dallas County in 2024 (6,829 in 5+ unit buildings).
Forward outlook
- In year one you build about $5k of equity ($761 loan paydown + $4k appreciation (3.7% local appreciation)).
- Dallas County population projected at +35% by 2050 — long-run rental-demand tailwind backs the buy-and-hold thesis.
- At projected returns (3.7% appreciation + 3.0% rent growth), your $31k cash investment doubles in ~4 years — after that, you're playing with house money.
- By year 7, paydown + projected appreciation supports a ~$31k cash-out refi (75% LTV) — recoverable capital for the next deal without selling this one.
Negotiation context
- It's been on market 48 days — a 3% lower offer ($107k) is reasonable based on typical stale-listing flexibility.
Risks & watch-outs
- Watch-outs: property tax is 3.2% of price; built in 1955 — expect roof / HVAC / electrical / plumbing capex.
- Climate carrying-cost: major wind risk, 27% chance of damaging wind over 30y; extreme-heat days projected 7→24/yr by 2055 (HVAC capex compounding) — expect insurance premiums to compound above CPI over the hold.
Questions for the listing agent
- It's been on market 48 days. Have you received any prior offers? Is the seller open to a 3% concession, seller financing, or rate buy-down credit?
- Built in 1955 — when were the roof, HVAC, electrical panel, plumbing, and water heater last replaced?
- Property tax is high relative to price — has the assessment been appealed recently, and will the sale trigger a re-assessment?
- Is there a deadline driving the sale (1031 exchange, divorce, estate, relocation)? That informs how much negotiation room exists.
- Schools are F-rated, which usually means shorter tenancies and higher turnover. Who's the typical renter profile here, and what's been the actual vacancy rate?
- What's the average days-on-market for RENTAL listings here right now (not sales)? A rising rental-DOM trend means longer vacancies and softer asking-rent achievability than the comps imply.
- What's the recent tenant-quality profile in this submarket — average credit score on applications, eviction rate, late-payment / NSF rate, and stable-employment percentage? A property-management company in the area should have these aggregated.
- How much new for-sale + rental construction is in the pipeline within 1–3 miles? Heavy new supply typically softens prices + rents 12–24 months out; constrained supply supports both.
Investment metrics
- 1% rule
- 1.45% ✓
- Cap rate
- 10.09%
- Cash-on-cash
- 13.55%
- DSCR
- 1.60
- GRM
- 5.7
CMA / ARV
- ARV (median comp)
- $173,627
- List price
- $110,000
- Delta
- -36.65%
- Verdict
- UNDERPRICED
- Comps
- 15 within 1.0 mi
Show comp detail 5 sales within ~0.75 mi
| Address | Dist | Beds/Ba | Sqft | Sold | Price | $/sf | Match |
|---|---|---|---|---|---|---|---|
| 315 Johnson St | 0.17mi | 2/1.0 | 816 (0%) | 6mo | $125,000 | $153 | 87 |
| 320 Thorne St | 0.15mi | 3/1.0 (+1) | 816 (0%) | 18mo | $140,000 | $172 | 73 |
| 230 Cottonwood Dr | 0.12mi | 3/1.0 (+1) | 840 (+3%) | 24mo | $194,900 | $232 | 64 |
| 211 Wilmer Heights Dr | 0.63mi | 3/1.0 (+1) | 888 (+9%) | 18mo | $189,000 | $213 | 35 |
| 202 Wilmer Heights Dr | 0.68mi | 3/1.0 (+1) | 884 (+8%) | 22mo | $179,900 | $204 | 31 |
Match score weights: distance 35% · size 25% · config 20% · recency 20%. Top-matched comps best support the ARV.
Projected returns pro-forma
3.73% appreciation · 3.0% rent growth · sell at horizon
- IRR
- 21.9%
- Equity multiple
- 2.29×
- Total profit
- $39,805
- Equity at exit
- $54,027
- IRR
- 22.3%
- Equity multiple
- 4.43×
- Total profit
- $105,697
- Equity at exit
- $87,002
Cash invested: $30,800 (down + closing). Projections, not guarantees.
Landlord ↔ Tenant lean methodology
- Overall (STATE)
- 87 Strongly Landlord-Friendly
- State Texas
- 87 Strongly Landlord-Friendly · R+5
- County
- — inherits STATE
- City
- — inherits STATE
ZIP-level market 75172
- Home prices YoY
- 1.7%
- Active inventory
- 42
- Price-to-rent
- 5.7×
Monthly cashflow live
- Estimated rent
- $1,596 high interval (Pro) →
- Mortgage (P&I)
- −$577
- Tax from tax record
- −$290 /mo · $3,484/yr
- Insurance
- −$46
- HOA
- −$0
- Vacancy / Maint / Mgmt
- −$335
- Net cashflow
- $348
Break-even live
Sensitivity live
| Price | -10% $410 | -5% $379 | +0% $348 | +5% $317 | +10% $285 |
|---|---|---|---|---|---|
| Rent | -10% $222 | -5% $285 | +0% $348 | +5% $411 | +10% $474 |
| Rate | -1.0pp $403 | -0.5pp $376 | base $348 | +0.5pp $319 | +1.0pp $290 |
UW: 25.0% down · 7.5% · 30yr · 1.5% tax · 5.0% vac · 8.0% maint · 8.0% mgmt
Financing live
Cash to close
- Down payment
- $27,500
- Closing costs
- $3,300
- Reserves months
- —
- Total cash needed
- —
Loan-product check · same deal, 3 products live
Conventional
25% down · 7.5% · 30yr
- Down + closing
- —
- Monthly P&I
- —
- Monthly cashflow
- —
- DSCR
- —
- Eligible?
- —
Personal DTI + credit; lowest rate.
DSCR
20% down · 8.5% · 30yr
- Down + closing
- —
- Monthly P&I
- —
- Monthly cashflow
- —
- DSCR
- —
- Eligible?
- —
No personal income docs; deal must DSCR.
Hard money
10% down · 12.0% · 12mo
- Down + closing
- —
- Monthly P&I
- —
- Monthly cashflow
- —
- DSCR
- —
- Eligible?
- —
Short-term bridge; refi at stabilization.
Rent comps 5 comps
| Address | Beds | Baths | Sqft | Rent | $/sqft | DOM | Units | Dist |
|---|---|---|---|---|---|---|---|---|
| 5900 S Interstate Highway 45 Wilmer, TX | 1.0–3.0 | 1.0–2.0 | 988 | $1,549 | $1.57 | 0d | 9 | 0.95mi |
| 607 Keats Rd Wilmer, TX | 3.0 | 2.0 | 952 | $1,750 | $1.84 | 44d | 1 | 0.96mi |
| 101 W Pleasant Run Rd Wilmer, TX | 2.0–3.0 | 2.0 | 1088 | $1,549 | $1.42 | 0d | 1 | 0.99mi |
| 6000 S Interstate Highway 45 Wilmer, TX | 1.0–4.0 | 1.0–2.0 | 988 | $1,522 | $1.54 | 0d | 13 | 1.00mi |
| 301 Mars Rd Wilmer, TX | 1.0–3.0 | 1.0–2.0 | 965 | $1,596 | $1.65 | 0d | 24 | 1.49mi |
Listing history 18 events
-
2026-06-21days on market $110,000 Active 48 DOM
-
2026-06-18days on market $110,000 Active 45 DOM
-
2026-06-17days on market $110,000 Active 44 DOM
-
2026-06-16days on market $110,000 Active 43 DOM
-
2026-06-15days on market $110,000 Active 42 DOM
-
2026-06-13days on market $110,000 Active 40 DOM
-
2026-06-09days on market $110,000 Active 36 DOM
-
2026-06-08days on market $110,000 Active 35 DOM
-
2026-06-07days on market $110,000 Active 34 DOM
-
2026-06-04days on market $110,000 Active 31 DOM
-
2026-06-03days on market $110,000 Active 30 DOM
-
2026-06-02days on market $110,000 Active 29 DOM
-
2026-06-01days on market $110,000 Active 28 DOM
-
2026-05-31days on market $110,000 Active 27 DOM
-
2026-05-04$110,000 Active 420-char remark
-
2004-01-16soldstatus
-
2002-03-19soldstatus
-
1999-04-29soldstatus
ⓘ Source: listings_history table (triggers on properties + properties_extension) + one-shot
backfill from property_details.listing_events for pre-trigger history.
Tax reassessment forecast TX · Resets to sale price
- Current annual tax
- $3,484 · $290/mo
- Projected year-2 tax
- $3,484 · $290/mo
- Expected delta
- $0/yr ($0/mo · 0.0%)
ⓘ Screening estimate from a state-policy table — verify with the county assessor before closing.
Climate risk First Street
- Flood 1/10 Low FEMA zone X (unshaded) · 0% chance over 30 yrs
- Wildfire 4/10 Moderate
- Heat 8/10 Severe 7 d/yr ≥112°F today · 24 d/yr by 30 yrs out
- Wind 6/10 Major 27% chance of damaging wind over 30 yrs
- Air quality 2/10 Low 1 unhealthy d/yr today · 1 by 30 yrs out
Nearby sold comps map
Loading sold comps map…
Walkable amenities ~0.75 mi
Loading nearby amenities…
Taxation est. · year 1
- Rental income
- $19,150
- − Mortgage interest
- −$6,162
- − Property taxes
- −$3,484
- − Insurance
- −$550
- − Repairs & maintenance
- −$1,532
- − Management
- −$1,532
- − Depreciation
- −$3,200
- Taxable income
- $2,690
- Est. tax owed @ 24.0%
- −$646
- After-tax cash flow
- $3,526/yr
For passive investors: Depreciation is non-cash, so a rental often shows a tax loss while cash-flowing — sheltering income. Rental losses are passive: they offset passive income freely, and up to $25,000/yr can offset ordinary (W-2) income if you actively participate and your MAGI is under $100k (phasing out to $0 by $150k); unused losses carry forward. On sale, claimed depreciation is recaptured at up to 25%, and gains may owe capital-gains tax (a 1031 exchange can defer both). Figures are a year-1 estimate at your 24.0% rate — not tax advice; consult a CPA.
Schools (NCES district)
- District
- Dallas ISD
- NCES district ID
- 4816230
- Math proficiency
- 31% ▼ -16.00%
- Reading proficiency
- 36% ▼ -4.00%
- Median HH income
- $42,881
- Composite
- 28.41/100
- National rank
- #6763
- State rank
- #559 of 826 in TX
Livability — Wilmer
- Score
- 60/100
- State rank
- #1054
- US rank
- #18696
Category grades
Schools grade is shown separately in the Schools card above.
Census & demographics
- Census place
- Wilmer, TX
- City population
- 5,873
- Population (ZIP)
- 5,873
Population outlook (Dallas County) Hauer SSP2
- Today (2025)
- 2,979,839 people
- By 2030
- 3,191,823 · +7.1%
- By 2040
- 3,619,611 · +21.5%
- By 2050
- 4,026,915 · +35.1%
- By 2075
- 4,957,073 · +66.4%
- By 2100
- 5,508,725 · +84.9%
Race, ethnicity, and origin ACS 2023
- Neighborhood character
- Diverse neighborhood (Simpson 0.64)
- Race & ethnicity
- Hispanic / Latino 47% Black 31% White 22% Two or more races 14%
- Hispanic origin (detail)
- Mexican 40%
- Common ancestry
- Lithuanian 1% Iranian 1%
- Foreign-born
- 17% · Canada
- Languages at home
- 54% English-only · Spanish 46%
Political lean MEDSL · Dallas
- 2024 margin
- Strong D (+22.2) · D 60.2% · R 38.0% · Other 1.8%
- 2008→2024 swing
- +6.9pp toward D · 2008: 15.3pp · 2024: 22.2pp
- All cycles
- 2024: D+22.2 2020: D+31.6 2016: D+26.2 2012: D+15.4 2008: D+15.3
Not yet ingested
- Civics
- —
Market trends
- HPI YoY
- ▲ 3.73%
- Current HPI
- 221.1676
- Rent YoY
- —
- Metro
- —
- State GDP YoY
- ▲ 3.95%
- F500 in state
- 110
Industry mix (Fortune 500 HQ in TX)
| Industry | F500 HQs | Revenue |
|---|---|---|
| Energy | 16 | $1,198B |
|
||
| Technology | 5 | $198B |
|
||
| Engineering / Construction | 4 | $72B |
|
||
| Energy Services | 3 | $60B |
|
||
| Utilities | 3 | $41B |
|
||
| Healthcare | 2 | $330B |
|
||
Price history
4 events — show timeline
- 2026-05-04 Listed $110,000 NTREIS
- 2004-01-16 Sold (Public Records) — Public Records
- 2002-03-19 Sold (Public Records) — Public Records
- 1999-04-29 Sold (Public Records) — Public Records
Property tax history
+11.9%/yrLatest (2025): $3,484 · -1.5% YoY. Source: county tax records.
Cash-flow waterfall
monthlySold comps — $/sqft
last 12 mo · ≤1 miLoading sold comps…