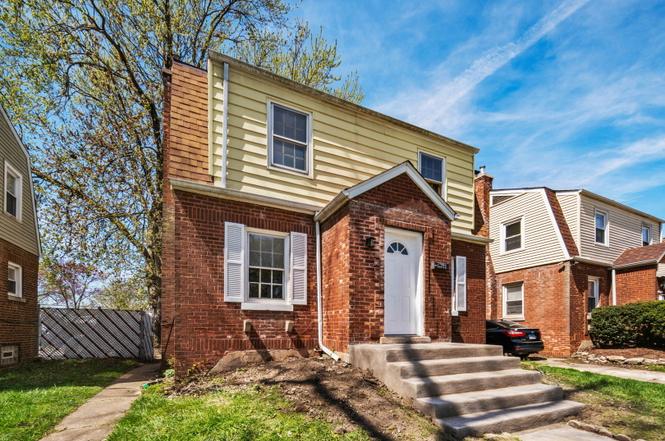
12532 S Throop St · Calumet Park, IL
Flood risk 1/10 · Minimal
- FEMA flood zone
- X (unshaded)
- Chance of flooding over 30 yrs
- 0.0%
- Est. flood insurance / yr
- $473 – $860
Fire risk 1/10 · Minimal
- Est. fire insurance / yr
- $804 – $1,492
Heat risk 3/10 · Minor
- Hot days now (above 101°F)
- 7 days/yr
- Hot days in 30 yrs
- 15 days/yr
Wind risk 2/10 · Minimal
- Chance of severe wind over 30 yrs
- —
Air-quality risk 4/10 · Minor
- Unhealthy air days now
- 4 days/yr
- Unhealthy air days in 30 yrs
- 6 days/yr
Risk factors via First Street. Map © Google.
Why this score? — see what drove the D+ grade
The composite is a weighted blend of 9 inputs, each scored 0–100. Each bar is that input's sub-score; the figure is the points it added to the 100-point composite (weight × sub-score).
- Cash flow +14.1/30.0
- ARV discount +11.8/15.0
- 1% rule +5.9/10.0
- Rent growth +4.5/5.0
- DSCR +4.3/10.0
- Livability +3.6/5.0
- Condition / age +2.5/5.0
- Schools +1.6/10.0
- Appreciation +0.0/10.0
$164,000
🖨 Deal sheet (PDF) 📄 Offer letter ✓ Due diligence
Listing remarks
Beautiful home to call your own; it has passed all village inspections! Fully renovated property with a full finished basement for all your laundry and storage needs. Property has been updated: new furnace, new roof, all new windows, kitchen, appliances, electrical upgrades, cabinetry, flooring, bath, front porch, drywall, paint, and refinished hardwood floors. 2 car garage with opener provides plenty of room for cars, bikes, and/or a workshop. Sizeable backyard that will be perfect for summer entertaining and bar-b-ques. Nothing to do but move in. Potential to add a third bedroom and another bathroom in the basement.
Key facts
- Updated appliances
- Finished basement
- Updated kitchen
Tags
Property features AI
Finance
- Other: Built before 1978
- HOA & community: No master association fee required
Exterior
- Parking: Detached garage (owned) with 2 garage spaces; 2 total parking spaces
- Utilities: Public water; Public sewer
- Home design: Detached single-family home; 1.5-story; Fee simple ownership; Rebuilt in 2023 (property originally built ~81–90 years ago)
- Construction: Frame construction
- Exterior features: Lot under 0.25 acre; Lot dimensions: 5000
Interior
- Kitchen: Kitchen on main level (8 x 10)
- Bedrooms: 2 bedrooms total; Master bedroom on second level (15 x 11); Second bedroom on second level (18 x 10); Additional bedrooms listed
- Bathrooms: 1 full bathroom
- Heating & cooling: Forced air heating
- Interior features: Unfinished full basement; 5 total rooms
- Laundry & utility: Laundry room
Neighborhood map
What this means for you Summary
Snapshot
- This is a 3-bed/1.0-bath single-family listed at $164k.
Deal economics
- At list price, monthly cash flow is $25 ($305/yr) — positive.
- The deal already cash-flows at list — no discount required.
- Meets the 1% rule at list price ($2k rent vs $164k).
- Recommended offer: $144k (12.0% below list) — sets the bar for market timing.
Location & tenants
- Location reads 72/100 on livability (#308 in IL) — a middle-class / working-renter tenant base. Strengths: commute A+, cost of living A+, housing A+; Watch: employment C-, crime F.
- Chsd 218 (suburban): math 14% / reading 20% proficiency, ranked #454 of 620 in IL (top 73%) — low school quality limits family demand, transient renter base, plan for 1-2y turnover.
- Zoned schools: Burr Oak Academy (318 students, 0% FRL); Calumet Elem School (math 24% / reading 24%, grade F, #332 of 665 statewide, top 55%, 310 students, 0% FRL); H L Richards High Sch(Campus) (math 17% / reading 20%, grade F, #427 of 693 statewide, top 62%, 1,676 students, 0% FRL).
- Market conditions: Rents rising fast (+7.8%/yr); 77 active listings in the ZIP; 14 comparable units currently listed for rent nearby; rentals at typical pace (median 14d on market — plan ~3-4 weeks tenant-placement turnaround); lower-income renter base — watch delinquency; 6,272 units permitted in Cook County in 2024 (4,658 in 5+ unit buildings).
- At $1,791/mo this rent would consume 58% of the median local household income ($37k/yr) (locally 1868% of renters already pay >50% of income on rent) — very limited rent-growth headroom before tenants either downsize or default.
Forward outlook
- Local home prices are declining (-3.0%/yr); year-one equity from $1k of loan paydown is wiped out by about $5k of value loss. Plan a longer hold.
Negotiation context
- It's been on market 166 days — a 12% lower offer ($144k) is reasonable based on typical stale-listing flexibility.
- 15 sale attempts since 4y ago; this cycle's ask is 9271% above the opening price — seller raised mid-cycle; expect resistance to lowballs.
- Current owner paid $70k; list at $164k implies a 133% gain — meaningful room to come down on a strong offer.
Risks & watch-outs
- Watch-outs: property tax is 3.4% of price; built in 1938 — expect roof / HVAC / electrical / plumbing capex.
Questions for the listing agent
- It's been on market 166 days. Have you received any prior offers? Is the seller open to a 12% concession, seller financing, or rate buy-down credit?
- Built in 1938 — when were the roof, HVAC, electrical panel, plumbing, and water heater last replaced?
- Property tax is high relative to price — has the assessment been appealed recently, and will the sale trigger a re-assessment?
- Why hasn't it sold? Are there any deal-killer items the seller is aware of (foundation, flood, title, zoning, code violations)?
- Is there a deadline driving the sale (1031 exchange, divorce, estate, relocation)? That informs how much negotiation room exists.
- Schools are F-rated, which usually means shorter tenancies and higher turnover. Who's the typical renter profile here, and what's been the actual vacancy rate?
- Crime grade is F in this area — have there been break-ins, vandalism, or insurance claims at this property in the last 3 years? What carrier currently insures it and at what premium?
- The area grade is low — what's the realistic commute time and amenity access for the typical tenant pool here? Any planned neighborhood developments (good or bad) we should know about?
- What's the average days-on-market for RENTAL listings here right now (not sales)? A rising rental-DOM trend means longer vacancies and softer asking-rent achievability than the comps imply.
- What's the recent tenant-quality profile in this submarket — average credit score on applications, eviction rate, late-payment / NSF rate, and stable-employment percentage? A property-management company in the area should have these aggregated.
- How much new for-sale + rental construction is in the pipeline within 1–3 miles? Heavy new supply typically softens prices + rents 12–24 months out; constrained supply supports both.
Investment metrics
- 1% rule
- 1.09% ✓
- Cap rate
- 6.48%
- Cash-on-cash
- 0.66%
- DSCR
- 1.03
- GRM
- 7.6
CMA / ARV
- ARV (on-the-fly)
- $181,398
- Comps found
- 12
Show comp detail 12 sales within ~0.75 mi
| Address | Dist | Beds/Ba | Sqft | Sold | Price | $/sf | Match |
|---|---|---|---|---|---|---|---|
| 12509 S Throop St | 0.06mi | 3/1.0 | 1,216 (-2%) | 2mo | $141,270 | $116 | 93 |
| 12427 S Ada St | 0.15mi | 3/1.5 | 1,152 (-7%) | 0mo | $215,000 | $187 | 80 |
| 12726 S Justine St | 0.40mi | 3/1.5 | 1,224 (-1%) | 2mo | $165,000 | $135 | 76 |
| 12816 S Laflin St | 0.43mi | 3/1.0 | 1,200 (-3%) | 2mo | $135,000 | $113 | 74 |
| 12416 S Carpenter St | 0.35mi | 4/1.0 (+1) | 1,253 (+2%) | 3mo | $112,500 | $90 | 73 |
| 12334 S Loomis St | 0.30mi | 3/2.0 | 1,173 (-5%) | 1mo | $136,000 | $116 | 73 |
| 12806 S Laflin St | 0.40mi | 4/2.0 (+1) | 1,200 (-3%) | 1mo | $279,000 | $233 | 67 |
| 12930 S Carpenter St | 0.55mi | 4/2.5 (+1) | 1,231 (-0%) | 2mo | $269,000 | $219 | 61 |
| 1021 W Vermont Ave | 0.50mi | 3/1.0 | 1,118 (-9%) | 2mo | $180,000 | $161 | 59 |
| 12230 S Elizabeth St | 0.40mi | 3/2.0 | 1,400 (+14%) | 2mo | $217,000 | $155 | 53 |
| 12154 S Justine St | 0.58mi | 3/1.5 | 1,092 (-12%) | 1mo | $160,053 | $147 | 51 |
| 12820 S Sangamon St | 0.57mi | 3/1.0 | 1,077 (-13%) | 4mo | $157,500 | $146 | 49 |
Match score weights: distance 35% · size 25% · config 20% · recency 20%. Top-matched comps best support the ARV.
Projected returns pro-forma
-3.0% appreciation · 7.82% rent growth · sell at horizon
- IRR
- -8.8%
- Equity multiple
- 0.66×
- Total profit
- $-15,664
- Equity at exit
- $24,453
- IRR
- 7.0%
- Equity multiple
- 1.66×
- Total profit
- $30,487
- Equity at exit
- $14,180
Cash invested: $45,920 (down + closing). Projections, not guarantees.
Landlord ↔ Tenant lean methodology
- Overall (STATE)
- 43 Moderately Tenant-Leaning
- State Illinois
- 43 Moderately Tenant-Leaning · D+7
- County
- — inherits STATE
- City
- — inherits STATE
ZIP-level market 60827
- Home prices YoY
- -31.8%
- Rents YoY
- 7.8%
- Active inventory
- 77
- Price-to-rent
- 7.6×
Monthly cashflow live
- Estimated rent
- $1,791 high interval (Pro) →
- Mortgage (P&I)
- −$860
- Tax from tax record
- −$461 /mo · $5,531/yr
- Insurance
- −$68
- HOA
- −$0
- Vacancy / Maint / Mgmt
- −$376
- Net cashflow
- $25
Break-even live
Sensitivity live
| Price | -10% $118 | -5% $72 | +0% $25 | +5% $-21 | +10% $-67 |
|---|---|---|---|---|---|
| Rent | -10% $-116 | -5% $-45 | +0% $25 | +5% $96 | +10% $167 |
| Rate | -1.0pp $108 | -0.5pp $67 | base $25 | +0.5pp $-17 | +1.0pp $-60 |
UW: 25.0% down · 7.5% · 30yr · 1.5% tax · 5.0% vac · 8.0% maint · 8.0% mgmt
Financing live
Cash to close
- Down payment
- $41,000
- Closing costs
- $4,920
- Reserves months
- —
- Total cash needed
- —
Loan-product check · same deal, 3 products live
Conventional
25% down · 7.5% · 30yr
- Down + closing
- —
- Monthly P&I
- —
- Monthly cashflow
- —
- DSCR
- —
- Eligible?
- —
Personal DTI + credit; lowest rate.
DSCR
20% down · 8.5% · 30yr
- Down + closing
- —
- Monthly P&I
- —
- Monthly cashflow
- —
- DSCR
- —
- Eligible?
- —
No personal income docs; deal must DSCR.
Hard money
10% down · 12.0% · 12mo
- Down + closing
- —
- Monthly P&I
- —
- Monthly cashflow
- —
- DSCR
- —
- Eligible?
- —
Short-term bridge; refi at stabilization.
Rent comps 14 comps
| Address | Beds | Baths | Sqft | Rent | $/sqft | DOM | Units | Dist |
|---|---|---|---|---|---|---|---|---|
| 12827 S Morgan St Unit 1546010P Chicago, IL | 4.0 | 2.0 | 1022 | $4,677 | $4.58 | 14d | 1 | 0.54mi |
| 843 W 123rd St Unit V5 Calumet Park, IL | 2.0 | 1.0 | 900 | $1,500 | $1.67 | 14d | 1 | 0.66mi |
| 843 W 123rd St Unit T2 Calumet Park, IL | 2.0 | 1.0 | 750 | $1,400 | $1.87 | 14d | 1 | 0.66mi |
| 12358 S Lowe Ave Chicago, IL | 3.0 | 2.0 | 1050 | $2,400 | $2.29 | 26d | 1 | 0.85mi |
| 13034 Honore St Unit 1 Blue Island, IL | 2.0 | 1.0 | 700 | $1,350 | $1.93 | 14d | 1 | 0.88mi |
| 12106 S Emerald Ave Chicago, IL | 3.0 | 2.0 | 1300 | $2,550 | $1.96 | 0d | 1 | 0.91mi |
| 1908 Vermont St Unit 1916-4 Blue Island, IL | 2.0 | 1.0 | 800 | $1,395 | $1.74 | 0d | 1 | 0.95mi |
| 1923 Vermont St Blue Island, IL | 2.0 | 1.0 | 1087 | $1,550 | $1.43 | 26d | 1 | 0.97mi |
| 2130 122nd St Blue Island, IL | 2.0 | 1.0 | 558 | $1,450 | $2.60 | 0d | 1 | 1.17mi |
| 12445 S Harvard Ave Chicago, IL | 4.0 | 3.0 | 835 | $2,500 | $2.99 | 0d | 1 | 1.23mi |
| 11547 S Ashland Ave Chicago, IL | 3.0 | 1.5 | 1000 | $2,700 | $2.70 | 5d | 1 | 1.33mi |
| 2336 122nd St Unit 2 Blue Island, IL | 3.0 | 1.0 | 1340 | $1,900 | $1.42 | 22d | 1 | 1.40mi |
| 2053 135th Pl Blue Island, IL | 2.0 | 1.0 | 800 | $1,250 | $1.56 | 9d | 1 | 1.48mi |
| 2053 135th Pl Blue Island, IL | 2.0 | 1.0 | 800 | $1,250 | $1.56 | 22d | 1 | 1.48mi |
Listing history 50 events
-
2026-06-21days on market $164,000 Active 166 DOM
-
2026-06-18days on market $164,000 Active 163 DOM
-
2026-06-17days on market $164,000 Active 162 DOM
-
2026-06-16days on market $164,000 Active 161 DOM
-
2026-06-15statusdays on market $164,000 Active 160 DOM
-
2026-06-13days on market $164,000 Contingent - Continue to Show 158 DOM
-
2026-06-09days on market $164,000 Contingent - Continue to Show 154 DOM
-
2026-06-08days on market $164,000 Contingent - Continue to Show 153 DOM
-
2026-06-07days on market $164,000 Contingent - Continue to Show 152 DOM
-
2026-06-04days on market $164,000 Contingent - Continue to Show 149 DOM
-
2026-06-03days on market $164,000 Contingent - Continue to Show 148 DOM
-
2026-06-02days on market $164,000 Contingent - Continue to Show 147 DOM
-
2026-06-01days on market $164,000 Contingent - Continue to Show 146 DOM
-
2026-05-31days on market $164,000 Contingent - Continue to Show 145 DOM
-
2026-05-21status Active
-
2026-05-12historical Contingent - Continue to Show
-
2026-05-05status Active
-
2026-04-27historical Contingent - Continue to Show
-
2026-03-20price $164,000
-
2026-03-06price $164,900
-
2026-02-02historical $1,750
-
2026-01-14price $169,000
-
2026-01-07$1,750
-
2026-01-05$169,900 Active
-
2025-10-04historical
-
2025-09-15price
-
2025-09-09Active
-
2025-09-02historical
-
2025-08-27price
-
2025-08-21price
-
2025-08-19status Active
-
2025-08-17historical Contingent - No Showings
-
2025-08-12price
-
2025-07-29status Active
-
2025-06-18historical Contingent - Continue to Show
-
2025-06-03Active
-
2025-03-31historical
-
2025-02-21Active
-
2025-02-17historical
-
2024-06-26Active
-
2024-05-11historical $1,700
-
2024-05-10historical
-
2024-05-02price
-
2024-04-23$1,700
-
2024-04-18Active
-
2024-02-28historical Contingent - Continue to Show
-
2024-02-27historical
-
2024-02-19price
-
2024-01-21Active
-
2024-01-21historical
ⓘ Source: listings_history table (triggers on properties + properties_extension) + one-shot
backfill from property_details.listing_events for pre-trigger history.
Tax reassessment forecast IL · Partial reset (capped growth)
- Current annual tax
- $5,531 · $461/mo
- Projected year-2 tax
- $5,531 · $461/mo
- Expected delta
- $0/yr ($0/mo · 0.0%)
ⓘ Screening estimate from a state-policy table — verify with the county assessor before closing.
Climate risk First Street
- Flood 1/10 Low FEMA zone X (unshaded) · 0% chance over 30 yrs
- Wildfire 1/10 Low
- Heat 3/10 Moderate 7 d/yr ≥101°F today · 15 d/yr by 30 yrs out
- Wind 2/10 Low
- Air quality 4/10 Moderate 4 unhealthy d/yr today · 6 by 30 yrs out
Nearby sold comps map
Loading sold comps map…
Walkable amenities ~0.75 mi
Loading nearby amenities…
Taxation est. · year 1
- Rental income
- $21,489
- − Mortgage interest
- −$9,187
- − Property taxes
- −$5,531
- − Insurance
- −$820
- − Repairs & maintenance
- −$1,719
- − Management
- −$1,719
- − Depreciation
- −$4,771
- Taxable loss
- −$2,257
- Est. tax savings @ 24.0%
- +$542
- After-tax cash flow
- $847/yr
For passive investors: Depreciation is non-cash, so a rental often shows a tax loss while cash-flowing — sheltering income. Rental losses are passive: they offset passive income freely, and up to $25,000/yr can offset ordinary (W-2) income if you actively participate and your MAGI is under $100k (phasing out to $0 by $150k); unused losses carry forward. On sale, claimed depreciation is recaptured at up to 25%, and gains may owe capital-gains tax (a 1031 exchange can defer both). Figures are a year-1 estimate at your 24.0% rate — not tax advice; consult a CPA.
Schools (NCES district)
- District
- Chsd 218
- NCES district ID
- 1706540
- Math proficiency
- 14% ▼ -4.00%
- Reading proficiency
- 20% ▼ -1.00%
- Median HH income
- $57,166
- Composite
- 16.09/100
- National rank
- #9235
- State rank
- #454 of 620 in IL
Livability — Calumet Park
- Score
- 72/100
- State rank
- #308
- US rank
- #6048
Category grades
Schools grade is shown separately in the Schools card above.
Census & demographics
- Census place
- Calumet Park, IL
- County
- Cook County · 4,486,803 people
- Metro
- Chicago-Naperville-Elgin, IL-IN-WI
- Population (ZIP)
- 24,713
- Household income
- $37,217
- Rent vs Own
- Severe rent burden
- 1868.0
Population outlook (Cook County) Hauer SSP2
- Today (2025)
- 5,347,519 people
- By 2030
- 5,357,703 · +0.2%
- By 2040
- 5,324,924 · -0.4%
- By 2050
- 5,230,762 · -2.2%
- By 2075
- 4,785,735 · -10.5%
- By 2100
- 4,188,836 · -21.7%
Race, ethnicity, and origin ACS 2023
- Neighborhood character
- Predominantly Black (88%)
- Race & ethnicity
- Black 88% Two or more races 5% Hispanic / Latino 5% White 2%
- Common ancestry
- Iranian 1%
- Foreign-born
- 2% · Canada
- Languages at home
- 96% English-only · Spanish 3%
Political lean MEDSL · Cook
- 2024 margin
- Solid D (+42.0) · D 70.4% · R 28.4% · Other 1.2%
- 2008→2024 swing
- -11.4pp toward R · 2008: 53.4pp · 2024: 42.0pp
- All cycles
- 2024: D+42.0 2020: D+50.3 2016: D+53.0 2012: D+49.4 2008: D+53.4
Not yet ingested
- Civics
- —
Market trends
- HPI YoY
- ▼ -76.39%
- Current HPI
- 163.7725
- Rent YoY
- ▲ 7.82%
- Metro
- Chicago-Naperville-Elgin, IL-IN-WI
- State GDP YoY
- ▲ 1.59%
- F500 in state
- 60
Industry mix (Fortune 500 HQ in IL)
| Industry | F500 HQs | Revenue |
|---|---|---|
| Insurance | 4 | $201B |
|
||
| Consumer Goods | 4 | $87B |
|
||
| Industrial Machinery | 3 | $64B |
|
||
| Healthcare | 2 | $55B |
|
||
| Retail / Pharmacy | 1 | $148B |
|
||
| Agriculture / Food | 1 | $86B |
|
||
Price history
+215.4% since first listed42 events — show timeline
- 2026-05-21 Relisted — MRED as Distributed by MLS Grid
- 2026-05-12 Contingent — MRED as Distributed by MLS Grid
- 2026-05-05 Relisted — MRED as Distributed by MLS Grid
- 2026-04-27 Contingent — MRED as Distributed by MLS Grid
- 2026-03-20 Price Changed $164,000 MRED as Distributed by MLS Grid
- 2026-03-06 Price Changed $164,900 MRED as Distributed by MLS Grid
- 2026-02-02 Rental Removed $1,750 MRED
- 2026-01-14 Price Changed $169,000 MRED as Distributed by MLS Grid
- 2026-01-07 Listed for Rent $1,750 MRED
- 2026-01-05 Listed $169,900 MRED as Distributed by MLS Grid
- 2025-10-04 Listing Removed — MRED as Distributed by MLS Grid
- 2025-09-15 Price Changed — MRED as Distributed by MLS Grid
- 2025-09-09 Listed — MRED as Distributed by MLS Grid
- 2025-09-02 Listing Removed — MRED as Distributed by MLS Grid
- 2025-08-27 Price Changed — MRED as Distributed by MLS Grid
- 2025-08-21 Price Changed — MRED as Distributed by MLS Grid
- 2025-08-19 Relisted — MRED as Distributed by MLS Grid
- 2025-08-17 Contingent — MRED as Distributed by MLS Grid
- 2025-08-12 Price Changed — MRED as Distributed by MLS Grid
- 2025-07-29 Relisted — MRED as Distributed by MLS Grid
- 2025-06-18 Contingent — MRED as Distributed by MLS Grid
- 2025-06-03 Listed — MRED as Distributed by MLS Grid
- 2025-03-31 Listing Removed — MRED as Distributed by MLS Grid
- 2025-02-21 Listed — MRED as Distributed by MLS Grid
- 2025-02-17 Listing Removed — MRED as Distributed by MLS Grid
- 2024-06-26 Listed — MRED as Distributed by MLS Grid
- 2024-05-11 Rental Removed $1,700 MRED
- 2024-05-10 Listing Removed — MRED as Distributed by MLS Grid
- 2024-05-02 Price Changed — MRED as Distributed by MLS Grid
- 2024-04-23 Listed for Rent $1,700 MRED
- 2024-04-18 Listed — MRED as Distributed by MLS Grid
- 2024-02-28 Contingent — MRED as Distributed by MLS Grid
- 2024-02-27 Listing Removed — MRED as Distributed by MLS Grid
- 2024-02-19 Price Changed — MRED as Distributed by MLS Grid
- 2024-01-21 Listing Removed — MRED as Distributed by MLS Grid
- 2024-01-21 Listed — MRED as Distributed by MLS Grid
- 2022-10-06 Sold (Public Records) $70,500 Public Records
- 2022-09-29 Contingent — MRED as Distributed by MLS Grid
- 2022-09-29 Listing Removed — MRED as Distributed by MLS Grid
- 2022-09-28 Listed — MRED as Distributed by MLS Grid
- 2022-01-22 Listed — MRED as Distributed by MLS Grid
- 1988-06-17 Sold (Public Records) $52,000 Public Records
Property tax history
+5.6%/yrLatest (2023): $5,531 · +59.2% YoY. Source: county tax records.
Cash-flow waterfall
monthlySold comps — $/sqft
last 12 mo · ≤1 miLoading sold comps…