1213 Oak Lane Cir W · Mobile, AL
Flood risk 1/10 · Minimal
- FEMA flood zone
- X (unshaded)
- Chance of flooding over 30 yrs
- 0.0%
- Est. flood insurance / yr
- $507 – $1,088
Fire risk 3/10 · Minor
- Est. fire insurance / yr
- $916 – $1,700
Heat risk 9/10 · Severe
- Hot days now (above 104°F)
- 7 days/yr
- Hot days in 30 yrs
- 19 days/yr
Wind risk 9/10 · Severe
- Chance of severe wind over 30 yrs
- 99.0%
Air-quality risk 2/10 · Minimal
- Unhealthy air days now
- 1 days/yr
- Unhealthy air days in 30 yrs
- 1 days/yr
Risk factors via First Street. Map © Google.
Why this score? — see what drove the B grade
The composite is a weighted blend of 9 inputs, each scored 0–100. Each bar is that input's sub-score; the figure is the points it added to the 100-point composite (weight × sub-score).
- Cash flow +29.1/30.0
- ARV discount +15.0/15.0
- DSCR +10.0/10.0
- 1% rule +7.3/10.0
- Livability +3.8/5.0
- Rent growth +2.5/5.0
- Condition / age +2.5/5.0
- Schools +2.3/10.0
- Appreciation +0.0/10.0
$110,000
🖨 Deal sheet 📄 Offer letter ✓ Due diligence
Listing remarks
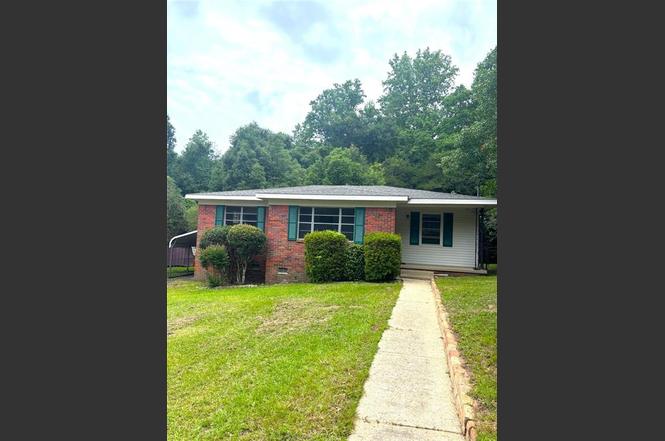
This adorable cottage style 2 bedroom, 1 bath home off Moffett Road is the perfect place for any investor or first-time home buyer. Property features living room, dining room, spacious eat-in kitchen, with utility off the kitchen. Ideal for back yard gatherings with a large covered back deck and huge yard for entertaining. This property is a must see and will not last long! Priced to sell!
Key facts
- Huge yard
- Living room
- Cottage style
Tags
Property features AI
Finance
- Other: Located in the Oak Lane subdivision; Address: 1213 Oak Lane Cir W, Mobile AL 36618
Exterior
- Parking: Detached carport; 2 carport spaces
- Utilities: Electricity available (110V and 220V); Natural gas available; Water available; Public sewer
- Home design: Single family residence; Residential property
- Construction: Brick on three sides; Shingle roof; Block and pillar/post/pier foundation
- Exterior features: Private yard; Back yard fencing; No pool; No spa; View
Interior
- Kitchen: Dishwasher; Gas range; Stained cabinets; Laminate countertops
- Bedrooms: 2 bedrooms
- Flooring: Hardwood floors
- Bathrooms: 1 full bathroom
- Heating & cooling: Central heating; Central air conditioning
- Interior features: Other; Separate dining room; No basement
Neighborhood map
What this means for you Summary
Snapshot
- This is a 2-bed/1.0-bath single-family listed at $110k.
Deal economics
- At list price, monthly cash flow is $379 ($5k/yr) — positive.
- The deal already cash-flows at list — no discount required.
- Meets the 1% rule at list price ($1k rent vs $110k).
- Cap rate 10.4% vs local median 4.9% in Mobile — top-decile yield for the area; either an underpriced asset or a hidden risk that comps aren't pricing in. Stress-test before assuming the spread holds.
Location & tenants
- Location reads 75/100 on livability (#20 in AL, #4,262 nationally) — a middle-class / working-renter tenant base. Strengths: commute A+, cost of living A+, housing A+; Watch: crime F, employment D-.
- Mobile County (urban): math 15% / reading 39% proficiency, ranked #81 of 129 in AL (top 63%) — low school quality limits family demand, transient renter base, plan for 1-2y turnover; 67% free/reduced lunch — lower-income household profile, screen leases tightly.
- Zoned schools: Forest Hill Elementary School (math 4% / reading 23%, grade F, #531 of 627 statewide, top 85%, 549 students, 93% FRL); Mattie T Blount High School (math 2% / reading 3%, grade F, #291 of 305 statewide, top 100%, 1,176 students, 86% FRL) — zoned schools average 90% FRL vs 67% district-wide (22 pts higher); higher-poverty schools than district average — tighter screening recommended.
- Zoned-school proficiency averages 8% at this address vs 27% district-wide (-19 pts) — the specific schools serving this property underperform the Mobile County average; the district grade overstates school quality for this exact location.
- Market conditions: 99 active listings in the ZIP; 11 comparable units currently listed for rent nearby; rentals lingering (median 44d on market — plan ~5-8 weeks vacancy on turnover, expect pricing pressure); 55% of comp listings sitting > 30 days — soft ceiling on asking rent; 1,678 units permitted in Mobile County in 2024 (264 in 5+ unit buildings).
Forward outlook
- Local home prices are declining (-3.0%/yr); year-one equity from $761 of loan paydown is wiped out by about $3k of value loss. Plan a longer hold.
- Mobile County population projected to shrink 8% by 2050 — rents likely to lag national; underwrite the cash flow, not the appreciation.
- At projected returns (-3.0% appreciation + 3.0% rent growth), your $31k cash investment doubles in ~8 years — after that, you're playing with house money.
Negotiation context
- Only 3 days on market — expect competitive offers; lowballing is unlikely to land.
Risks & watch-outs
- Climate carrying-cost: severe wind risk, 99% chance of damaging wind over 30y; extreme-heat days projected 7→19/yr by 2055 (HVAC capex compounding) — expect insurance premiums to compound above CPI over the hold.
Questions for the listing agent
- Is there a deadline driving the sale (1031 exchange, divorce, estate, relocation)? That informs how much negotiation room exists.
- Schools are D-rated, which usually means shorter tenancies and higher turnover. Who's the typical renter profile here, and what's been the actual vacancy rate?
- Crime grade is F in this area — have there been break-ins, vandalism, or insurance claims at this property in the last 3 years? What carrier currently insures it and at what premium?
- What's the average days-on-market for RENTAL listings here right now (not sales)? A rising rental-DOM trend means longer vacancies and softer asking-rent achievability than the comps imply.
- What's the recent tenant-quality profile in this submarket — average credit score on applications, eviction rate, late-payment / NSF rate, and stable-employment percentage? A property-management company in the area should have these aggregated.
- How much new for-sale + rental construction is in the pipeline within 1–3 miles? Heavy new supply typically softens prices + rents 12–24 months out; constrained supply supports both.
Investment metrics
- 1% rule
- 1.23% ✓
- Cap rate
- 10.42%
- Cash-on-cash
- 14.75%
- DSCR
- 1.66
- GRM
- 6.8
CMA / ARV
- ARV (on-the-fly)
- $212,382
- Comps found
- 12
Show comp detail 12 sales within ~0.75 mi
| Address | Dist | Beds/Ba | Sqft | Sold | Price | $/sf | Match |
|---|---|---|---|---|---|---|---|
| 1200 Oak Lane Dr | 0.10mi | 3/1.0 (+1) | 1,227 (-6%) | 11mo | $121,000 | $99 | 70 |
| 1557 Phillips Ln | 0.70mi | 3/2.0 (+1) | 1,322 (+1%) | 3mo | $210,000 | $159 | 54 |
| 1561 Phillips Ln | 0.70mi | 3/2.0 (+1) | 1,253 (-4%) | 1mo | $210,000 | $168 | 50 |
| 1215 Stevens Ln | 0.47mi | 3/1.0 (+1) | 1,118 (-15%) | 2mo | $70,000 | $63 | 47 |
| 1553 Phillips Ln | 0.62mi | 3/2.0 (+1) | 1,203 (-8%) | 3mo | $213,500 | $177 | 46 |
| 4305 Benson Dr | 0.34mi | 3/2.0 (+1) | 1,455 (+11%) | 14mo | $175,000 | $120 | 45 |
| 1611 Sharon Dr | 0.70mi | 3/2.0 (+1) | 1,264 (-4%) | 12mo | $205,000 | $162 | 42 |
| 1565 Phillips Ln | 0.70mi | 3/2.0 (+1) | 1,249 (-5%) | 10mo | $210,000 | $168 | 42 |
| 1133 Forest Glen Dr | 0.66mi | 3/2.0 (+1) | 1,468 (+12%) | 1mo | $235,500 | $160 | 39 |
| 4620 St Charles Ct | 0.74mi | 3/2.0 (+1) | 1,414 (+8%) | 11mo | $198,000 | $140 | 35 |
| 1125 Forest Glen Dr S | 0.68mi | 3/2.0 (+1) | 1,468 (+12%) | 10mo | $240,500 | $164 | 31 |
| 1178 Forest Glen Dr S | 0.69mi | 3/2.0 (+1) | 1,453 (+11%) | 12mo | $251,500 | $173 | 31 |
Match score weights: distance 35% · size 25% · config 20% · recency 20%. Top-matched comps best support the ARV.
Projected returns pro-forma
-3.0% appreciation · 3.0% rent growth · sell at horizon
- IRR
- 5.2%
- Equity multiple
- 1.20×
- Total profit
- $6,260
- Equity at exit
- $16,401
- IRR
- 14.7%
- Equity multiple
- 2.18×
- Total profit
- $36,395
- Equity at exit
- $9,511
Cash invested: $30,800 (down + closing). Projections, not guarantees.
Landlord ↔ Tenant lean methodology
- Overall (STATE)
- 90 Strongly Landlord-Friendly
- State Alabama
- 90 Strongly Landlord-Friendly · R+15
- County
- — inherits STATE
- City
- — inherits STATE
ZIP-level market 36618
- Home prices YoY
- -22.8%
- Active inventory
- 99
- Price-to-rent
- 6.8×
Monthly cashflow live
- Estimated rent
- $1,348 high interval (Pro) →
- Mortgage (P&I)
- −$577
- Tax from tax record
- −$64 /mo · $762/yr
- Insurance
- −$46
- HOA
- −$0
- Vacancy / Maint / Mgmt
- −$283
- Net cashflow
- $379
Break-even live
UW: 25.0% down · 7.5% · 30yr · 1.5% tax · 5.0% vac · 8.0% maint · 8.0% mgmt
Financing live
Cash to close
- Down payment
- $27,500
- Closing costs
- $3,300
- Reserves months
- —
- Total cash needed
- —
Loan-product check · same deal, 3 products live
Conventional
25% down · 7.5% · 30yr
- Down + closing
- —
- Monthly P&I
- —
- Monthly cashflow
- —
- DSCR
- —
- Eligible?
- —
Personal DTI + credit; lowest rate.
DSCR
20% down · 8.5% · 30yr
- Down + closing
- —
- Monthly P&I
- —
- Monthly cashflow
- —
- DSCR
- —
- Eligible?
- —
No personal income docs; deal must DSCR.
Hard money
10% down · 12.0% · 12mo
- Down + closing
- —
- Monthly P&I
- —
- Monthly cashflow
- —
- DSCR
- —
- Eligible?
- —
Short-term bridge; refi at stabilization.
Rent comps 11 comps
| Address | Beds | Baths | Sqft | Rent | $/sqft | DOM | Units | Dist |
|---|---|---|---|---|---|---|---|---|
| 1404 Stevens Ln Mobile, AL | 3.0 | 1.0 | 1052 | $1,275 | $1.21 | 43d | 1 | 0.53mi |
| 3764 Autumndale Dr Mobile, AL | 3.0 | 1.0 | 1050 | $1,350 | $1.29 | 13d | 1 | 0.60mi |
| 1063 Midmoor Dr Mobile, AL | 2.0 | 2.0 | 1695 | $1,450 | $0.86 | 43d | 1 | 0.72mi |
| 4410 The Cedars Ave Mobile, AL | 2.0 | 1.0 | 1232 | $1,500 | $1.22 | 43d | 1 | 1.07mi |
| 4410 The Cedars Ave Mobile, AL | 2.0 | 1.0 | 1232 | $1,500 | $1.22 | 13d | 1 | 1.07mi |
| 4355 Stein Ave Unit C Mobile, AL | 2.0 | 1.5 | 1200 | $1,500 | $1.25 | 21d | 1 | 1.11mi |
| 3655 Old Shell Rd Unit 3655 Mobile, AL | 2.0 | 2.0 | 1200 | $1,850 | $1.54 | 13d | 1 | 1.27mi |
| 2207 Wolf Ridge Rd Unit B Mobile, AL | 2.0 | 1.0 | 1000 | $1,100 | $1.10 | 43d | 1 | 1.41mi |
| 1104 Garland St Mobile, AL | 3.0 | 1.0 | 1377 | $1,450 | $1.05 | 21d | 1 | 1.43mi |
| 2209 Wolf Ridge Rd Unit B Mobile, AL | 3.0 | 1.5 | 1175 | $1,200 | $1.02 | 43d | 1 | 1.44mi |
| 2211 Wolf Ridge Rd Unit B Mobile, AL | 3.0 | 1.5 | 1050 | $1,200 | $1.14 | 43d | 1 | 1.46mi |
Listing history 3 events
-
2026-06-14statusdays on market $110,000 Pending 3 DOM
-
2026-06-13remarks 392-char remark
-
2026-06-13$110,000 Active 2 DOM
ⓘ Source: listings_history table (triggers on properties + properties_extension) + one-shot
backfill from property_details.listing_events for pre-trigger history.
Tax reassessment forecast AL · Resets to sale price
- Current annual tax
- $762 · $64/mo
- Projected year-2 tax
- $762 · $64/mo
- Expected delta
- $0/yr ($0/mo · 0.0%)
ⓘ Screening estimate from a state-policy table — verify with the county assessor before closing.
Climate risk First Street
- Flood 1/10 Low FEMA zone X (unshaded) · 0% chance over 30 yrs
- Wildfire 3/10 Moderate
- Heat 9/10 Extreme 7 d/yr ≥104°F today · 19 d/yr by 30 yrs out
- Wind 9/10 Extreme 99% chance of damaging wind over 30 yrs
- Air quality 2/10 Low 1 unhealthy d/yr today · 1 by 30 yrs out
Nearby sold comps map
Loading sold comps map…
Walkable amenities ~0.75 mi
Loading nearby amenities…
Taxation est. · year 1
- Rental income
- $16,173
- − Mortgage interest
- −$6,162
- − Property taxes
- −$762
- − Insurance
- −$550
- − Repairs & maintenance
- −$1,294
- − Management
- −$1,294
- − Depreciation
- −$3,200
- Taxable income
- $2,912
- Est. tax owed @ 24.0%
- −$699
- After-tax cash flow
- $3,844/yr
For passive investors: Depreciation is non-cash, so a rental often shows a tax loss while cash-flowing — sheltering income. Rental losses are passive: they offset passive income freely, and up to $25,000/yr can offset ordinary (W-2) income if you actively participate and your MAGI is under $100k (phasing out to $0 by $150k); unused losses carry forward. On sale, claimed depreciation is recaptured at up to 25%, and gains may owe capital-gains tax (a 1031 exchange can defer both). Figures are a year-1 estimate at your 24.0% rate — not tax advice; consult a CPA.
Schools (NCES district)
- District
- Mobile County
- NCES district ID
- 0102370
- Math proficiency
- 15% ▼ -28.00%
- Reading proficiency
- 39% ▬ 0.00%
- Median HH income
- $42,455
- Composite
- 22.9/100
- National rank
- #8002
- State rank
- #81 of 129 in AL
Livability — Mobile
- Score
- 75/100
- State rank
- #20
- US rank
- #4262
Category grades
Schools grade is shown separately in the Schools card above.
Census & demographics
- Census place
- Mobile, AL
- County
- Mobile County · 246,577 people
- City population
- 205,729
- Metro
- Mobile, AL
- Population (ZIP)
- 17,892
- Household income
- $61,550
- Rent vs Own
- Severe rent burden
- 542.0
Population outlook (Mobile County) Hauer SSP2
- Today (2025)
- 415,303 people
- By 2030
- 411,755 · -0.9%
- By 2040
- 399,670 · -3.8%
- By 2050
- 382,616 · -7.9%
- By 2075
- 337,353 · -18.8%
- By 2100
- 283,391 · -31.8%
Race, ethnicity, and origin ACS 2023
- Neighborhood character
- Predominantly Black (65%)
- Race & ethnicity
- Black 65% White 27% Two or more races 3% Asian 3% Hispanic / Latino 2%
- Common ancestry
- Slovak 1% Serbian 1% Romanian 0%
- Foreign-born
- 4% · Canada, China
- Languages at home
- 94% English-only · Spanish 3% Chinese 2%
Political lean MEDSL · Mobile
- 2024 margin
- R (+16.4) · D 41.3% · R 57.7%
- 2008→2024 swing
- -7.7pp toward R · 2008: -8.7pp · 2024: -16.4pp
- All cycles
- 2024: R+16.4 2020: R+11.9 2016: R+13.9 2012: R+9.3 2008: R+8.7
Not yet ingested
- Civics
- —
Market trends
- HPI YoY
- ▼ -64.54%
- Current HPI
- 218.7133
- Rent YoY
- —
- Metro
- Mobile, AL
- State GDP YoY
- ▲ 2.94%
- F500 in state
- 4
Industry mix (Fortune 500 HQ in AL)
| Industry | F500 HQs | Revenue |
|---|---|---|
| Financial Services | 1 | $8B |
|
||
| Healthcare | 1 | $5B |
|
||
Price history
1 event — show timeline
- 2026-06-10 Listed $110,000 GCMLS AL
Property tax history
+1.6%/yrLatest (2025): $762 · +6.0% YoY. Source: county tax records.
Cash-flow waterfall
monthlySold comps — $/sqft
last 12 mo · ≤1 miLoading sold comps…