11821 Central St · Riverview, VA
Flood risk 8/10 · Major
- FEMA flood zone
- X (shaded)
- Chance of flooding over 30 yrs
- 0.99%
- Est. flood insurance / yr
- $507 – $1,088
Fire risk 3/10 · Minor
- Est. fire insurance / yr
- $666 – $1,236
Heat risk 3/10 · Minor
- Hot days now (above 92°F)
- 7 days/yr
- Hot days in 30 yrs
- 22 days/yr
Wind risk 2/10 · Minimal
- Chance of severe wind over 30 yrs
- —
Air-quality risk 1/10 · Minimal
- Unhealthy air days now
- 0 days/yr
- Unhealthy air days in 30 yrs
- 0 days/yr
Risk factors via First Street. Map © Google.
Why this score? — see what drove the D+ grade
The composite is a weighted blend of 9 inputs, each scored 0–100. Each bar is that input's sub-score; the figure is the points it added to the 100-point composite (weight × sub-score).
- Cash flow +15.2/30.0
- ARV discount +7.5/15.0
- Schools +6.3/10.0
- Appreciation +5.0/10.0
- DSCR +4.6/10.0
- 1% rule +2.9/10.0
- Livability +2.8/5.0
- Rent growth +2.5/5.0
- Condition / age +2.5/5.0
$165,000
🖨 Deal sheet 📄 Offer letter ✓ Due diligence
Listing remarks MLS
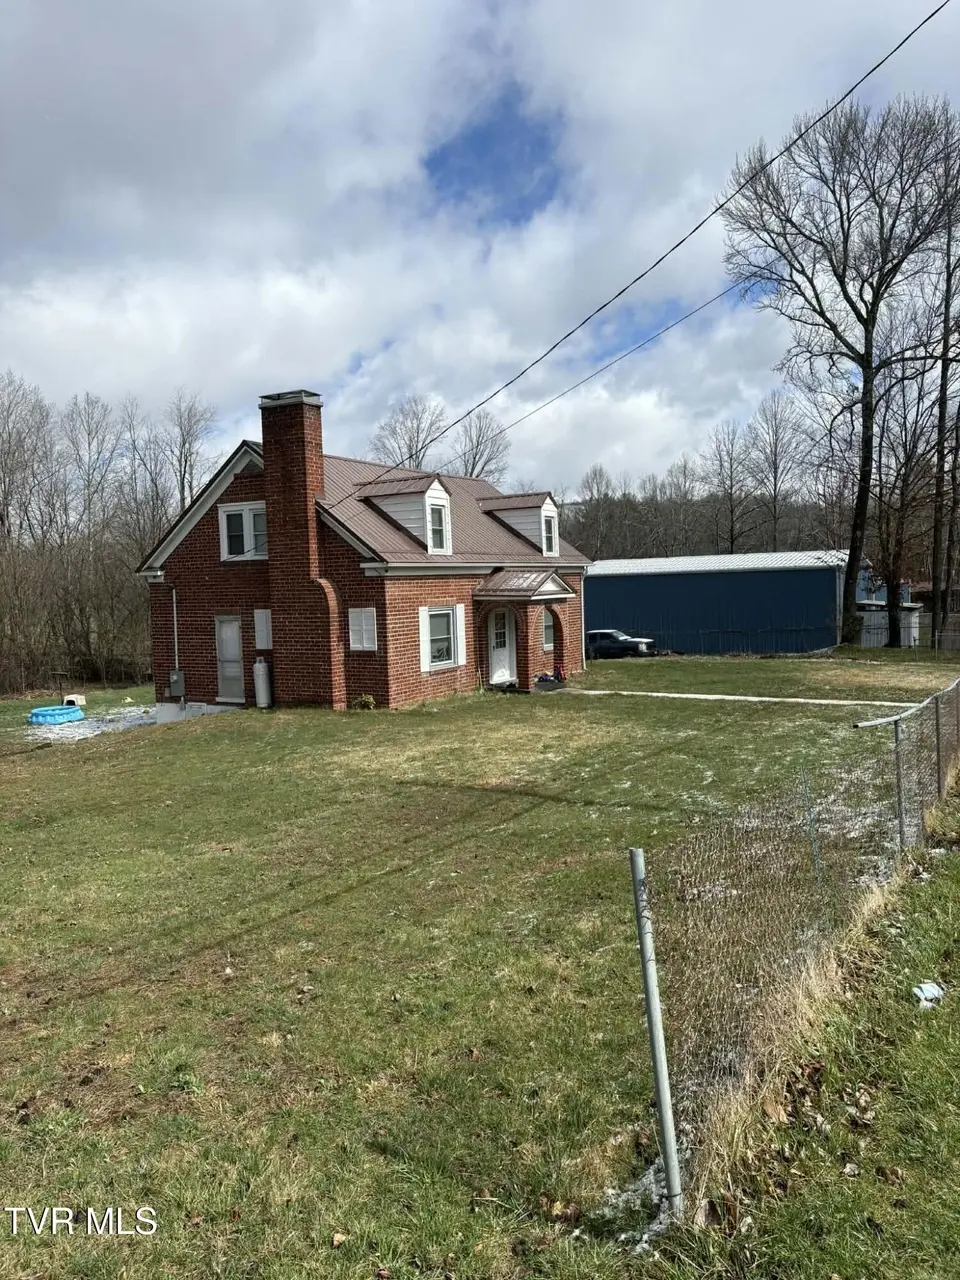
This lovely brick home is on the market. Seller's love it but need to move. It has been updated with all new paint, and repairs. It would make a lovely home for a first time buyer or an investor looking for a rental property. It has master bed and bath on first level and the other 2 bedrooms are upstairs along with the second bathroom. It is close to the schools and shopping and has a little over half an acre of nice flat yard space. Definite must see!!
Key facts
- Brick home
- Garage
- Built 1946
Tags
Neighborhood map
What this means for you Summary
Snapshot
- This is a 3-bed/1.5-bath single-family listed at $165k.
Deal economics
- At list price, monthly cash flow is $-10 ($-123/yr) — negative.
- To cash-flow at today's rent, offer at most $163k (1.1% below list).
- To meet the 1% rule (rent ≥ 1% of price), the offer needs to be $130k (21.2% below list).
- Recommended offer: $130k (21.2% below list) — sets the bar for 1% rule.
Location & tenants
- Location reads 55/100 on livability (#516 in VA) — a working-class tenant base; expect higher turnover. Strengths: cost of living A+, housing A; Watch: crime D+, schools F, amenities F.
- Wise County Public School District (town): math 74% / reading 79% proficiency, ranked #11 of 131 in VA (top 8%) — strong family-tenant draw, lease renewals of 3-5y typical.
- Market conditions: 46 active listings in the ZIP; 1 comparable units currently listed for rent nearby; 17 units permitted in Wise County in 2024 (0 in 5+ unit buildings).
Forward outlook
- In year one you build about $1k of equity ($1k loan paydown + $112 appreciation (0.1% local appreciation)).
- Wise County population projected at -26% by 2050 — secular population decline; favor cash flow + early exit over multi-decade hold.
Negotiation context
- It's been on market 86 days — a 6% lower offer ($155k) is reasonable based on typical stale-listing flexibility.
Risks & watch-outs
- Watch-outs: flood insurance adds $66/mo; built in 1946 — expect roof / HVAC / electrical / plumbing capex.
- Climate carrying-cost: severe flood risk — expect insurance premiums to compound above CPI over the hold.
Questions for the listing agent
- What do current leases actually rent for vs. the listed asking? Can we see a recent rent roll and the last 12 months of T-12 income?
- It's been on market 86 days. Have you received any prior offers? Is the seller open to a 21% concession, seller financing, or rate buy-down credit?
- Built in 1946 — when were the roof, HVAC, electrical panel, plumbing, and water heater last replaced?
- What's the actual annual flood-insurance premium (NFIP or private), and is the property in a SFHA with mandatory coverage?
- Why hasn't it sold? Are there any deal-killer items the seller is aware of (foundation, flood, title, zoning, code violations)?
- Is there a deadline driving the sale (1031 exchange, divorce, estate, relocation)? That informs how much negotiation room exists.
- Schools are F-rated, which usually means shorter tenancies and higher turnover. Who's the typical renter profile here, and what's been the actual vacancy rate?
- Crime grade is D in this area — have there been break-ins, vandalism, or insurance claims at this property in the last 3 years? What carrier currently insures it and at what premium?
- The area grade is low — what's the realistic commute time and amenity access for the typical tenant pool here? Any planned neighborhood developments (good or bad) we should know about?
- What's the average days-on-market for RENTAL listings here right now (not sales)? A rising rental-DOM trend means longer vacancies and softer asking-rent achievability than the comps imply.
- What's the recent tenant-quality profile in this submarket — average credit score on applications, eviction rate, late-payment / NSF rate, and stable-employment percentage? A property-management company in the area should have these aggregated.
- How much new for-sale + rental construction is in the pipeline within 1–3 miles? Heavy new supply typically softens prices + rents 12–24 months out; constrained supply supports both.
Investment metrics
- 1% rule
- 0.79% ✗
- Cap rate
- 6.70%
- Cash-on-cash
- 1.46%
- DSCR
- 1.06
- GRM
- 10.6
CMA / ARV
- ARV (median comp)
- $55,341
- List price
- $165,000
- Delta
- 198.15%
- Verdict
- OVERPRICED
- Comps
- 11 within 1.0 mi
Show comp detail 10 sales within ~0.75 mi
| Address | Dist | Beds/Ba | Sqft | Sold | Price | $/sf | Match |
|---|---|---|---|---|---|---|---|
| 11811 Central St | 0.05mi | 3/1.0 | 1,580 (+7%) | 9mo | $129,000 | $82 | 77 |
| 209 Central Street St | 0.20mi | 3/2.0 | 1,400 (-5%) | 10mo | $227,500 | $163 | 72 |
| 304 7th St | 0.52mi | 3/2.0 | 1,440 (-3%) | 23mo | $129,500 | $90 | 50 |
| 11417 Bedford Rd Rd | 0.75mi | 3/2.0 | 1,450 (-2%) | 13mo | $145,000 | $100 | 49 |
| 610 Kiser Ave | 0.66mi | 3/2.0 | 1,456 (-2%) | 22mo | $165,000 | $113 | 46 |
| 205 Trent St | 0.50mi | 3/2.0 | 1,558 (+5%) | 24mo | $192,000 | $123 | 46 |
| 621 King Ave Ave SE | 0.55mi | 3/2.0 | 1,395 (-6%) | 22mo | $220,000 | $158 | 45 |
| 126 Tate Ave | 0.74mi | 3/1.0 | 1,416 (-4%) | 17mo | $9,000 | $6 | 42 |
| 513 Central St | 0.74mi | 3/2.0 | 1,620 (+10%) | 10mo | $162,000 | $100 | 39 |
| 201 Ball Rd | 0.67mi | 2/1.5 (-1) | 1,581 (+7%) | 23mo | $115,000 | $73 | 33 |
Match score weights: distance 35% · size 25% · config 20% · recency 20%. Top-matched comps best support the ARV.
Projected returns pro-forma
0.07% appreciation · 3.0% rent growth · sell at horizon
- IRR
- -2.3%
- Equity multiple
- 0.89×
- Total profit
- $-4,997
- Equity at exit
- $48,474
- IRR
- 3.4%
- Equity multiple
- 1.37×
- Total profit
- $16,873
- Equity at exit
- $58,718
Cash invested: $46,200 (down + closing). Projections, not guarantees.
Landlord ↔ Tenant lean methodology
- Overall (STATE)
- 55 Moderately Landlord-Leaning
- State Virginia
- 55 Moderately Landlord-Leaning · D+2
- County
- — inherits STATE
- City
- — inherits STATE
ZIP-level market 24230
- Home prices YoY
- 0.1%
- Active inventory
- 46
- Price-to-rent
- 10.6×
Monthly cashflow live
- Estimated rent
- $1,300 medium interval (Pro) →
- Mortgage (P&I)
- −$865
- Tax from tax record
- −$37 /mo · $442/yr
- Insurance
- −$69
- Flood insurance flood zone
- −$66 /mo · $798/yr
- HOA
- −$0
- Vacancy / Maint / Mgmt
- −$273
- Net cashflow
- $-10
Break-even live
UW: 25.0% down · 7.5% · 30yr · 1.5% tax · 5.0% vac · 8.0% maint · 8.0% mgmt
Financing live
Cash to close
- Down payment
- $41,250
- Closing costs
- $4,950
- Reserves months
- —
- Total cash needed
- —
Loan-product check · same deal, 3 products live
Conventional
25% down · 7.5% · 30yr
- Down + closing
- —
- Monthly P&I
- —
- Monthly cashflow
- —
- DSCR
- —
- Eligible?
- —
Personal DTI + credit; lowest rate.
DSCR
20% down · 8.5% · 30yr
- Down + closing
- —
- Monthly P&I
- —
- Monthly cashflow
- —
- DSCR
- —
- Eligible?
- —
No personal income docs; deal must DSCR.
Hard money
10% down · 12.0% · 12mo
- Down + closing
- —
- Monthly P&I
- —
- Monthly cashflow
- —
- DSCR
- —
- Eligible?
- —
Short-term bridge; refi at stabilization.
Rent comps 1 comps
| Address | Beds | Baths | Sqft | Rent | $/sqft | DOM | Units | Dist |
|---|---|---|---|---|---|---|---|---|
| 208 Prospect Ave NW Coeburn, VA | 3.0 | 1.0 | 1400 | $1,300 | $0.93 | 44d | 1 | 0.50mi |
Listing history 16 events
-
2026-06-18days on market $165,000 Active 86 DOM
-
2026-06-17days on market $165,000 Active 85 DOM
-
2026-06-16days on market $165,000 Active 84 DOM
-
2026-06-15days on market $165,000 Active 83 DOM
-
2026-06-15days on market $165,000 Active 82 DOM
-
2026-06-13days on market $165,000 Active 81 DOM
-
2026-06-12days on market $165,000 Active 80 DOM
-
2026-06-09days on market $165,000 Active 77 DOM
-
2026-06-08days on market $165,000 Active 76 DOM
-
2026-06-08days on market $165,000 Active 75 DOM
-
2026-06-07days on market $165,000 Active 74 DOM
-
2026-06-03days on market $165,000 Active 71 DOM
-
2026-06-02days on market $165,000 Active 70 DOM
-
2026-06-01days on market $165,000 Active 69 DOM
-
2026-05-31days on market $165,000 Active 68 DOM
-
2026-03-24$165,000 Active 457-char remark
Show marketing remark (457 chars)
This lovely brick home is on the market. Seller's love it but need to move. It has been updated with all new paint, and repairs. It would make a lovely home for a first time buyer or an investor looking for a rental property. It has master bed and bath on first level and the other 2 bedrooms are upstairs along with the second bathroom. It is close to the schools and shopping and has a little over half an acre of nice flat yard space. Definite must see!!
ⓘ Source: listings_history table (triggers on properties + properties_extension) + one-shot
backfill from property_details.listing_events for pre-trigger history.
Tax reassessment forecast VA · Resets to sale price
- Current annual tax
- $442 · $37/mo
- Projected year-2 tax
- $1,353 · $113/mo
- Expected delta
- +$911/yr (+$76/mo · 206.4%)
ⓘ Screening estimate from a state-policy table — verify with the county assessor before closing.
Climate risk First Street
- Flood 8/10 Severe FEMA zone X (shaded) · 99% chance over 30 yrs
- Wildfire 3/10 Moderate
- Heat 3/10 Moderate 7 d/yr ≥92°F today · 22 d/yr by 30 yrs out
- Wind 2/10 Low
- Air quality 1/10 Low 0 unhealthy d/yr today · 0 by 30 yrs out
Nearby sold comps map
Loading sold comps map…
Walkable amenities ~0.75 mi
Loading nearby amenities…
Taxation est. · year 1
- Rental income
- $15,600
- − Mortgage interest
- −$9,243
- − Property taxes
- −$442
- − Insurance
- −$1,622
- − Repairs & maintenance
- −$1,248
- − Management
- −$1,248
- − Depreciation
- −$4,800
- Taxable loss
- −$3,003
- Est. tax savings @ 24.0%
- +$721
- After-tax cash flow
- $597/yr
For passive investors: Depreciation is non-cash, so a rental often shows a tax loss while cash-flowing — sheltering income. Rental losses are passive: they offset passive income freely, and up to $25,000/yr can offset ordinary (W-2) income if you actively participate and your MAGI is under $100k (phasing out to $0 by $150k); unused losses carry forward. On sale, claimed depreciation is recaptured at up to 25%, and gains may owe capital-gains tax (a 1031 exchange can defer both). Figures are a year-1 estimate at your 24.0% rate — not tax advice; consult a CPA.
Schools (NCES district)
- District
- Wise County Public School District
- NCES district ID
- 5104080
- Math proficiency
- 74% ▼ -20.00%
- Reading proficiency
- 79% ▼ -7.00%
- Median HH income
- $35,624
- Composite
- 63.37/100
- National rank
- #625
- State rank
- #11 of 131 in VA
Livability — Riverview
- Score
- 55/100
- State rank
- #516
- US rank
- #23306
Category grades
Schools grade is shown separately in the Schools card above.
Census & demographics
- Census place
- Riverview, VA
- Population (ZIP)
- 7,057
Population outlook (Wise County) Hauer SSP2
- Today (2025)
- 35,714 people
- By 2030
- 33,742 · -5.5%
- By 2040
- 29,870 · -16.4%
- By 2050
- 26,233 · -26.5%
- By 2075
- 18,296 · -48.8%
- By 2100
- 12,147 · -66.0%
Race, ethnicity, and origin ACS 2023
- Neighborhood character
- Predominantly White (93%)
- Race & ethnicity
- White 93% Black 3% Hispanic / Latino 1%
- Common ancestry
- Slovak 2% Italian 2% Serbian 1%
- Foreign-born
- 2% · Canada
- Languages at home
- 98% English-only · Spanish 1%
Political lean MEDSL · Wise
- 2024 margin
- Solid R (+63.3) · D 18.1% · R 81.4%
- 2008→2024 swing
- -35.6pp toward R · 2008: -27.7pp · 2024: -63.3pp
- All cycles
- 2024: R+63.3 2020: R+61.7 2016: R+62.0 2012: R+48.8 2008: R+27.7
Not yet ingested
- Civics
- —
Market trends
- HPI YoY
- ▲ 0.07%
- Current HPI
- 135.5947
- Rent YoY
- —
- Metro
- —
- State GDP YoY
- ▲ 2.40%
- F500 in state
- 50
Industry mix (Fortune 500 HQ in VA)
| Industry | F500 HQs | Revenue |
|---|---|---|
| Aerospace / Defense | 4 | $236B |
|
||
| Technology / Defense | 3 | $32B |
|
||
| Financial Services | 2 | $176B |
|
||
| Utilities | 2 | $27B |
|
||
| Insurance | 2 | $25B |
|
||
| Technology | 2 | $15B |
|
||
Price history
1 event — show timeline
- 2026-03-24 Listed $165,000 TVRMLS
Property tax history
+1.7%/yrLatest (2025): $442 · +0.0% YoY. Source: county tax records.
Cash-flow waterfall
monthlySold comps — $/sqft
last 12 mo · ≤1 miLoading sold comps…