21234 G #36685 · Rehoboth Beach, DE
Flood risk 7/10 · Major
- FEMA flood zone
- AE
- Chance of flooding over 30 yrs
- 0.96%
- Est. flood insurance / yr
- $2,026 – $9,024
Fire risk 1/10 · Minimal
- Est. fire insurance / yr
- $476 – $884
Heat risk 8/10 · Major
- Hot days now (above 100°F)
- 7 days/yr
- Hot days in 30 yrs
- 18 days/yr
Wind risk 8/10 · Major
- Chance of severe wind over 30 yrs
- 80.0%
Air-quality risk 2/10 · Minimal
- Unhealthy air days now
- 1 days/yr
- Unhealthy air days in 30 yrs
- 1 days/yr
Risk factors via First Street. Map © Google.
Why this score? — see what drove the B grade
The composite is a weighted blend of 9 inputs, each scored 0–100. Each bar is that input's sub-score; the figure is the points it added to the 100-point composite (weight × sub-score).
- Cash flow +30.0/30.0
- 1% rule +10.0/10.0
- DSCR +10.0/10.0
- ARV discount +9.6/15.0
- Schools +4.2/10.0
- Livability +3.6/5.0
- Rent growth +2.5/5.0
- Condition / age +2.5/5.0
- Appreciation +0.0/10.0
$110,000
🖨 Deal sheet (PDF) 📄 Offer letter ✓ Due diligence
Listing remarks MLS
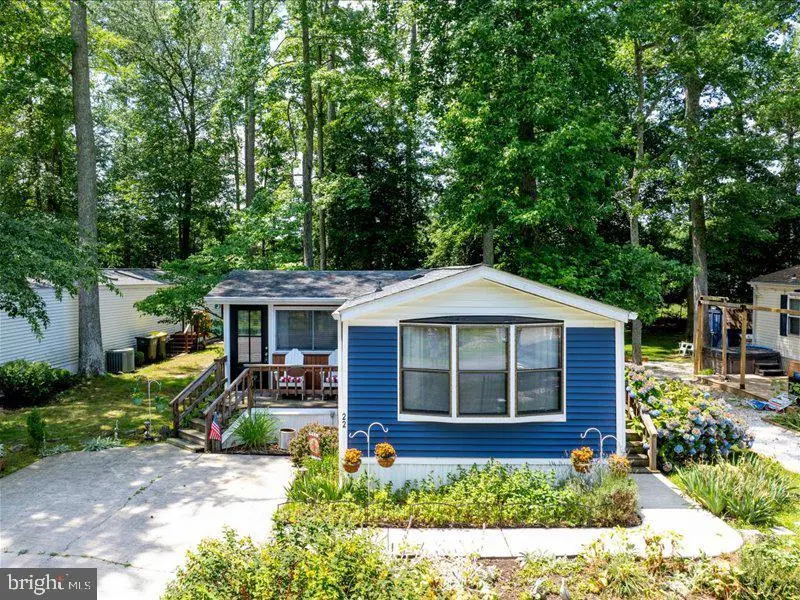
Experience coastal living in this vibrant, amenity-rich Rehoboth Bay MHP community. This charming home features two bedrooms positioned at opposite ends for added privacy. Enjoy your morning coffee or an afternoon drink on the screened porch or the small front deck, which overlooks the fountain pond. If you enjoy gardening, you'll love the beautiful flower garden space where you can plant your favorites or care for the existing plants. Situated about 4 miles from the Rehoboth Beach Boardwalk, this home offers an affordable vacation getaway or a perfect year-round residence in Rehoboth. Discover why this home is ready to be enjoyed in any season and why it might be the ideal choice for you!
Key facts
- 151.03 acre lot
- Community pool
- Built 1986
Neighborhood map
What this means for you Summary
Snapshot
- This is a 2-bed/2.0-bath manufactured listed at $110k.
Deal economics
- At list price, monthly cash flow is $686 ($8k/yr) — positive.
- The deal already cash-flows at list — no discount required.
- Meets the 1% rule at list price ($2k rent vs $110k).
- Recommended offer: $103k (6.0% below list) — sets the bar for market timing.
- Cap rate 18.8% vs local median 1.1% in Rehoboth Beach — top-decile yield for the area; either an underpriced asset or a hidden risk that comps aren't pricing in. Stress-test before assuming the spread holds.
Location & tenants
- Location reads 71/100 on livability (#20 in DE) — a middle-class / working-renter tenant base. Strengths: schools A+, amenities A+, employment A+; Watch: crime F, commute F, cost of living F.
- Cape Henlopen School District (town): math 42% / reading 55% proficiency, ranked #5 of 26 in DE (top 19%) — families likely to look elsewhere, expect single-tenant / working-renter base with shorter leases.
- Market conditions: 331 active listings in the ZIP; 1 comparable units currently listed for rent nearby; solid renter incomes; 4,354 units permitted in Sussex County in 2024 (344 in 5+ unit buildings).
Forward outlook
- Local home prices are declining (-3.0%/yr); year-one equity from $761 of loan paydown is wiped out by about $3k of value loss. Plan a longer hold.
- Sussex County population projected at +25% by 2050 — long-run rental-demand tailwind backs the buy-and-hold thesis.
- At projected returns (-3.0% appreciation + 3.0% rent growth), your $31k cash investment doubles in ~5 years — after that, you're playing with house money.
Negotiation context
- It's been on market 71 days — a 6% lower offer ($103k) is reasonable based on typical stale-listing flexibility.
- 5 sale attempts since 20y ago; this cycle's ask has dropped $10k (8%) from the opening price — seller is motivated, your offer sets the floor, not the list.
- Current owner paid $56k; list at $110k implies a 96% gain — meaningful room to come down on a strong offer.
Risks & watch-outs
- Watch-outs: flood insurance adds $460/mo.
- Climate carrying-cost: in FEMA flood zone AE (mandatory federal flood insurance); severe wind risk, 80% chance of damaging wind over 30y; extreme-heat days projected 7→18/yr by 2055 (HVAC capex compounding) — expect insurance premiums to compound above CPI over the hold.
Questions for the listing agent
- It's been on market 71 days. Have you received any prior offers? Is the seller open to a 6% concession, seller financing, or rate buy-down credit?
- What's the actual annual flood-insurance premium (NFIP or private), and is the property in a SFHA with mandatory coverage?
- Why hasn't it sold? Are there any deal-killer items the seller is aware of (foundation, flood, title, zoning, code violations)?
- Is there a deadline driving the sale (1031 exchange, divorce, estate, relocation)? That informs how much negotiation room exists.
- Schools are A-rated — typically a magnet for longer-tenancy family renters. What's the average tenant stay here, and is there a school-zone premium baked into asking?
- Crime grade is F in this area — have there been break-ins, vandalism, or insurance claims at this property in the last 3 years? What carrier currently insures it and at what premium?
- What's the average days-on-market for RENTAL listings here right now (not sales)? A rising rental-DOM trend means longer vacancies and softer asking-rent achievability than the comps imply.
- What's the recent tenant-quality profile in this submarket — average credit score on applications, eviction rate, late-payment / NSF rate, and stable-employment percentage? A property-management company in the area should have these aggregated.
- How much new for-sale + rental construction is in the pipeline within 1–3 miles? Heavy new supply typically softens prices + rents 12–24 months out; constrained supply supports both.
Investment metrics
- 1% rule
- 2.19% ✓
- Cap rate
- 18.80%
- Cash-on-cash
- 44.66%
- DSCR
- 2.99
- GRM
- 3.8
CMA / ARV
- ARV (median comp)
- $115,362
- List price
- $110,000
- Delta
- -4.65%
- Verdict
- FAIR
- Comps
- 20 within 1.0 mi
Show comp detail 4 sales within ~0.75 mi
| Address | Dist | Beds/Ba | Sqft | Sold | Price | $/sf | Match |
|---|---|---|---|---|---|---|---|
| 21787 B St Unit B-14 | 0.56mi | 3/1.0 (+1) | 900 (-8%) | 5mo | $140,000 | $156 | 47 |
| 21754 B St #4028 | 0.52mi | 2/1.0 | 900 (-8%) | 20mo | $129,900 | $144 | 42 |
| 21791 C St #4065 | 0.56mi | 3/1.0 (+1) | 1,080 (+10%) | 8mo | $75,000 | $69 | 41 |
| 21739 A St | 0.48mi | 2/1.0 | 900 (-8%) | 23mo | $65,000 | $72 | 41 |
Match score weights: distance 35% · size 25% · config 20% · recency 20%. Top-matched comps best support the ARV.
Projected returns pro-forma
-3.0% appreciation · 3.0% rent growth · sell at horizon
- IRR
- 20.8%
- Equity multiple
- 1.85×
- Total profit
- $26,171
- Equity at exit
- $16,401
- IRR
- 29.1%
- Equity multiple
- 3.61×
- Total profit
- $80,326
- Equity at exit
- $9,511
Cash invested: $30,800 (down + closing). Projections, not guarantees.
Landlord ↔ Tenant lean methodology
- Overall (STATE)
- 70 Landlord-Friendly
- State Delaware
- 70 Landlord-Friendly · D+7
- County
- — inherits STATE
- City
- — inherits STATE
ZIP-level market 19971
- Active inventory
- 331
- Price-to-rent
- 3.8×
Monthly cashflow live
- Estimated rent
- $2,413 medium interval (Pro) →
- Mortgage (P&I)
- −$577
- Tax est. 1.5%
- −$138 /mo · $1,650/yr
- Insurance
- −$46
- Flood insurance flood zone
- −$460 /mo · $5,525/yr
- HOA
- −$0
- Vacancy / Maint / Mgmt
- −$507
- Net cashflow
- $686
Break-even live
Sensitivity live
| Price | -10% $762 | -5% $724 | +0% $686 | +5% $648 | +10% $610 |
|---|---|---|---|---|---|
| Rent | -10% $495 | -5% $590 | +0% $686 | +5% $781 | +10% $876 |
| Rate | -1.0pp $741 | -0.5pp $714 | base $686 | +0.5pp $657 | +1.0pp $628 |
UW: 25.0% down · 7.5% · 30yr · 1.5% tax · 5.0% vac · 8.0% maint · 8.0% mgmt
Financing live
Cash to close
- Down payment
- $27,500
- Closing costs
- $3,300
- Reserves months
- —
- Total cash needed
- —
Loan-product check · same deal, 3 products live
Conventional
25% down · 7.5% · 30yr
- Down + closing
- —
- Monthly P&I
- —
- Monthly cashflow
- —
- DSCR
- —
- Eligible?
- —
Personal DTI + credit; lowest rate.
DSCR
20% down · 8.5% · 30yr
- Down + closing
- —
- Monthly P&I
- —
- Monthly cashflow
- —
- DSCR
- —
- Eligible?
- —
No personal income docs; deal must DSCR.
Hard money
10% down · 12.0% · 12mo
- Down + closing
- —
- Monthly P&I
- —
- Monthly cashflow
- —
- DSCR
- —
- Eligible?
- —
Short-term bridge; refi at stabilization.
Rent comps 1 comps
| Address | Beds | Baths | Sqft | Rent | $/sqft | DOM | Units | Dist |
|---|---|---|---|---|---|---|---|---|
| 36400 Warwick Dr Rehoboth Beach, DE | 3.0 | 2.5 | 792 | $3,500 | $4.42 | 45d | 1 | 0.63mi |
Listing history 30 events
-
2026-06-18days on market $110,000 Active 71 DOM
-
2026-06-17days on market $110,000 Active 70 DOM
-
2026-06-16days on market $110,000 Active 69 DOM
-
2026-06-15days on market $110,000 Active 68 DOM
-
2026-06-14days on market $110,000 Active 66 DOM
-
2026-06-13days on market $110,000 Active 65 DOM
-
2026-06-10days on market $110,000 Active 63 DOM
-
2026-06-09days on market $110,000 Active 62 DOM
-
2026-06-08days on market $110,000 Active 61 DOM
-
2026-06-07days on market $110,000 Active 60 DOM
-
2026-06-05days on market $110,000 Active 57 DOM
-
2026-06-03days on market $110,000 Active 56 DOM
-
2026-06-02days on market $110,000 Active 55 DOM
-
2026-06-01days on market $110,000 Active 54 DOM
-
2026-05-31days on market $110,000 Active 53 DOM
-
2026-05-30days on market $110,000 Active 52 DOM
-
2026-04-09$119,900 Active 698-char remark
Show marketing remark (698 chars)
Experience coastal living in this vibrant, amenity-rich Rehoboth Bay MHP community. This charming home features two bedrooms positioned at opposite ends for added privacy. Enjoy your morning coffee or an afternoon drink on the screened porch or the small front deck, which overlooks the fountain pond. If you enjoy gardening, you'll love the beautiful flower garden space where you can plant your favorites or care for the existing plants. Situated about 4 miles from the Rehoboth Beach Boardwalk, this home offers an affordable vacation getaway or a perfect year-round residence in Rehoboth. Discover why this home is ready to be enjoyed in any season and why it might be the ideal choice for you!
-
2026-04-08historical $119,900 698-char remark
Show marketing remark (698 chars)
Experience coastal living in this vibrant, amenity-rich Rehoboth Bay MHP community. This charming home features two bedrooms positioned at opposite ends for added privacy. Enjoy your morning coffee or an afternoon drink on the screened porch or the small front deck, which overlooks the fountain pond. If you enjoy gardening, you'll love the beautiful flower garden space where you can plant your favorites or care for the existing plants. Situated about 4 miles from the Rehoboth Beach Boardwalk, this home offers an affordable vacation getaway or a perfect year-round residence in Rehoboth. Discover why this home is ready to be enjoyed in any season and why it might be the ideal choice for you!
-
2025-10-14historical
-
2025-08-05price $119,500
-
2025-07-15price $124,900
-
2025-06-21price $129,900
-
2025-06-20$129,999 Active
-
2008-09-17soldstatus $56,000
-
2008-05-09$59,900
-
2007-08-21historical
-
2007-06-03$59,000
-
2006-06-27soldstatus $55,000
-
2006-06-15historical
-
2006-05-20$59,900
ⓘ Source: listings_history table (triggers on properties + properties_extension) + one-shot
backfill from property_details.listing_events for pre-trigger history.
Climate risk First Street
- Flood 7/10 Severe FEMA zone AE · 96% chance over 30 yrs
- Wildfire 1/10 Low
- Heat 8/10 Severe 7 d/yr ≥100°F today · 18 d/yr by 30 yrs out
- Wind 8/10 Severe 80% chance of damaging wind over 30 yrs
- Air quality 2/10 Low 1 unhealthy d/yr today · 1 by 30 yrs out
Nearby sold comps map
Loading sold comps map…
Walkable amenities ~0.75 mi
Loading nearby amenities…
Taxation est. · year 1
- Rental income
- $28,957
- − Mortgage interest
- −$6,162
- − Property taxes
- −$1,650
- − Insurance
- −$6,075
- − Repairs & maintenance
- −$2,317
- − Management
- −$2,317
- − Depreciation
- −$3,200
- Taxable income
- $7,237
- Est. tax owed @ 24.0%
- −$1,737
- After-tax cash flow
- $6,492/yr
For passive investors: Depreciation is non-cash, so a rental often shows a tax loss while cash-flowing — sheltering income. Rental losses are passive: they offset passive income freely, and up to $25,000/yr can offset ordinary (W-2) income if you actively participate and your MAGI is under $100k (phasing out to $0 by $150k); unused losses carry forward. On sale, claimed depreciation is recaptured at up to 25%, and gains may owe capital-gains tax (a 1031 exchange can defer both). Figures are a year-1 estimate at your 24.0% rate — not tax advice; consult a CPA.
Schools (NCES district)
- District
- Cape Henlopen School District
- NCES district ID
- 1000170
- Math proficiency
- 42% ▼ -14.00%
- Reading proficiency
- 55% ▼ -10.00%
- Median HH income
- $60,196
- Composite
- 42.47/100
- National rank
- #3214
- State rank
- #5 of 26 in DE
Livability — Rehoboth Beach
- Score
- 71/100
- State rank
- #20
- US rank
- #6520
Category grades
Schools grade is shown separately in the Schools card above.
Census & demographics
- County
- Sussex County · 82,708 people
- City population
- 14,886
- Metro
- Salisbury, MD-DE
- Population (ZIP)
- 14,886
- Household income
- $102,146
- Rent vs Own
- Severe rent burden
- 317.0
Population outlook (Sussex County) Hauer SSP2
- Today (2025)
- 248,853 people
- By 2030
- 264,464 · +6.3%
- By 2040
- 290,980 · +16.9%
- By 2050
- 311,259 · +25.1%
- By 2075
- 352,488 · +41.6%
- By 2100
- 367,406 · +47.6%
Race, ethnicity, and origin ACS 2023
- Neighborhood character
- Predominantly White (88%)
- Race & ethnicity
- White 88% Black 4% Two or more races 4% Hispanic / Latino 3% Asian 2%
- Common ancestry
- Romanian 5% Slovak 3% Italian 3%
- Foreign-born
- 6% · Canada, China
- Languages at home
- 95% English-only · Spanish 2% Russian/Polish/Slavic 1% French/Haitian/Cajun 1%
Political lean MEDSL · Sussex
- 2024 margin
- R (+11.0) · D 43.9% · R 54.9% · Other 1.2%
- 2008→2024 swing
- -2.4pp toward R · 2008: -8.6pp · 2024: -11.0pp
- All cycles
- 2024: R+11.0 2020: R+11.2 2016: R+22.0 2012: R+13.0 2008: R+8.6
Not yet ingested
- Civics
- —
Market trends
- HPI YoY
- ▼ -220.39%
- Current HPI
- 353.3977
- Rent YoY
- —
- Metro
- Salisbury, MD-DE
- State GDP YoY
- —
- F500 in state
- 0
Price history
+100.2% since first listed14 events — show timeline
- 2026-04-09 Listed $119,900 BRIGHT MLS
- 2026-04-08 Coming Soon $119,900 BRIGHT MLS
- 2025-10-14 Listing Removed — BRIGHT MLS
- 2025-08-05 Price Changed $119,500 BRIGHT MLS
- 2025-07-15 Price Changed $124,900 BRIGHT MLS
- 2025-06-21 Price Changed $129,900 BRIGHT MLS
- 2025-06-20 Listed $129,999 BRIGHT MLS
- 2008-09-17 Sold (MLS) $56,000 BRIGHT MLS
- 2008-05-09 Listed $59,900 BRIGHT MLS
- 2007-08-21 Listing Removed — BRIGHT MLS
- 2007-06-03 Listed $59,000 BRIGHT MLS
- 2006-06-27 Sold (MLS) $55,000 BRIGHT MLS
- 2006-06-15 Listing Removed — BRIGHT MLS
- 2006-05-20 Listed $59,900 BRIGHT MLS
Cash-flow waterfall
monthlySold comps — $/sqft
last 12 mo · ≤1 miLoading sold comps…